 Shuangyu Gu
 Xianghua Yu
 Chen Bai
 Junwei Min
 Runze Li1
 Yanlong Yang
 Baoli Yao
- 1State Key Laboratory of Transient Optics and Photonics, Xi’an Institute of Optics and Precision Mechanics, Chinese Academy of Sciences, Xi’an, China
- 2University of Chinese Academy of Sciences, Beijing, China
Light-sheet fluorescence microscopy (LSFM) is a kind of volumetric imaging methodology suited for long term living specimens at high temporal-spatial resolution. A single Airy beam (SAB) light-sheet can extend the field of view of Light-sheet fluorescence microscopy benefiting from its non-diffracting nature, but at the cost of out-of-focus background and low imaging contrast caused by side lobes illumination. Here, we propose a method to generate a sort of multiple Airy beams (MAB), which are linearly superimposed of multiple single Airy beams with different scale factors. Compared to the SAB light-sheet, the energy of the multiple Airy beams light-sheet is more concentrated on the focal plane of the detection objective, which can improve the imaging contrast and decrease the photodamage effect. Furthermore, we combined the complementary beam subtraction (CBS) strategy to increase the axial resolution, termed as multiple Airy beams-complementary beam subtraction method, which enables the axial resolution of 1.2 μm while keeping the field of view of 450 μm × 450 μm. The effectiveness of the method is demonstrated by imaging of fluorescent beads and aspergillus conidiophores.
1 Introduction
Light-sheet fluorescence microscopy (LSFM) [1], also referred to as selective plane illumination microscopy (SPIM) [2], uses a scheme of selective planar illumination of samples and a orthogonal wide-field detection. LSFM is ideally suited for long term volumetric imaging of living specimens at high temporal-spatial resolution. LSFM confines the potentially damaging illumination to the in-focus region of the specimen, which minimizes the harmful phototoxicity and photobleaching. Due to these characteristics, LSFM has been successfully used in the fields of developmental biology [3], functional imaging [4], cell biology [5], plant and algae research [6], whole-brain imaging [7], and so on.
In LSFM, the properties of light-sheet (thickness, propagation length, intensity distribution, etc.) are critical to the final image quality. Traditional LSFM uses a single Gaussian beam light-sheet for illumination, where the imaging field of view (FOV) and the axial resolution are mutually restricted [8]. There is a tradeoff between the axial resolution and the imaging FOV. Higher axial resolution can be achieved by using higher numerical aperture illumination objectives, but at the cost of a narrower light-sheet and smaller FOV. Many approaches have been proposed to address this issue, such as tiling light-sheet selective plane illumination microscopy (TLS-SPIM) [9], extended focusing [10], axially swept light-sheet microscopy [11], multiple focus-shifted Gaussian beam arrays [12], multidirectional selective plane illumination microscopy (mSPIM) [13], digital adaptive optics scanning light-field mutual iterative tomography (DAOSLIMIT) [14], and so forth.
The employment of non-diffracting beams (e.g., Bessel beams [15], Airy beams [16], optical lattices [5] and Field synthesis light-sheet [17]) is another kind of approaches to expand the FOV of LSFM while keeping the axial resolution. Fahrbach et al. [15] proved the superior propagation ability of Bessel beams through inhomogeneous scattering media. Vettenburg et al. [18] had experimentally demonstrated that the Airy beam shows up to a tenfold and fourfold increase in FOV compared to the Gaussian and Bessel beam light-sheets, respectively, while sustaining the high axial resolution. However, the side lobes of the non-diffracting beams bring unfavorable background fluorescence excitation, reducing the axial resolution and the image contrast. Although other techniques, such as two-photon excitation [19], the confocal technique [20], structured sheet illumination [21], can help to eliminate the out-of-focus background, they either increase the complexity of the system or reduce the imaging speed.
In this paper, we propose a method to generate a sort of multiple Airy beams (MAB) by modifying the single Airy beam (SAB) phase spectrum. Compared with the SAB light-sheet, the energy of the MAB light-sheet is more concentrated on the focal plane of the detection objective, which can suppress the side lobes and enhance the image contrast. Furthermore, the axial resolution is further improved with the complementary beam subtraction (CBS) method, termed as MAB-CBS method. The imaging performance is validated experimentally with fluorescent beads and aspergillus conidiophores.
2 Materials and methods
Planar single Airy beam [22, 23] has a parabolic trajectory parallel to the focal plane of the detection objective, whose light-sheet has xy-plane symmetry. This avoids the limitation of the parabolic illumination on the selection of depth of field of the detection objective. The planar SAB light-sheet can be created by rapidly scanning a 45°-rotated 2D finite-energy SAB that has an initial intensity distribution as
where the light-sheet is assumed to propagate in the y-direction, Ai (·) indicates the planar Airy function, x0 and z0 are the arbitrary transverse scale and assumed that x0 = z0, ω is a decay factor to ensure the physical realization of the planar SAB [24, 25]. Its Fourier spectrum is given by
where u and v are normalized spatial spectral coordinates, the dimensionless parameter α determines the propagation invariance of the planar SAB [18].
In order to generate the MAB with suppressed side lobes, we design by modifying the spatial spectrum of SAB, and the spatial spectrum of the MAB is given by
where sign(ζ) denotes the sign function, with ζ > 0, sign(ζ) = 1; ζ = 0, sign(ζ) = 0; ζ < 0, sign(ζ) = -1. To simplify Eq. 3, let
Because Eq. 4 is a periodic function of the variable θ with period 2π, it can be represented by a Fourier series:
Considering the odd function, thus an ≡ 0. The solution of Eq. 5 is:
The complex amplitude of the MAB can be obtained by making a Fourier transform of Eq. 6:
Eq. 7 shows that the MAB is linearly superimposed of infinity SABs with different scale factors. The high-order Airy beam intensity decreases inversely in proportion to the square of the coefficient (2m-1). When the value of m is 50, the intensity reduces to 1/10,000. The light-sheets can be obtained by scanning the beams along the x-axis. Compared with the SAB light-sheet, the energy of the MAB light-sheet is more concentrated on the focal plane of the detection objective, and the side lobes are relatively suppressed down, which shows that the MAB light-sheet can reduce out-of-focus background and improve the image contrast.
Furthermore, the complementary beam subtraction (CBS) method [23, 26, 27] was used to improve the axial resolution. The complementary beam of the MAB (termed as MCB) can be generated by adding 0-π phase step to the spatial spectrum (Eq. 3), resulting in:
The Fourier transform of 0-π phase step (i.e., sign(v)) is:
Eq. 9 means that the spatial spectrum of 0-π phase step induced destructive interference causes the focal point to split into two foci with an intermediate intensity of zero. The Fourier transform of Eq. 8, i.e., the complex amplitude distribution of MCB, could be obtained by Eq. 7, Eq. 9 with the convolution theorem:
The MCB light-sheet has an interlayer being of zero intensity at focal plane of detection objective (xy-plane). The effective MAB-CBS light-sheet is obtained by subtraction of the MAB light-sheet and the MCB light-sheet. Compared with the SAB-LS and the MAB-LS, a higher axial resolution is retrieved with the proposed MAB-CBS method. The subtraction of multiple images to enhance the axial resolution has also been realized by photobleaching imprinting strategy [28].
3 Experimental setup
The schematic diagram of the LSFM system is shown in Figure 1A. A 488 nm CW laser (NovaPro Fiber 488–90 SM, RGB Photonics Inc.) is invoked as a light source. A lens (f1 = 50 mm) is placed behind for collimation, and a polarizer is utilized to output a horizontally polarized beam. The beam is reflected by a triangular reflector onto a phase-only spatial light modulator (PLUTO-2-NIR011, Holoeye Inc.). By addressing the specially designed computer-generated-holograms (CGHs) as shown in Figure 1B on the spatial light modulator, three kinds of non-diffracting beams, i.e., the single Airy beam, the multiple Airy beams and the complementary beam of MAB, are produced respectively, which are then conjugated to a galvanometer mirror (GVSM002/M, Thorlabs Inc.) through a pair of relay lenses (f2 = 300 mm, f3 = 100 mm). The undesired diffraction orders from the spatial light modulator (SLM) are filtered out by the iris aperture at the focal plane of lens 2. The light-sheet, generated by scanning the galvanometer mirror along the x-direction, is sent to the excitation objective (×10 NA 0.45/WD 19mm, 58–372, Edmund Inc.) through a beam expander (f4 = 39 mm, f5 = 125 mm). The detection objective (Water dipping, NA 0.8/WD 3 mm, CFI Apo 16XW NIR, Nikon Inc.) whose focal plane coincides with the light-sheet in xy plane collects the fluorescent signal emanating from the focal area of the sample, and then imaged through a zoom lens (f6 = 300 mm) to a sCMOS camera (100 fps @ 2048 pixels × 2048 pixels, pixel size: 6.5 µm, Flash 4.0 V3, Hamamatsu Inc.). The overall system magnification of LSFM is ×24. An emission filter (NF03-405/488/532/635 E25, Semrock Inc.) located in the detection path is used to block the illumination light. By using a motorized translation stage (MTS25-Z8, Thorlabs Inc.), volumetric imaging is achieved by moving the sample through the light-sheet and sequentially taking images at different depths in z-axis. Samples are mounted on agarose inside glass capillaries or slides, and loaded into water filled custom-designed 3D-printed chamber.
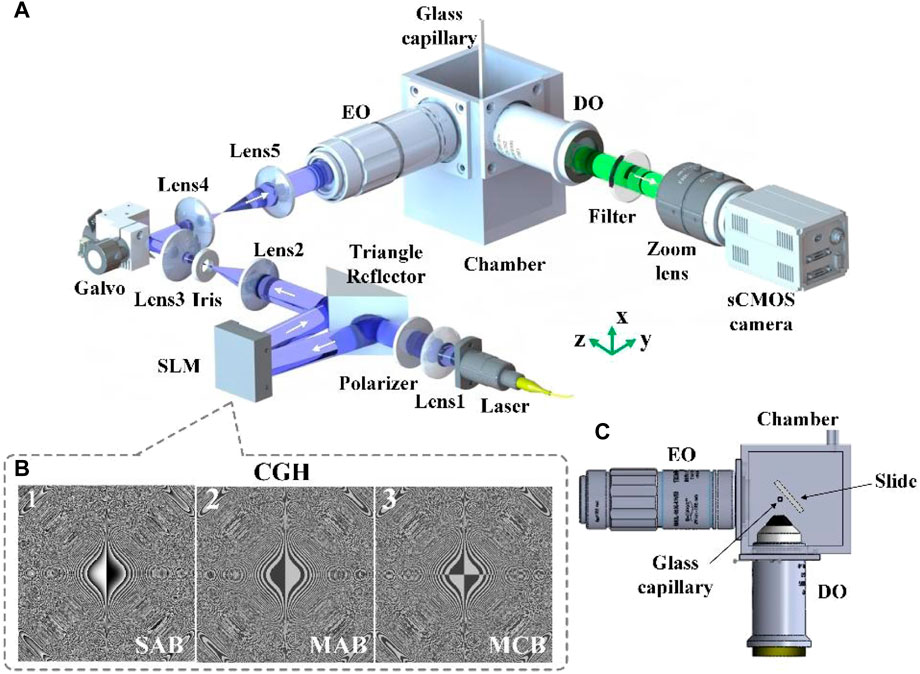
FIGURE 1. (A) The schematic diagram of the LSFM system. (B) Computer-Generated-Holograms (CGHs) of the SAB, MAB and MCB, respectively. (C) Top-view of the specimen chamber. SLM: spatial light modulator; EO: excitation objective; DO: detection objective.
Compared with our previous LSFM system [23], several improvements are made as follows: The excitation objective was changed from a ×40 water dipping objective to a ×10 long working distance air objective (NA 0.45/WD 19 mm, 58–372, Edmund Inc.). Since the air excitation objective is mounted outside the sample chamber, larger chamber space facilitates mounting and movement of standard slides samples [Figure 1C]. The ×40 detection objective (Water dipping, NA 0.8/WD 3.5 mm, CFI Apo 40XW NIR, Nikon Inc.) was replaced with a lower magnification objective (Water dipping, NA 0.8/WD 3 mm, CFI Apo 16XW NIR, Nikon Inc.). With the same NA, the ×16 detection objective can support a larger FOV without sacrificing the lateral resolution.
To measure the transversal cross-sectional (xz-plane) intensity distribution of the non-diffracting beams, a plano mirror at a 45° angle with respect to both the optical axes of the two objectives is placed in the sample chamber to reflect the beams to the sCMOS camera. The measured intensity distributions of the single Airy beam, the multiple Airy beams and the multiple complementary beam are shown in Figure 2D–F, which show good agreement with the theoretical results as shown in Figure 2A–C. The light-sheet is generated by rapidly scanning the galvanometer mirror along the x-axis, and the intensity distribution of the single Airy beam light-sheet (SAB-LS), the multiple Airy beams light-sheet (MAB-LS) and the multiple complementary beams light-sheet (MCB-LS) are measured as shown in Figure 2G–I. To analyze the characteristics of different light-sheets, the intensity profiles along z-axis are plotted in Figure 2J. The main lobe energy ratio (defined as the ratio of the energy of the main lobe to the total energy of the light-sheet) increases from 30% of the SAB-LS to 37% of the MAB-LS as shown in Figure 2J1. Fewer side lobes of MAB-LS can reduce the out-of-focus background and improve the image contrast and the optical sectioning capability. The MAB-CBS light-sheet (Figure 2J3) can be obtained by subtraction of the MAB light-sheet with the MCB light-sheet, which can enhance the axial resolution compared with the SAB-LS and the MAB-LS.
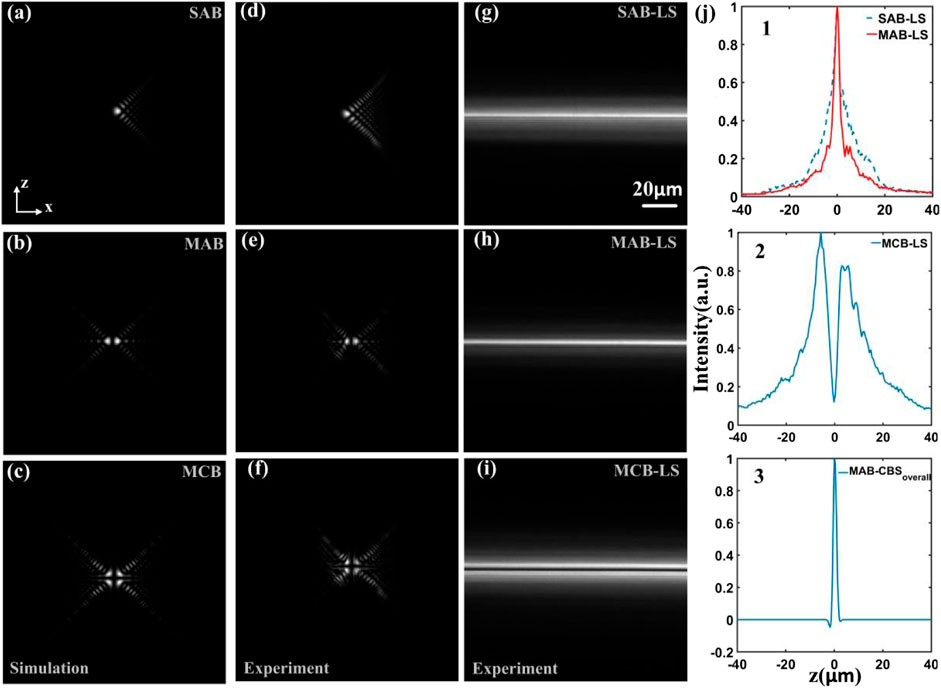
FIGURE 2. Numerical simulation and experimental measurement of the SAB, the MAB and the MCB. (A–C) numerical simulation in the transversal (xz-plane) of the SAB, MAB and MCB, respectively. (D–F) experimental measurement of the transversal cross-sections. (G–I) The transversal (xz-plane) cross-sections of the SAB light-sheet, MAB light-sheet and MCB light-sheet, respectively. The scan direction is along the x-axis. (J) The intensity profiles along the z-axis in (G–I).
4 Results and discussion
Imaging experiments were firstly performed on 500 nm-diameter fluorescent beads to verify the properties of the MAB-CBS method. A series of image stacks (200 slices with axial interval 0.3 μm @ 2048 × 2048 pixels) were acquired by illuminating the fluorescent beads with CGHs (for SAB, MAB and MCB respectively) alternately loaded on the SLM. Figure 3A is the maximum intensity projection (MIP) image of yz-plane obtained with the SAB light-sheet, which covers the entire FOV of 450 μm × 450 μm. The MAB light-sheet (Figure 3B) can cover the same large FOV. The image in Figure 3C is obtained by subtracting the two image stacks of the SAB light-sheet and the MCB light-sheet for each slice. It can be seen that the axial resolution and contrast are clearly improved with the MAB-CBS method. Figure 3D present the normalized axial intensity profiles of the corresponding beads selected in Figure 3A–C. To quantify the axial resolution, we selected 100 fluorescent beads to analyze their FWHMs, and the statistical average value was used as the axial resolution. The statistical axial FWHMs are: 2.6 μm for SAB light-sheet [Figure 3A], 2.6 μm for MAB light-sheet [Figure 3B], and 1.2 μm for MAB-CBS [Figure 3C]. The proposed MAB-CBS method can cover the field of view of 450 μm × 450 μm while keeping the axial resolution of 1.2 μm. As a comparison, the single Gaussian beam light-sheet has the FOV of only 37 μm when the axial resolution is 1.2 μm [29]. Thus, the MAB-CBS method enables a twelve-fold increase in FOV without sacrificing the axial resolution.
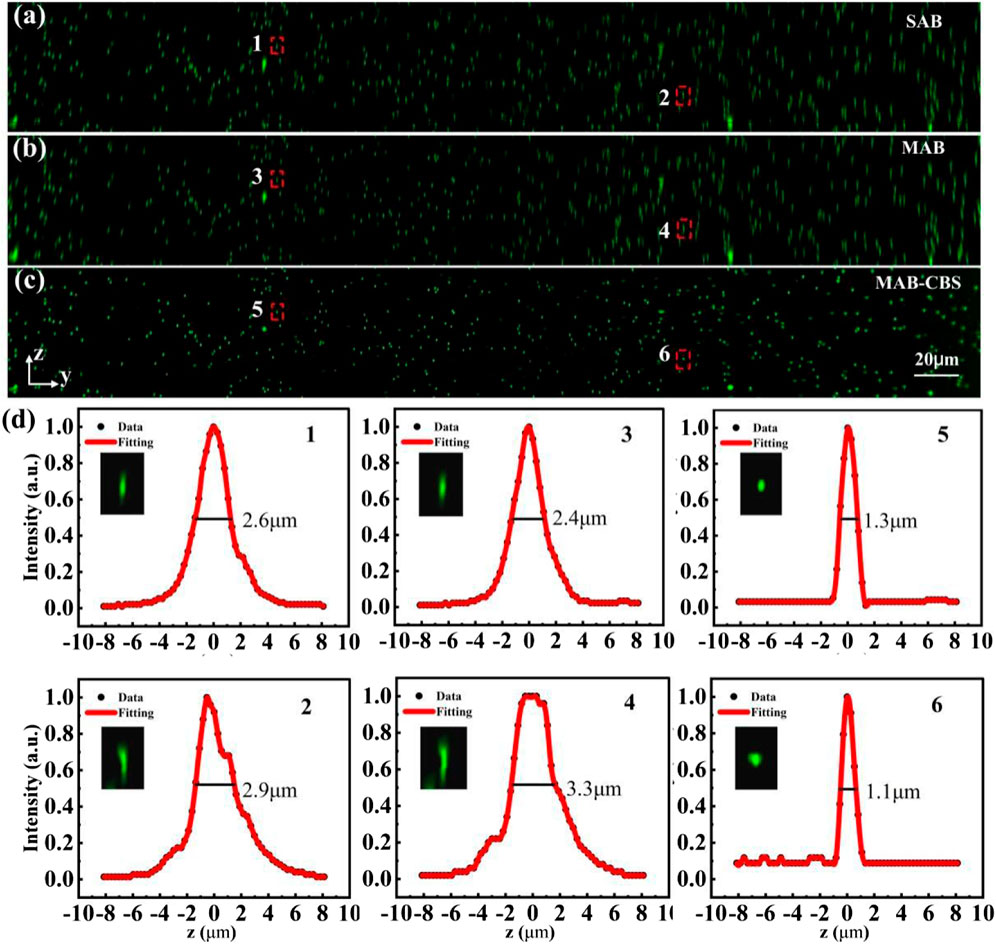
FIGURE 3. Imaging results of 500 nm-diameter fluorescent beads. (A–C) The yz-plane maximum intensity projection (MIP) images of fluorescent beads excited by using the SAB light-sheet, MAB light-sheet and MAB-CBS method, respectively. (D) The normalized intensity profiles along the z-axis of the fluorescent beads selected in (A–C). The insets are the magnified views of the selected beads indicated by the dashed box in (A–C).
Next, we performed imaging experiments on the aspergillus conidiophores (Carolina Inc.) to compare the imaging performance. Each stack of raw images contains 200 slices @ 2048 × 2048 pixels with an axial interval of 1 μm. The 3D imaging results of SAB light-sheet and MAB-CBS method are shown in Figures 4A,B, respectively. Moreover, the MIP images of the xz-plane obtained with the SAB light-sheet, the MAB light-sheet and the MAB-CBS are shown in Figure 4C–E, respectively. Because the energy of the MAB light-sheet is more concentrated on the focal zone, the images obtained with the MAB light-sheet provide better contrast compared to the SAB light-sheet. The MAB-CBS method further effectively removes the out-of-focus background and improves the axial resolution. The normalized intensity profiles along z-axis (i.e., the red dotted lines in zoom figures) and along x-axis (i.e., the yellow dashed lines in zoom figures) are plotted in Figures 4F,G, which further highlight the superior imaging properties of the MAB-CBS method.
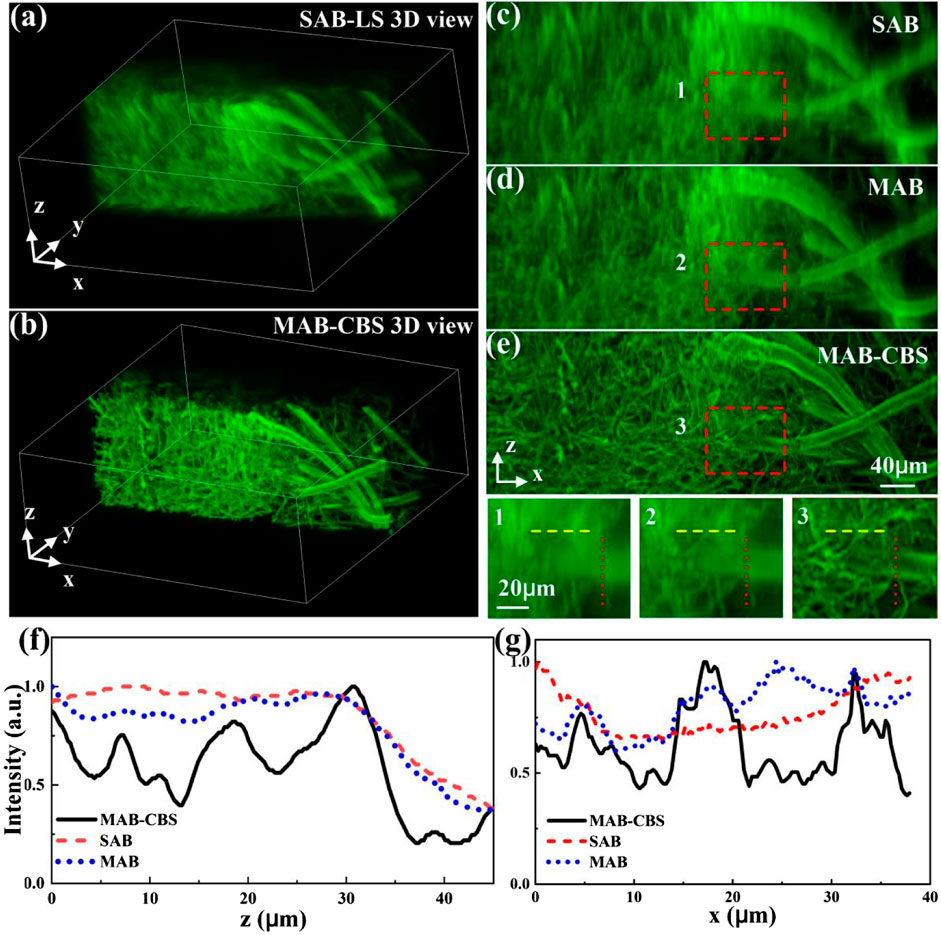
FIGURE 4. Imaging results of aspergillus conidiophores excited by 488 nm laser. (A) and (B) The 3D views of the sample imaged by using the SAB light-sheet and the MAB-CBS method, respectively. (C–E) The xz-plane MIP images of the sample by using the SAB light-sheet, the MAB light-sheet and the MAB-CBS method. 1, 2, 3, are the zoom-in parts of the marked areas indicated in (C–E). (F) and (G) The normalized intensity profiles along the red dotted lines and along the yellow dashed lines in 1, 2, 3, respectively.
CBS method would induce artifacts if there are some very saturation bright signals in the raw images. By carefully adjusting the exposure time and the laser power of the light sheet, overexposure is avoided to produce saturated signals in large dynamic range raw images. The background noise would add together after CBS operation, a low-noise sCMOS camera can partially solve this problem.
5 Conclusion
We have proposed a method to generate multiple Airy beams which have fewer side lobes compared to the classical Airy beam. Combined with the complementary beam subtraction strategy, the MAB-CBS method enables extension of the FOV of LSFM by over twelve-fold without sacrificing the axial resolution. The effectiveness of the method was demonstrated by imaging specimens of fluorescent beads and aspergillus conidiophores. The design method of novel non-diffracting beams with fewer side lobes can also bring benefits to other light-sheet-based imaging systems, promoting the development and application of LSFM.
Data availability statement
The original contributions presented in the study are included in the article/supplementary material, further inquiries can be directed to the corresponding authors.
Author contributions
BY conceived and supervised the project. XY and SG designed, performed and coordinated the research, analyzed and performed statistical analyses, interpreted the data and wrote the manuscript; CB, JM, RL, YY, and BY contributed to the acquisition of data and commented on the manuscript. All authors have read and agreed to the published version of the manuscript.
Funding
This work was supported by the National Natural Science Foundation of China (11704405, 61975233, 12127805); Key Research and Development Program of Shaanxi Province (2020SF-193, 2021GY-079, 2020ZDLSF02-06).
Conflict of interest
The authors declare that the research was conducted in the absence of any commercial or financial relationships that could be construed as a potential conflict of interest.
Publisher’s note
All claims expressed in this article are solely those of the authors and do not necessarily represent those of their affiliated organizations, or those of the publisher, the editors and the reviewers. Any product that may be evaluated in this article, or claim that may be made by its manufacturer, is not guaranteed or endorsed by the publisher.
References
1. Keller PJ, Schmidt AD, Wittbrodt J, Stelzer EHK. Reconstruction of zebrafish early embryonic development by scanned light sheet microscopy. Science (2008) 322(5904):1065–9. doi:10.1126/science.1162493
2. Huisken J, Swoger J, Bene FD, Wittbrodt J, Stelzer EHK. Optical sectioning deep inside live embryos by selective plane illumination microscopy. Science (2004) 305(5686):1007–9. doi:10.1126/science.1100035
3. Keller PJ, Schmidt AD, Santella A, Khairy K, Bao ZR, Wittbrodt J, et al. Fast, high-contrast imaging of animal development with scanned light sheet-based structured-illumination microscopy. Nat Methods (2010) 7(8):637–42. doi:10.1038/Nmeth.1476
4. Arrenberg AB, Stainier DYR, Baier H, Huisken J. Optogenetic control of cardiac function. Science (2010) 330(6006):971–4. doi:10.1126/science.1195929
5. Chen BC, Legant WR, Wang K, Shao L, Milkie DE, Davidson MW, et al. Lattice light-sheet microscopy: Imaging molecules to embryos at high spatiotemporal resolution. Science (2014) 346(6208):1257998. Epub 2014/10/25. doi:10.1126/science.1257998
6. Ovecka M, von Wangenheim D, Tomancak P, Samajova O, Komis G, Samaj J. Multiscale imaging of plant development by light-sheet fluorescence microscopy. Nat Plants (2018) 4(9):639–50. doi:10.1038/s41477-018-0238-2
7. Gao RX, Asano SM, Upadhyayula S, Pisarev I, Milkie DE, Liu TL, et al. Cortical column and whole-brain imaging with molecular contrast and nanoscale resolution. Science (2019) 363(6424):eaau8302. doi:10.1126/science.aau8302
8. Fu Q, Martin BL, Matus DQ, Gao L. Imaging multicellular specimens with real-time optimized tiling light-sheet selective plane illumination microscopy. Nat Commun (2016) 7:11088. Epub 2016/03/24. doi:10.1038/ncomms11088
9. Gao L. Extend the field of view of selective plan illumination microscopy by tiling the excitation light sheet. Opt Express (2015) 23(5):6102–11. doi:10.1364/Oe.23.006102
10. Dean KM, Fiolka R. Uniform and scalable light-sheets generated by extended focusing. Opt Express (2014) 22(21):26141–52. doi:10.1364/Oe.22.026141
11. Dean KM, Chakraborty T, Daetwyler S, Lin JL, Garrelts G, M'Saad O, et al. Isotropic imaging across spatial scales with axially swept light-sheet microscopy. Nat Protoc (2022) 17(9):2025–53. doi:10.1038/s41596-022-00706-6
12. Liu C, Bai C, Yu X, Yan S, Zhou Y, Li X, et al. Extended field of view of light-sheet fluorescence microscopy by scanning multiple focus-shifted Gaussian beam arrays. Opt Express (2021) 29(4):6158–68. Epub 2021/03/18. doi:10.1364/OE.418707
13. Huisken J, Stainier DYR. Even fluorescence excitation by multidirectional selective plane illumination microscopy (mspim). Opt Lett (2007) 32(17):2608–10. doi:10.1364/Ol.32.002608
14. Wu JM, Lu Z, Jiang D, Guo YD, Qiao H, Zhang Y, et al. Iterative tomography with digital adaptive optics permits hour-long intravital observation of 3d subcellular dynamics at millisecond scale. Cell (2021) 184(12):3318–32.e17. doi:10.1016/j.cell.2021.04.029
15. Fahrbach FO, Rohrbach A. Propagation stability of self-reconstructing Bessel beams enables contrast-enhanced imaging in thick media. Nat Commun (2012) 3:632. doi:10.1038/ncomms1646
16. Nylk J, McCluskey K, Preciado MA, Mazilu M, Yang ZY, Gunn-Moore FJ, et al. Light-sheet microscopy with attenuation-compensated propagation-invariant beams. Sci Adv (2018) 4(4):eaar4817. doi:10.1126/sciadv.aar4817
17. Chang B-J, Kittisopikul M, Dean KM, Roudot P, Welf ES, Fiolka R. Universal light-sheet generation with field synthesis. Nat Methods (2019) 16(3):235–8. doi:10.1038/s41592-019-0327-9
18. Vettenburg T, Dalgarno HIC, Nylk J, Coll-Llado C, Ferrier DEK, Cizmar T, et al. Light-sheet microscopy using an Airy beam. Nat Methods (2014) 11(5):541–4. doi:10.1038/nmeth.2922
19. Piksarv P, Marti D, Le T, Unterhuber A, Forbes LH, Andrews MR, et al. Integrated single- and two-photon light sheet microscopy using accelerating beams. Scientific Rep (2017) 7:1435. doi:10.1038/s41598-017-01543-4
20. Zhang P, Phipps ME, Goodwin PM, Werner JH. Confocal line scanning of a Bessel beam for fast 3d imaging. Opt Lett (2014) 39(12):3682–5. doi:10.1364/Ol.39.003682
21. Gao L, Shao L, Chen BC, Betzig E. 3d live fluorescence imaging of cellular dynamics using Bessel beam plane illumination microscopy. Nat Protoc (2014) 9(5):1083–101. doi:10.1038/nprot.2014.087
22. Hosny NA, Seyforth JA, Spickermann G, Mitchell TJ, Almada P, Chesters R, et al. Planar Airy beam light-sheet for two-photon microscopy. Biomed Opt Express (2020) 11(7):3927–35. doi:10.1364/boe.395547
23. Liu C, Yu X, Bai C, Li X, Zhou Y, Yan S, et al. Axial resolution enhancement for planar Airy beam light-sheet microscopy via the complementary beam subtraction method. Appl Opt (2021) 60(32):10239–45. Epub 2021/11/23. doi:10.1364/AO.441070
24. Siviloglou GA, Christodoulides DN. Accelerating finite energy Airy beams. Opt Lett (2007) 32(8):979–81. doi:10.1364/Ol.32.000979
25. Siviloglou GA, Broky J, Dogariu A, Christodoulides DN. Observation of accelerating Airy beams. Phys Rev Lett (2007) 99(21):213901–81. doi:10.1103/PhysRevLett.99.213901
26. Jia H, Yu X, Yang Y, Zhou X, Yan S, Liu C, et al. Axial resolution enhancement of light-sheet microscopy by double scanning of Bessel beam and its complementary beam. J Biophotonics (2019) 12(1):e201800094. Epub 2018/07/26. doi:10.1002/jbio.201800094
27. Gan YH, Ma Y, Gong WW, Liu WJ, Wang Z, Hao X, et al. Enhanced axial resolution of lattice light sheet microscopy by fluorescence differential detection. Opt Express (2022) 30(15):27381–94. doi:10.1364/Oe.462516
28. Xiong B, Han X, Wu J, Xie H, Dai Q. Improving axial resolution of Bessel beam light-sheet fluorescence microscopy by photobleaching imprinting. Opt Express (2020) 28(7):9464–76. doi:10.1364/oe.388808
Keywords: light-sheet fluorescence microscopy, volumetric imaging, non-diffracting beam, image contrast, field of view
Citation: Gu S, Yu X, Bai C, Min J, Li R, Yang Y and Yao B (2022) Multiple airy beams light-sheet fluorescence microscopy. Front. Phys. 10:1111023. doi: 10.3389/fphy.2022.1111023
Received: 29 November 2022; Accepted: 15 December 2022;
Published: 23 December 2022.
Edited by:
Hongbao Xin, Jinan University, ChinaCopyright © 2022 Gu, Yu, Bai, Min, Li, Yang and Yao. This is an open-access article distributed under the terms of the Creative Commons Attribution License (CC BY). The use, distribution or reproduction in other forums is permitted, provided the original author(s) and the copyright owner(s) are credited and that the original publication in this journal is cited, in accordance with accepted academic practice. No use, distribution or reproduction is permitted which does not comply with these terms.
*Correspondence: Xianghua Yu, eXhoQG9wdC5jbg==; Baoli Yao, eWFvYmxAb3B0LmFjLmNu