 Yaping He1
 Yingying Su
95% of researchers rate our articles as excellent or good
Learn more about the work of our research integrity team to safeguard the quality of each article we publish.
Find out more
ORIGINAL RESEARCH article
Front. Phys. , 05 January 2023
Sec. Radiation Detectors and Imaging
Volume 10 - 2022 | https://doi.org/10.3389/fphy.2022.1101923
This article is part of the Research Topic Multi-Sensor Imaging and Fusion: Methods, Evaluations, and Applications View all 18 articles
For deep learning-based object detection, we present a superior network named MSS-YOLOv5, which not only considers the reliability in complex scenes but also promotes its timeliness to better adapt to practical scenarios. First of all, multi-scale information is integrated into different feature dimensions to improve the distinction and robustness of features. The design of the detectors increases the variety of detection boxes to accommodate a wider range of detected objects. Secondly, the pooling method is upgraded to obtain more detailed information. At last, we add the Angle cost and assign new weights to different loss functions to accelerate the convergence and improve the accuracy of network detection. In our network, we explore four variants MSS-YOLOv5s, MSS-YOLOv5m, MSS-YOLOv5x, and MSS-YOLOv5l. Experimental results of MSS-Yolov5s show that our technique improves mAP on the PASCAL VOC2007 and PASCAL 2012 datasets by 2.4% and 2.9%, respectively. Meanwhile, it maintains a fast inference speed. At the same time, the other three models have different degrees of performance improvement in terms of balancing speed and precision in challenging detection regions.
With the rapid development of science and technology, object detection technology has become a hot research problem [1]. Object detection has been useful in enhancing production and life efficiency in a variety of industries, including intelligent transportation, steel defect identification, face detection, and others. In terms of smart transportation, A great many traffic accidents happened in the world because of fatigued driving and drunk driving. Globally more than 1.25 million people died in traffic accidents and economic losses amount to billions of dollars every year. Due to the increasing number of vehicles and the irregular operation of drivers, the accident rate is further increasing, which brings many adverse effects to our production life. The computer-aided driving system monitors and senses the surrounding environment through deep learning algorithms, and transmits information about obstacles in front of the vehicle to the driver or driverless system to facilitate the next effective operation, which is of great importance to reducing the incidence of traffic accidents. For steel defect detection, numerous steel varieties and complex application scenarios make it difficult to detect steel defects, which raises the cost of manual screening. The currently used object detection approach may efficiently find flaws, considerably increase production efficiency, and quicken the transition to an intelligent, modern industry.
Deep learning, as an extension of traditional machine learning, has developed rapidly in recent years in the context of big data. The essence of deep learning is the learning process that enables machines to reach or even surpass human levels. Its unique advantage is that excellent features can be extracted using convolutional networks. Currently, it is widely used in machine vision, pattern recognition, and other fields. A large number of improved algorithms have achieved significant success in terms of accuracy and speed, such as SPPnet, Fast R-CNN, Faster R-CNN, single-shot detector (SSD) [2], You Only Look Once (YOLO), YOLOv2, YOLOv3, YOLOv4, YOLOv5, and other object detection networks. However, it is extremely difficult to achieve a mutual trade-off between speed and precision. So in this work, inspired by YOLO and SSD, we propose an improved mobile-friendly and high-accuracy object detection algorithm. To summarize, our main contributions are as follows:
• We propose an improved YOLOv5 algorithm named MSS-YOLOv5 to improve accuracy while keeping the speed largely unchanged based on YOLOv5 [3–5]. We design an upsampling and downsampling to the network to facilitate deeper information fusion and compensate for missing information. Our design of four YOLO detectors will facilitate the detection of obstacles of different sizes.
• A new pooling method is adopted in the SPP module to improve network performance in this paper. Our pool approach helps reduce information loss compared to maximum pooling and average pooling. This lossless boost will not come at any additional cost to the network. It is friendly to server devices and embedded deployments.
• Inspired by the structure of the SIoU loss function, we add the Angle cost to our loss function. Meanwhile, based on the idea of Focal loss [6], we added the new weight coefficient to the cross-entropy loss function as a way to describe the importance of edge loss to the overall loss function.
• Our improved approach not only performs well on small models but also on large models as well. Referring to the model design of YOLOv5, we present four versions of the model in this paper, MSS-YOLOv5s, MSS-YOLOv5m, MSS-YOLOv5l, and MSS-YOLOv5x.
The rest of this paper is organized as follows. Section 2 introduces the related works. The methods are presented in Section 3. The experiments and results are discussed in Section 4. The conclusions are drawn in Section 5.
With the rise of a deep network, the accuracy of object detection has been greatly improved. The commonly used object detection algorithms are divided into two categories. Two of the most commonly used are two-tier target-detection algorithms that contain regional recommendation networks, such as R-CNN [7], Faster-RCNN [8], Mask-RCNN [9], SPP Net [10], etc. Despite having high accuracy in most detection tasks, these network models have a large number of parameters. They are difficult to deploy on embedded devices and do not have a high recognition accuracy for small targets. The other category is the single-stage YOLO [11–13] (You Only Look Once) family of algorithms. In contrast to the two-stage algorithm, it has a fast inference speed. Because of its ease of deployment, YOLO has a wide range of applications in many areas such as unmanned vehicles and the military.
YOLOv5 is the fifth generation version of YOLO which shows excellent performance in different detect tasks. There are four types of YOLOv5, which are YOLOv5s, YOLOv5m, YOLOv5l, and YOLOv5x, while the basic structure of YOLOv5s is shown in Figure 1. Due to the rapid development of deep learning, a large number of excellent works to improve YOLOv5 have emerged. Cheng et al [14] proposed adding attention mechanisms to YOLOv5 to enable the network to learn the information we need adaptively. Xing [15] et al. used YOLOv5 algorithm and DeepSORT algorithm to detect and track multiple moving targets. Lan et al [16]. proposed an improved deep learning network model YOLOv5-DN based on YOLOv5. The CSP-DarkNet module in YOLOv5 was replaced by CSP-DenseNet to promote the accuracy of target detection and classification in the model. Howard et al [17] proposed to combine LRM and Focal loss in YOLOv5 to improve the average accuracy. Zhao et al [18] used the ghost module to reduce the parameters and thus further improve the detection speed. A series of valuable works have contributed to the development of YOLO algorithm.
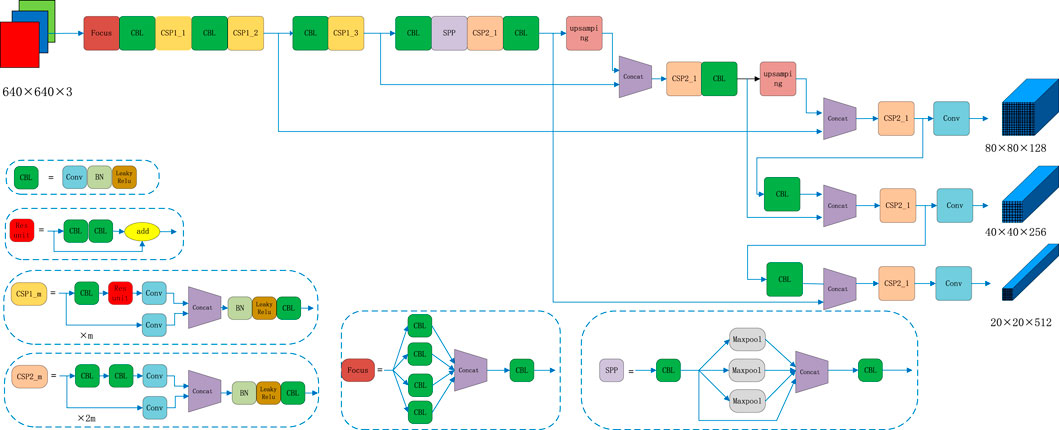
FIGURE 1. The network structure of YOLOv5s. The input size of image is 640 × 640. The final output is three effective feature layers, and their output size is 128, 256, 512. The structure inside the algorithm can be used for the extraction of feature information.
YOLOv5s was one of the first networks to use SPP in a single-stage algorithm. Although the backbone network can extract some of the features after all the network depth was limited to extract depth information of the network. The SPP module contains convolutional kernels of sizes 1, 5, 9, and 13, which are used to obtain feature information under different perceptual fields by maximum pooling. Although the ASPP [17] and RFB [19] modules have appeared in previous studies, these modules expand the receptive field by dilated convolution and do not address the information loss problem caused by maximum pooling or average pooling.
There are many factors that affect YOLOv5s performance, such as loss function, backbone networks, pool method, etc. A great many works were emerged to improve the loss function. Li et al. proposed GIOU [20] to solve the problem of disappearing gradients. However, there are some problems such as slow convergence. Zheng et al. On this basis, the DIoU [21] was proposed, and the distance between the mass of the prediction frame and the real frame is considered in the function definition. Cai et al. found that there is a risk of degradation when the centroids of two boxes overlap. The aspect ratio of the boxes was therefore introduced to form the CIoU [22]. Although CIoU considers the overlap area, centroid distance, and aspect ratio, the true difference between aspect and confidence is not well reflected by v in the formula, making it more difficult to optimize. Min et al. then reconsidered the aspect factors and proposed EIoU [23] on top of this. The above work is useful for portraying the difference between the prediction frame and the true frame. There is still room for improvement in the loss function.
The pooling method affects the detection performance of the model to some extent. Kumar et al [24] used a deep network model using ResNet-50 and global average pooling to solve the vanishing gradient and overfitting problems. Tan et al [25] proposed to incorporate maximum pooling into an improved SPP network to enhance the network’s ability to represent information. Zhang et al [26] proposed to replace max pooling and average pooling with random pooling to obtain deep learning models with better performance. However, the problem of maximum pooling and average pooling leading to significant information loss has not been resolved.
In summary, the ability of YOLOv5 to extract detailed information is limited, and the balance between speed and accuracy has been a difficult problem to be tackled. YOLOv5 has significant room for improvement, both in terms of the loss function and pooling methods or feature fusion. Therefore, we will also focus on these three improvement points in this paper.
In this section, we present some of our design ideas about MSS-YOLOv5, which help us trade off between speed and precision. First, we design four branches to integrate different scale features. Then, we replace Maxpool with an improved SoftPool in the SPP module. Finally, inspired by the structure of the SIoU loss function, we add the Angle cost and other strategies to improve the performance further.
Combining these approaches, we named the improved YOLOv5 algorithm MSS-YOLOv5. MSS takes the initials multi-scale fusion, Softpool, and SIoU respectively. Similar to YOLOv5, we provide four versions, with the number of model parameters ranging from small to large as MSS-YOLOv5s, MSS-YOLOv5m, MSS-YOLOv5l, and MSS-YOLOv5x. The overall flow of the model is shown in Figure 2. After the data is enhanced, the input pictures are sent into the model for training. BCE loss is used to calculate the classification loss and target loss. NMS (non-maximum suppression) is used to filter out the boxes with low scores due to occlusion and other factors. Firstly, the IoU threshold is set to 0.5. Secondly, all the boxes are sorted, and each box with IoU >0.5 is set to 0 if it has the highest probability of scoring, and the opposite is kept. The final output is the location and labels information of the target.
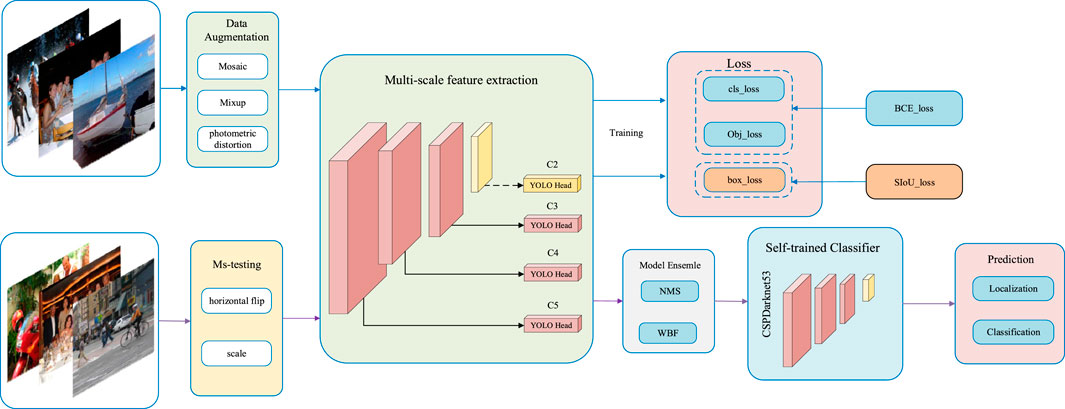
FIGURE 2. The process of training and testing the model. Data augmentation is used to acquire high-quality pictures. SIoU loss can help us reduce the loss of border to train the model more effectively. The model ensemble contains different methods, which can remove those detection boxes with a low score. The prediction section consists of two parts: location and classification.
There are many large differences in the size and shape of targets in detection tasks. To address this problem, both Scaled-YOLOv4 [27] and TPH-YOLOv5 [28] use a multi-scale feature fusion strategy [29, 30] to extract more useful information. Both decrease the difficulty of detecting target objects of different sizes by increasing the number of detectors. Inspired by these two algorithms, we add a branch to integrate different channel information in the network. And we can use the Concat operation to integrate these information. A large detector has extensive coverage and abundant information on feature points, so it is easier to obtain global information. On the contrary, the small-scale detector has opposite characteristics. The loss of feature information is more obvious after the backbone network. Generally, only single-digit pixel sizes are left, resulting in small targets that do not match the original image after mapping through the perceptual field, which ultimately leads to poor regression and prediction results. Backbone, SPP, and PANet in YOLOv5s have extracted some feature information about the target to a certain extent. However, there is still some room for mining deep semantic information and shallow detailed information.
According to the above problems, we proposed the following improved measures. 1) As shown in Figure 3, we add one more upsampling and downsampling in the PANet of YOLOv5s (PANet originally had two upsamples and two downsamples). The sampling structure consists of Convolution, Batch Normalization [31], and Leaky Relu [32]. Convolution is used for feature extraction. Batch Normalization can prevent gradients from exploding or disappearing, speed up network convergence and improve the stability of the detection network. Leaky Relu can enhance the ability of non-linear representation of the network. 2) We add an extra YOLO Head as a detector to accommodate different scales of target detection. The multi-scale fusion strategies used in this paper are all methods of fusion at four different scales.
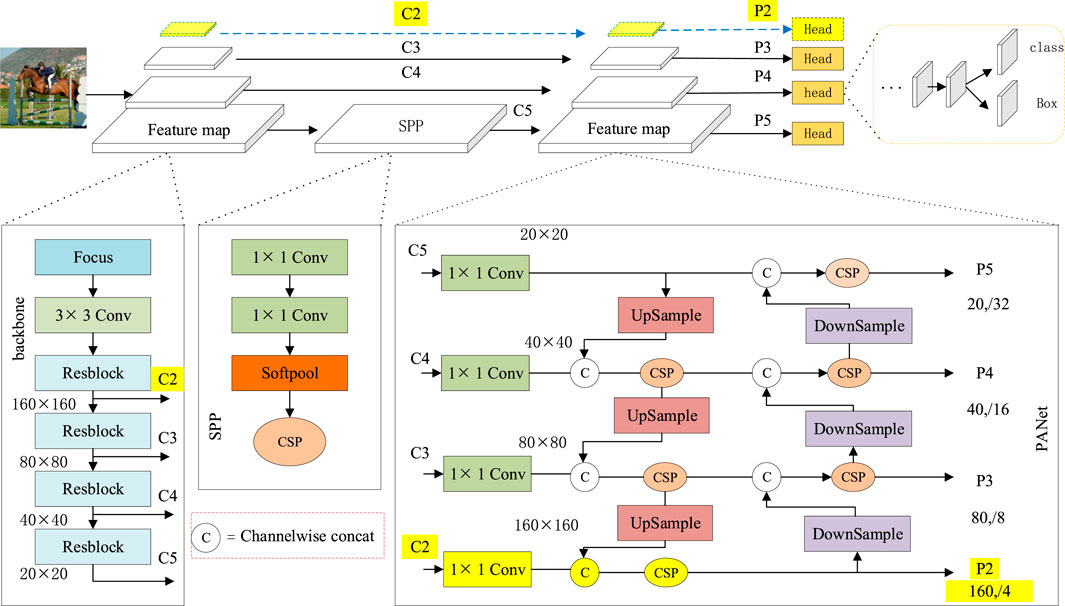
FIGURE 3. Multi-scale feature integration architecture. The Backbone is CSPDarknet53, which outputs C2–C5 feature maps to the neck. The neck is a new PANet, which inputs four feature maps and outputs four feature maps. For YOLOv5-MSSs, the input channel numbers are [20, 40, 80], and the output channel numbers are [20, 40, 80, 160].
The main function of pooling is to reduce the dimensionality of the feature map, reducing the computational overhead and thus saving memory, offering the possibility of studying deeper networks. The prevailing pooling methods are maximum pooling and average pooling or a combination of both, but extensive experiments have shown that these types of pooling result in the loss of important feature information. Therefore, literature 32 proposes the SoftPool [33] method, where each activation is assigned a corresponding weight through a softmax operation. The weights can be expressed as follows.
The output of soft pooling (
Soft pooling performs a normalization operation using the softmax of a region. Its probability distribution is proportional to each activation value relative to the neighboring activation values in the kernel region. Therefore, SoftPool is microscopic. It can provide a certain gradient at each backpropagation. However, there are still problems such as limited lifting accuracy and the return value of the gradient is too small to be optimized. Therefore, a new SPP structure is proposed in this paper. As shown in Figure 3, the MaxPool in the SPP is replaced with SoftPool, while the pooling kernel size is adjusted from [5, 9, 13] to [3, 5, 7] to retain rich enough depth information and enhance feature representation. Of course, it is possible to keep the convolution kernel size the same or resize it to [5, 7, 9]. However, kernel sizes of [3, 5, 7] are significantly less computationally intensive. At the same time, when the fitting ability of the network is saturated, it will be beneficial to reduce more redundant information.
Object detection is one of the core problems in the field of vision and its detection accuracy depends on the definition of the loss function. In previous studies, the loss function has mostly been defined using the distance, intersection ratio, and aspect ratio between the prediction box and the true box. We have not taken into account the direction in which the predicted boxes do not match the real boxes. The loss function has disadvantages such as slow convergence, difficulty in optimization, and low detection accuracy. Therefore, we adopt a new loss function SIoU in this paper. SIoU was pioneered by Zhora Gevorgyan [34] in 2022 and consists of four main Cost functions, Angle cost, Distance cost, Shape cost, and IoU cost. The latter three elements have been studied enough in previous work to have a positive impact. However, it does not mean that there is no room for improvement in the loss function. So Angle cost is added. This addition ensures that the prediction is effective. This improved method allows the prediction box to be moved quickly to the nearest axis. Finally, only the X or Y coordinates are needed for the regression operation. Overall, the Angle cost penalty makes the degrees of freedom of loss much lower, making it easier to converge. The following sections show the computation of the four Cost functions.
The picture of regression loss of borders was shown in Figure 5. It reflects the relationship between the position of the predicted box and the real box. We calculate the relevant parameters in Figure 4.
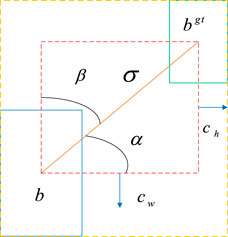
FIGURE 4. The relationship between the position of the prediction box and the real box.
In order to make the function converge quickly, we will first try to minimize
To achieve this first, an angle-aware component is introduced and defined as follows:
Where
The distance is defined in the following way:
The contribution of Distance cost is small when the angle is small but becomes larger as the angle gradually converges to
The shape is defined in the following way:
where
IoU [35] reacts to the ratio of intersection to concatenation when the prediction box intersects the real box. A Schematic of the relation of IoU component contribution was shown in Figure 5. The formula is as follows.
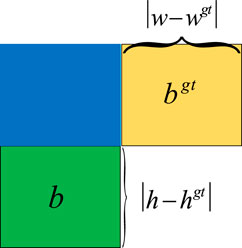
FIGURE 5. Schematic of relation of IoU component contribution.
The regression loss of the border is represented below.
The final loss function used in this paper is as follows.
In all the above formulas,
The K-means [36] clustering method was chosen to predict more accurate anchor frames in this paper. Different types of objects have different sized frames, and the same object may vary depending on how close or far it is photographed. Each detector uses three anchor frames to determine the position of the object. There are three detectors in YOLOv5s, so nine clustering centers are needed. Based on the experiments conducted, the final clusters were: [(19,48), (40,40), (35,97), (81,80), (64,176), (138,145), (117,286), (253,234), (193,428), (485,310), (330,488), (561,546)]. The distribution of clustering centers is shown in Figure 6.
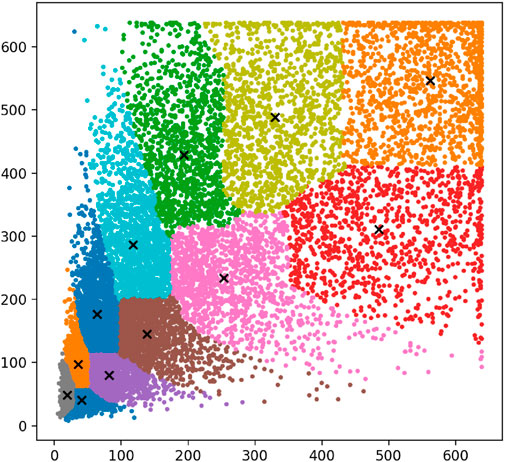
FIGURE 6. Map of clustering centers.
Data augmentation is a common way of expanding data. It can enhance the detection capability of a neural network with a limited amount of data. In this paper, we have the requirement to enhance the generalization capability of the model. Therefore, we adopted the mosaic data augmentation method to stimulate the maximum performance of the algorithm. In previous enhancement methods, horizontal inversion and illumination were often used to enhance the data, but there were many drawbacks such as poor generalization and hindering accuracy improvement. Therefore, we follow the mosaic data enhancement method [37] of YOLOv4 and YOLOX [38] in this paper. Numerous experiments have shown that this enhancement method has an effort on increasing the detection accuracy and enhancing the generalization ability of the model to a certain extent. The results of the mosaic data enhancement are shown in Figure 7.
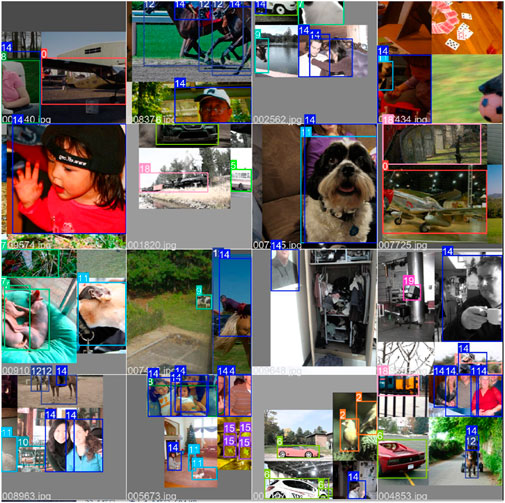
FIGURE 7. The results of the mosaic data enhancement.
The hardware setup in the laboratory configured for this study is as follows: the experimental platform is Windows 10, the processor is Intel Core i7-11700F 2.50 GHZ, equipped with NVIDIA GeForce RTX3060-32GB, the development environment is Pycharm2020, Python3.6, the deep learning framework is Pytorch1.7, using CUDA11.2.0/CUDNN11.2 for image acceleration.
The public PASCAL VOC datasets used in the training process are as follows:
1) PASCAL VOC 2007: a real-world dataset with still different views from our life. It contains 20 categories with a total of 4952 pictures. Moreover, the training and test sets were divided according to 9:1, with 4457 training sets and 495 test sets.
2) PASCAL VOC 2012: a real-world dataset with still different views from our life. It contains 20 categories with a total of 17125 pictures. Moreover, the training and test sets were divided according to 9:1, with 15412 training sets and 1713 test sets.
The dataset of PASCAL VOC 2007 and PASCAL VOC 2012 were used to validate the effort of the improved method. At the same time, We compared common lightweight networks for comparative experiments. FPS and mAP were combined to compare the superiority of the algorithms.
Precision, recall, AP, and mAP are used to evaluate the merits of the model. The formulae are shown below.
TP represents the total number of correctly classified positive samples, FP represents the total number of misclassified positive samples and FN represents the total number of misclassified negative samples. The precision rate indicates the number of positive category samples as a proportion of the total number of samples. The recall indicates the proportion of all positive samples detected to the number of positive samples in the dataset. The mAP can be used as a comprehensive evaluation metric for single category detection, with higher AP values indicating better detection of a category, and mAP being a comprehensive evaluation of the entire network. The complexity of a model is measured by the number of parameters or computations. In general, the lower the number of parameters in a model, the faster the detection speed, which is usually evaluated in terms of FPS.
The following settings are made when the model is trained. To obtain better training results, this experiment uses the pre-training weights of the CSPDarknet53 backbone, and the model is optimally trained using SGD (stochastic gradient descent). The input image size of the model is 608 × 608, the maximum learning rate is 1e−2, the freeze part batch size is 16, freeze training for 50 cycles, unfreeze part batch size is 50 cycles of freeze training. The IoU threshold and momentum are set to 0.5 and 0.937, respectively. Other versions of MSS-YOLOv5 use the same training method.
The model was trained using the above parameter settings and a combination of improvements. The final loss function curve is shown in Figure 8. From the figure, we can see that the loss function curve has an overall decreasing trend. Meanwhile, the loss curve has almost approached convergence at the 20th epoch. The experiments demonstrate that our method is not only easy to converge but also highly stable.
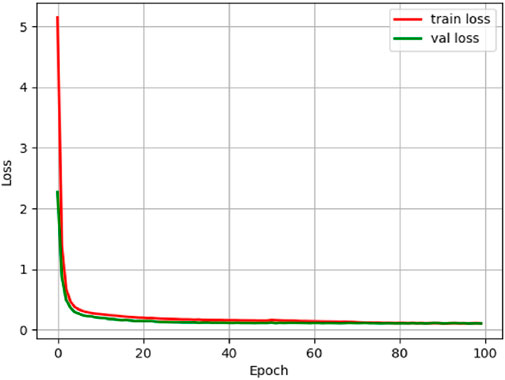
FIGURE 8. Loss function curve of MSS-YOLOv5s.
To verify the effectiveness of the algorithm, we conducted ablation experiments on the improved modules, in order of four scales, maximum pooling replacement to Softpool, and GIoU replacement to SIoU, to verify the detection effectiveness of the improved algorithm. Through experiments, we found that the improved method has significant performance gains on small models, but not much for large models. Therefore, we demonstrate ablation experiments with MSS-YOLOv5s as an example in this paper. The results of the ablation experiments of MSS-YOLOv5s are shown in Table 1.
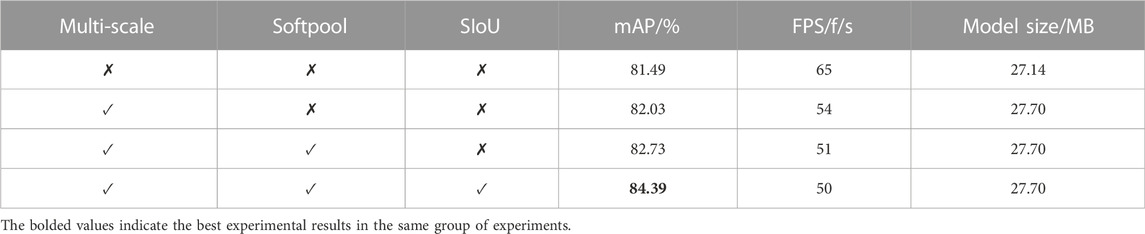
TABLE 1. Ablation experiment of MSS-YOLOv5s.
As we can see that quadruple scale feature fusion, Softpool, and SIoU loss function, provide a significant improvement in detection accuracy from Table 2. The multi-scale fusion sacrifices some of the speed, but after all, it is minimal and gives a solution for accuracy improvement. With the introduction of softpool and SIoU, the model size remains almost unchanged and the speed is essentially the same, with an average precision improvement of 2.9%.
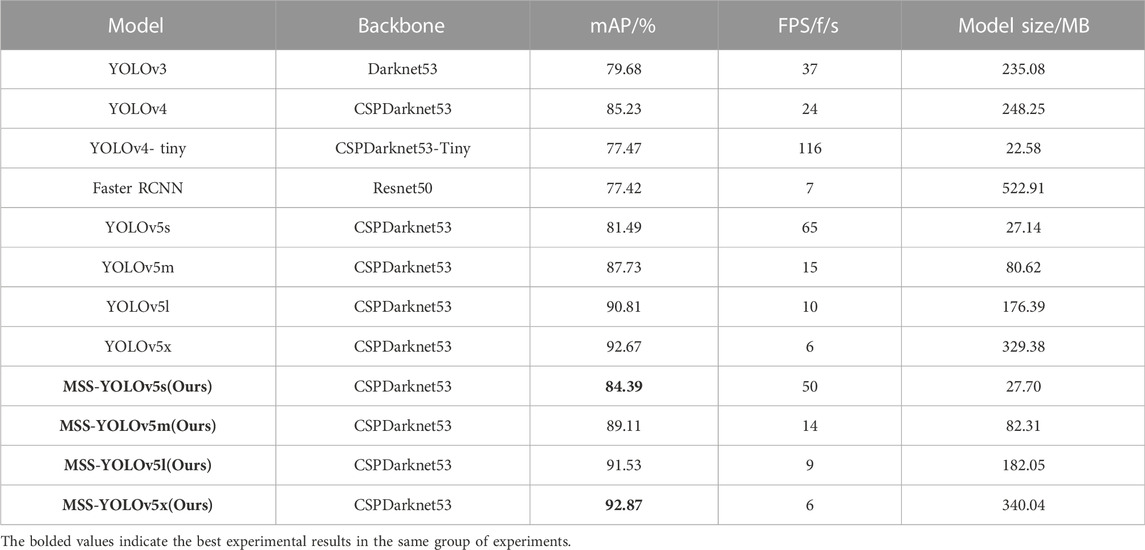
TABLE 2. Comparison of different algorithms.
To reflect the effectiveness of the algorithm improvements, we experimentally compared the target detection algorithms YOLOv4, YOLOv4-tiny, YOLOv3, YOLOv3-tiny, and YOLOv5. The experimental results are shown in Table 2.
From Table 3, we can see that although the two-stage Faster RCNN uses a region suggestion network, it does not achieve higher accuracy. On the contrary, YOLOv4 works better but poses some difficulties for model deployment due to its slower speed. YOLOv4-tiny, YOLOv3-tiny, and YOLO5s, as commonly used lightweight algorithms, have certain advantages, but the detection accuracy is too low to meet the needs of autonomous driving corresponding to complex scenarios. In the improved model, MSS-YOLOv5s, MSS-YOLOv5m, MSS-YOLOv5l, and MSS-YOLOv5x have different degrees of enhancement. The speed of MSS-YOLOv5s is essentially the same as YOLOv5s, but there is a significant improvement in mAP. This is despite a 0.2% improvement in the large model MSS-YOLOv5x, which tends to be saturated. This non-destructive improvement of MSS-YOLOv5 is extremely model friendly, achieving a degree of balance between speed and accuracy and providing more options for embedded deployments.
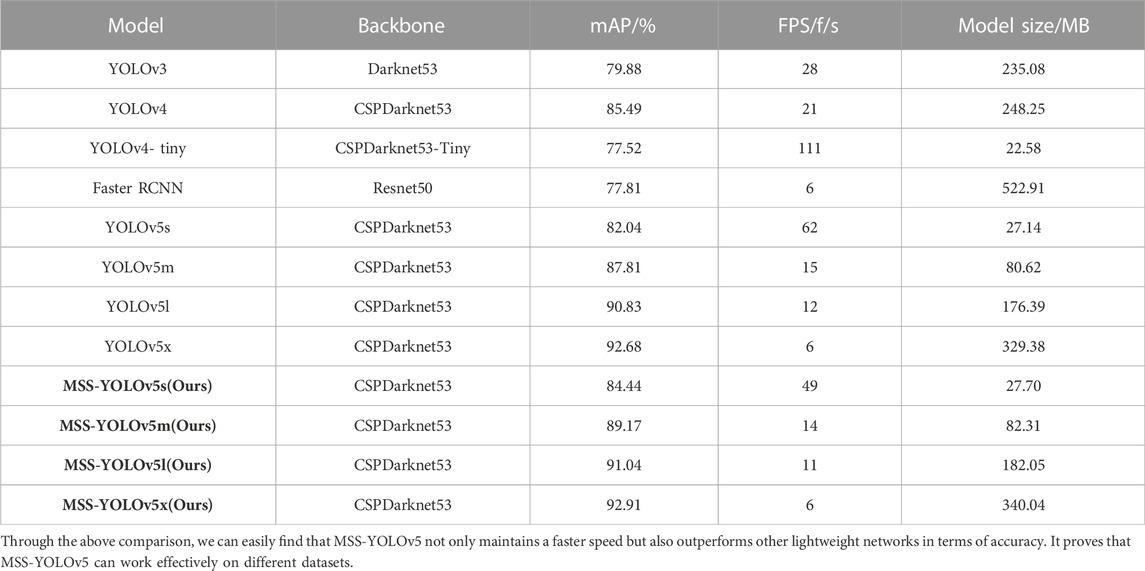
TABLE 3. Performance of different algorithms on the PASCAL 2012 dataset.
From Figure 9, we can see that the detection accuracy of all types of targets has been improved to different degrees, especially for small targets. When using YOLOv5s, the detection effect of the dining table, sofa and boat are not obvious, but on our improved algorithm, the improvement is 0.09%, 0.15%, and 0.05% respectively, which shows that our improved strategy is simple and effective.
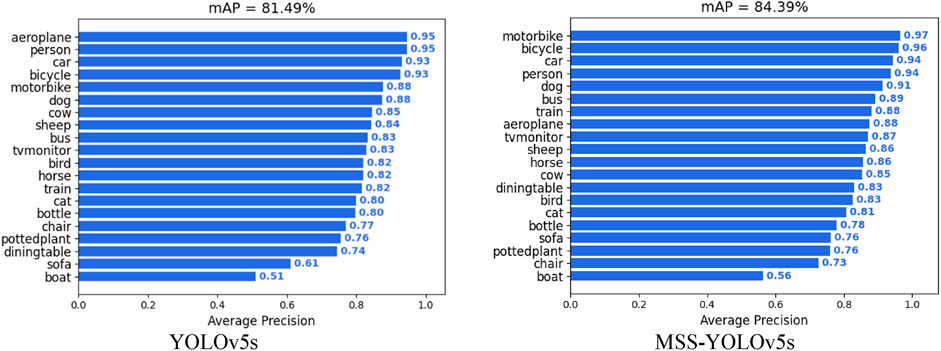
FIGURE 9. Comparison of the mAP of YOLOv5s and MSS-YOLOv5s.
To give a more intuitive picture of the detection effect of the improved algorithm on the PASCAL VOC2007 dataset, Figure 10 shows the detection of the different algorithms, the right panel shows the detection effect of the original YOLOv5s and YOLOv5x model and the left panel shows the detection effect of the MSS-YOLOv5x and MSS-YOLOv5s. From the figure, we can see that the MSS-YOLOv5x detected significantly more targets than the YOLOv5x algorithm, and for the targets that were both detected, the confidence level of the MSS-YOLOv5x was higher. The same result is found on the MSS-YOLOv5s and YOLOv5s. This shows that our improved approach improves the performance of the model both on large and small models. The MSS-YOLOv5 not only enriched the deep semantic information of the feature map but also enhanced the acquisition of shallow detail information to a certain extent, improving the detection capability of the network for targets of different sizes.
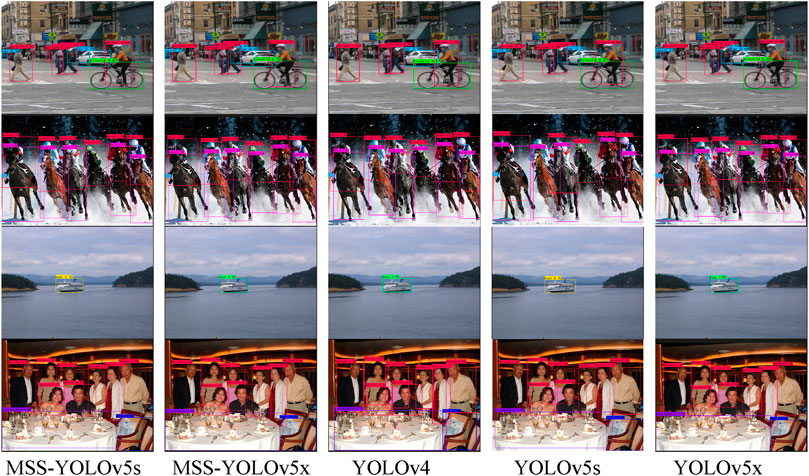
FIGURE 10. Comparison of test results for different algorithms.
To further validate the effectiveness of the improved method, we used the PASCAL VOC 2012 dataset to prove the superior performance of the new framework. The same training approach was used to retrain the PASCAL VOC 2012 dataset. Figure 11 is a heat map presentation of the different algorithms on the PASCAL VOC 2012 dataset.
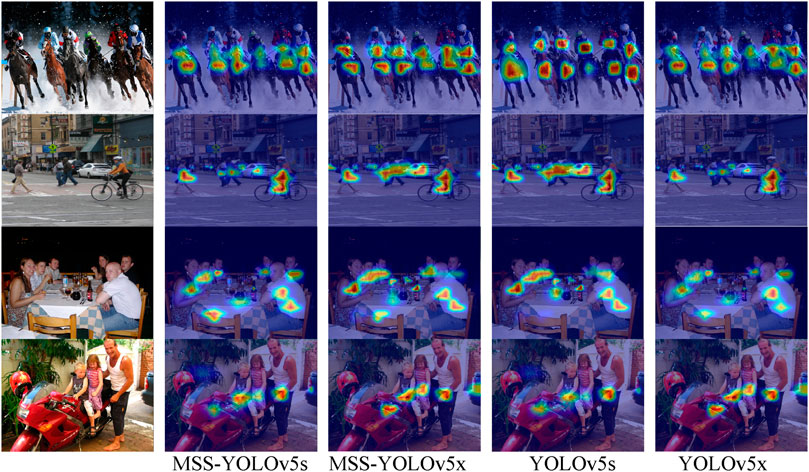
FIGURE 11. Comparison of different algorithms for heat maps.
The heat map represents the area of interest of the network to the detection target, and the more thermal points, the more targets are detected. Experiments have shown that our algorithm is still able to obtain better detection results.
The performance of the different algorithms on PASCAL 2012 is shown in Table 3.
In this work, we propose an improved YOLOv5 object detection algorithm named MSS-YOLOv5 to solve the problem of a trade-off between the speed and precision of YOLOv5 in object detection. Multi-scale information is integrated into different feature dimensions to improve the distinction and robustness of features. The design of the detectors increases the variety of detection boxes to accommodate a wider range of detected objects. The pooling method is upgraded to obtain more detailed information. We add the Angle cost and assign new weights to different loss functions to accelerate the convergence and improve the accuracy of network detection. Experiments have shown that the improved model has essentially similar inference speeds to the original model. However, the improvements we propose are effective in improving accuracy on both large and small models and perform well on different data sets. SIoU loss and feature fusion approaches can be considered to optimize other network structures. We propose a new model with reliable accuracy and high timeliness.
The presented network not only achieves great performance on the PASCAL 2007 but also works efficiently on the PASCAL 2012 dataset. However, our proposed more efficient deep learning-based YOLO series algorithm still cannot work perfectly to heavily obscured targets. In the future, we will introduce structural reparameterization techniques in backbone and FPN to improve the overall performance of your network and add swin transformerv2 to backbone to enhance the network’s ability to capture information over long distances.
Publicly available datasets were analyzed in this study. This data can be found here: https://pjreddie.com/projects/pascal-voc-dataset-mirror/.
Conceptualization, YH and YS; methodology, YH and YL; software, YH; validation, YH, YS, and JY; formal analysis, XW; writing—original draft preparation, YH; writing—review and editing, YS; supervision, XW and YL. All authors have read and agreed to the published version of the manuscript.
This work is sponsored by the Natural Science Foundation of Chongqing (Grant No. cstc2019jcyj-msxmX0220, No. CSTB2022NSCQ-MSX1425, CSTB2022NSCQ-MSX0398), Science and Technology Foundation of the Education Department of Chongqing (Grant No. KJQN202101510), China.
The authors declare that the research was conducted in the absence of any commercial or financial relationships that could be construed as a potential conflict of interest.
All claims expressed in this article are solely those of the authors and do not necessarily represent those of their affiliated organizations, or those of the publisher, the editors and the reviewers. Any product that may be evaluated in this article, or claim that may be made by its manufacturer, is not guaranteed or endorsed by the publisher.
1. Zhang T, Tang M, Li H, Li J, Zou Y, Pan Y, et al. A multidirectional pendulum kinetic energy harvester based on homopolar repulsion for low-power sensors in new energy driverless buses. Int J Precision Eng Manufacturing-Green Technol (2022) 9(2):603–18. doi:10.1007/s40684-021-00344-5
2. Zheng W, Tang W, Jiang L. SE-SSD: Self-ensembling single-stage object detector from point cloud. In: Proceedings of the IEEE/CVF Conference on Computer Vision and Pattern Recognition, Nashville, TN, June 20–25, 2021 (2021). p. 14494.
3. Hu GX, Hu BL, Yang Z, Huang L, Li P. Pavement crack detection method based on deep learning models. Wirel Commun Mob Comput (2021) 2021(1):1–13. doi:10.1155/2021/5573590
4. Wu TH, Wang TW, Liu YQ. Real-time vehicle and distance detection based on improved yolo v5 network[C]. In: 2021 3rd World Symposium on Artificial Intelligence (WSAI), Guangzhou, China, June 18–20, 2021. IEEE (2021) 24.
5. Ting L, Baijun Z, Yongsheng Z. Ship detection algorithm based on improved YOLO V5. In: 2021 6th International Conference on Automation, Control and Robotics Engineering (CACRE), Guangzhou, China, July 15–17, 2021 (2021). p. 483.
6. Li X, Wang W, Hu X. Generalized focal loss v2: Learning reliable localization quality estimation for dense object detection. In: Proceedings of the IEEE/CVF Conference on Computer Vision and Pattern Recognition (2021). p. 11632–41.
7. Girshick R. Fast R-CNN[C]. In: IEEE International Conference on Computer Vision (ICCV), December 7–13, 2015, Santiago, Chile (2015). p. 1440–8.
8. Ren S, He K, Girshick R, Sun J. Faster R-CNN: Towards real-time object detection with region proposal networks. IEEE Trans Pattern Anal Machine Intelligence (2017) 39(6):1137–49. doi:10.1109/tpami.2016.2577031
9. He K, Gkioxari G, Dollár P, Girshick R. Mask RCNN[C]. In: IEEE International Conference on Co-mputer Vision (ICCV), October 22–29, 2017, Venice, Italy (2017). p. 2980.
10. He K, Zhang X, Ren S, Sun J. Spatial pyramid pooling in deep convolutional networks for visual recognition. IEEE Trans pattern Anal machine intelligence (2015) 37(9):1904–16. doi:10.1109/tpami.2015.2389824
11. Wang X, Wang S, Cao J, Wang Y. Data-driven based tiny-YOLOv3 method for front vehicle detection inducing SPP-Net. IEEE Access (2020) 8(99):110227–36. doi:10.1109/access.2020.3001279
12. Redmon J, Farhadi A. YOLO9000:Better, faster, stronger[C]. In: IEEE conference on Computer Vision and Pattern Recognition, Honolulu, HI, July 21–26 2017 (2017). p. 6517.
13. Redmon J, Farhadi A. Yolov3: An incremental improvement[C]. In: IEEE conference on Computer Vision and Pattern Recognition, Salt Lake City, UT, June 18–23, 2018 (2018). arXiv: 1804.0276.
14. Cheng L, Li J, Duan P, Wang M. A small attentional YOLO model for landslide detection from satellite remote sensing images. Landslides (2021) 18(8):2751–65. doi:10.1007/s10346-021-01694-6
15. Xing C, Sun B, Zhang W. Image-enhanced YOLOv5 and deep sort underwater multi-moving target tracking method[C]. In: 2022 5th international symposium on autonomous systems (ISAS), Hangzhou, China, April 08–10, 2022. IEEE (2022) 1–6.
16. Lan Y, Xu W. Insulator defect detection algorithm based on a lightweight network. J Phys Conf Ser (2022) 2181(1):012007. doi:10.1088/1742-6596/2181/1/012007
17. Howard A, Sandler M, Chen B. Searching for MobileNetV3. In: 2019 IEEE/CVF International Conference on Computer Vision (ICCV), Seoul, Korea (South), October 27–November 2, 2019. IEEE (2020).
18. Zhao T, Wei X, Yang X. Improved YOLO v5 for railway PCCS tiny defect detection[C]//2022 14th international conference on advanced computational intelligence (ICACI). IEEE (2022) 85–90.
19. Zhang W, Wang J, Guo X, Chen K. Two-stream RGB-D human detection algorithm based on RFB network. IEEE Access (2020) 8(99):123175–81. doi:10.1109/access.2020.3007611
20. XiaoFan L, HaiBo P, Yi W, JiangChuan L. “Introduce GIoU into RFB net to optimize object detection bounding box[C],” in Proceedings of the 5th International Conference on Communication and Information Processing, Chongqing, China, November 15–17, 2019 (2019), 108–113.
21. Zheng Z, Wang P, Liu W, Li J, Ye R, Ren D. Distance-IoU loss: Faster and better learning for bounding box regression. Proc AAAI Conf Artif Intelligence (2020) 34(07):12993–3000. doi:10.1609/aaai.v34i07.6999
22. Cai Z, VasconcelosCascade NR-CNN. Cascade R-CNN: High quality object detection and instance segmentation. IEEE Trans pattern Anal machine intelligence (2019) 43(5):1483–98. doi:10.1109/tpami.2019.2956516
23. Min Y, Guo J, Yang K. Research on real-time detection algorithm of rail-surface defects based on improved YOLOX[J]. J Appl Sci Eng (2022) 26(6):801. doi:10.6180/jase.202306_26(6).0006
24. Kumar RL, Kakarla J, Isunuri BV, Singh M. Multi-class brain tumor classification using residual network and global average pooling. Multimedia Tools Appl (2021) 80(9):13429–38. doi:10.1007/s11042-020-10335-4
25. Tan YS, Lim KM, Tee C, Lee CP, Low CY. Convolutional neural network with spatial pyramid pooling for hand gesture recognition[J]. Neural Comput Appl (2021) 33(10):5339–51. doi:10.1007/s00521-020-05337-0
26. Zhang YD, Satapathy SC, Liu S, Li GR. A five-layer deep convolutional neural network with stochastic pooling for chest CT-based COVID-19 diagnosis. Machine Vis Appl (2021) 32(1):14–3. doi:10.1007/s00138-020-01128-8
27. Wang CY, Bochkovskiy A, Liao HYM. Scaled-yolov4: Scaling cross stage partial network[C]. In: Proceedings of the IEEE/cvf conference on computer vision and pattern recognition, Nashville, TN, June 20–25, 2021 (2021). p. 13029.
28. Zhu X, Lyu S, Wang X. “TPH-YOLOv5: Improved YOLOv5 based on transformer prediction head for object detection on drone-captured scenarios[C],” in Proceedings of the IEEE/CVF International Conference on Computer Vision, Montreal, QC, October 10–17, 2021 (2021). 2778–88.
29. Li Y, Wang X, Zhu Z. A novel person re-id method based on multi-scale feature fusion[C]. In: 2020 39th Chinese Control Conference (CCC). IEEE (2020). p. 7154–9.
30. Li Y, Xu P, Zhu Z. Real-time driver distraction detection using lightweight convolution neural network with cheap multi-scale features fusion block. In: Proceedings of 2021 Chinese Intelligent Systems Conference, Fuzhou, China, October 16–17, 2021. Singapore: Springer (2022). p. 232.
31. Chen H, Wang YH, Fan CH. A convolutional autoencoder-based approach with batch normalization for energy disaggregation. J Supercomputing (2021) 77(3):2961–78. doi:10.1007/s11227-020-03375-y
32. Dubey SR, Chakraborty S. Average biased ReLU based CNN descriptor for improved face retrieval. Multimedia Tools Appl (2021) 80(15):23181–206. doi:10.1007/s11042-020-10269-x
33. Stergiou A, Poppe R, Kalliatakis G. ”Refining activation downsampling with SoftPool,” in Proceedings of the IEEE/CVF International Conference on Computer Vision, Montreal, QC, October 10–17, 2021 (2021), 10357–66.
34. Zheng J, Wu H, Zhang H, Wang Z, Xu W. Insulator-defect detection algorithm based on improved YOLOv7[J]. Sensors (2022) 22(22):8801. doi:10.3390/s22228801
35. Ni X, Ma Z, Liu J, Shi B, Liu H. Attention network for rail surface defect detection via consistency of Intersection-over-Union (IoU)-Guided Center-Point Estimation[J]. IEEE Trans Industr Inform (2021) 18(3):1694–705. doi:10.1109/TII.2021.3085848
36. Abo-Elnaga Y, Nasr S. K-means cluster interactive algorithm-based evolutionary approach for solving bilevel multi-objective programming problems. Alexandria Eng J (2022) 61(1):811–27. doi:10.1016/j.aej.2021.04.098
37. Dawson WO, Kuhn CW. Enhancement of cowpea chlorotic mottle virus biosynthesis and in vivo infectivity by 2-thiouracil. Virology (1972) 47(1):21–9. doi:10.1016/0042-6822(72)90234-6
Keywords: multi-scale fusion, YOLOv5, loss function, softpool, object detection
Citation: He Y, Su Y, Wang X, Yu J and Luo Y (2023) An improved method MSS-YOLOv5 for object detection with balancing speed-accuracy. Front. Phys. 10:1101923. doi: 10.3389/fphy.2022.1101923
Received: 18 November 2022; Accepted: 13 December 2022;
Published: 05 January 2023.
Edited by:
Yu Liu, Hefei University of Technology, ChinaReviewed by:
Jinxing Li, Harbin Institute of Technology, Shenzhen, ChinaCopyright © 2023 He, Su, Wang, Yu and Luo. This is an open-access article distributed under the terms of the Creative Commons Attribution License (CC BY). The use, distribution or reproduction in other forums is permitted, provided the original author(s) and the copyright owner(s) are credited and that the original publication in this journal is cited, in accordance with accepted academic practice. No use, distribution or reproduction is permitted which does not comply with these terms.
*Correspondence: Yingying Su, eXlfc3UyMDAwQDE2My5jb20=
Disclaimer: All claims expressed in this article are solely those of the authors and do not necessarily represent those of their affiliated organizations, or those of the publisher, the editors and the reviewers. Any product that may be evaluated in this article or claim that may be made by its manufacturer is not guaranteed or endorsed by the publisher.
Research integrity at Frontiers
Learn more about the work of our research integrity team to safeguard the quality of each article we publish.