 Hongbin Liu
 Xinghao Jia
 Chenhui Su
- Shandong Key Laboratory of Intelligent Buildings Technology, School of Information and Electrical Engineering, Shandong Jianzhu University, Jinan, China
Tire appearance defect detection based on machine vision is an effective technology to improve the tire production quality. The detection process can be completed by the way of non-destructive testing. Therefore, more and more researchers are paying attention to this technology. However, tires are characterized by single block colors and various defects. It is a great challenge to accurately detect tire appearance defects. To complete the task of detecting tire defects, this paper presents a novel tire appearance defect detection method via combining histogram of oriented gradients (HOG) and local binary pattern (LBP) features. First, we construct a tire image dataset to provide defective and normal tire images. Then, histogram of oriented gradients and local binary pattern features of tire images are, respectively, extracted and used to train the support vector machine (SVM) classifier. Finally, the support vector machine classifier calculates the prediction scores of the test images via combining the histogram of oriented gradients and local binary pattern features. These scores can be utilized to determine whether the test image is a defective or a normal tire image, and the goal of tire appearance defect detection is achieved. Conducted on the tire image dataset, our method has verified the effectiveness of detecting tire detects, and the mean accuracy is improved more than 1.6% than the algorithm that only uses the histogram of oriented gradients or local binary pattern feature. The experimental results demonstrate that the combination of HOG and LBP features can increase tire appearance defect detection accuracy.
1 Introduction
In recent years, the number of cars owned by residents has increased rapidly. The tire is one of the most important parts of cars, and it is necessary to ensure the surface quality of the tire because it directly affects the safety of drivers’ lives. Therefore, the inspection of tire quality has become the focus in car manufacturing. The study of detecting tire appearance defects has excellent practical significance.
The tire production process is complicated and requires highly environmental and technological conditions. Tires in the high-speed production process often appear with a variety of minor defects, such as bubbles, peeling, impurities, bulging, and cracks. At the same time, most enterprises still use manual defect inspection according to personal experience; thus, some small defects cannot be effectively detected [1]. Moreover, the workload and work intensity of the workers are huge, and they are prone to misjudge easily when their eyes are fatigued [2, 3]. It is necessary to realize automatic and reliable inspection of tire appearance defects, and the accurate detection method is important to reduce labor costs and improve the tire quality.
To achieve the goal of tire appearance defect detection with machine vision, many researchers analyze edges and texture features of defects [4]. For example, [5, 6] propose a multi-scale edge detection method for tires based on the Fourier transform analysis and wavelet transform. This method obtains wavelet filter coefficients according to the analysis of tire image characteristics to improve the accuracy of graphic edge detection and obtains better edge detection results. Research [7–10] was conducted to using Gabor filtering or other methods to process artificial features to realize simple and effective tire appearance defect detection.
Some methods utilize X-ray images to detect tire defects. Chuanwen Lin et al. [11] introduced a novel method for shoulder bending detection in tire X-ray images. They present a seed searching algorithm to find the defect, and the method obtains higher precision and recall. Research[3] shows a new defect detection algorithm for the image of the tire. It uses the Faster R-CNN network of the deep learning algorithm, which overcomes the shortcomings of traditional defect detection algorithms that require human involvement to extract defect features. Jinyin Chen et al. [12] put forward a novel deep learning model and modified the Faster R-CNN to conduct X-ray defect detection. However, X-ray images used in these methods require expensive image acquisition equipment.
Convolutional neural network (CNN) models [13–18] have also been widely applied in tire appearance defect detection. Sofia Sa’idah et al. [19] detected tire defects using the CNN method with GoogLeNet architecture. This study uses secondary data obtained from the Kaggle web dataset and produces high accuracy. Zhouzhou Zheng et al. proposed a novel two-stage convolutional neural network (CNN) [20] and an end-to-end residual U-structure (HLU2-Net) [21] for tire defect detection. In HLU2-Net, the novel residual U-structure is used to replace the encode–decode block of U-Net for fusing multi-scale and multi-level features. Although the accuracy of the CNN model is high, the computational cost is also large.
To develop the simple and effective tire defect detection in the industrial field, we present a tire appearance defect detection method based on HOG and LBP features. First, the tire appearance defect detection dataset is constructed, which consists of normal and defective tire images. Then, after preprocessing the images in the dataset, our method extracts HOG and LBP features of the tire image, and the feature model is established by training SVM classifiers. Finally, the SVM classifier predicts whether there are defects in the tire image by fusing HOG and LBP features. The motivation of our method is that the HOG feature represents edge information and the LBP feature describes the texture feature of the tire appearance; thus, the fusion of these two features can consider edge and texture features synthetically, which is beneficial in improving the accuracy of defect detection. HOG and LBP features are representative descriptors for representing edge features and texture features, which have been applied in many other fields. The experimental results show that our proposed defect detection method can effectively and accurately identify crack defects. The main work and innovations of this paper are as follows:
1) A tire appearance defect detection dataset is constructed. The dataset collects 1,021 images that consist of normal and defective tire images.
2) We present a tire defect detection method via combining HOG and LBP features. The method considers HOG and LBP features comprehensively. HOG and LBP features describe edge and texture information on the tire image, respectively. Therefore, the fusion of HOG and LBP features is beneficial for improving the defect detection ability.
3) The experiments compare our method to the algorithms that use the HOG or LBP feature alone. The results show that the accuracy of fusing HOG and LBP features to detect tire appearance defects is higher than the accuracy of using HOG or LBP features alone.
2 Tire appearance defect detection method via combining HOG and LBP features
2.1 Overview of the proposed method
The overall flowchart of our proposed tire appearance defect detection method is shown in Figure 1. First, we collect tire images and obtain a dataset that consists of normal and defective images. Second, our method preprocesses the normal and defective images, and then, HOG and LBP features of tire images are extracted to describe the tire’s edge and texture information. Then, SVM classifiers are trained with HOG and LBP features, respectively. Afterward, the SVM classifier predicts the defective probability of the tire image with feature fusion by adding SVM predictive scores of HOG and LBP features. Finally, tire images are classified into normal or defective images.
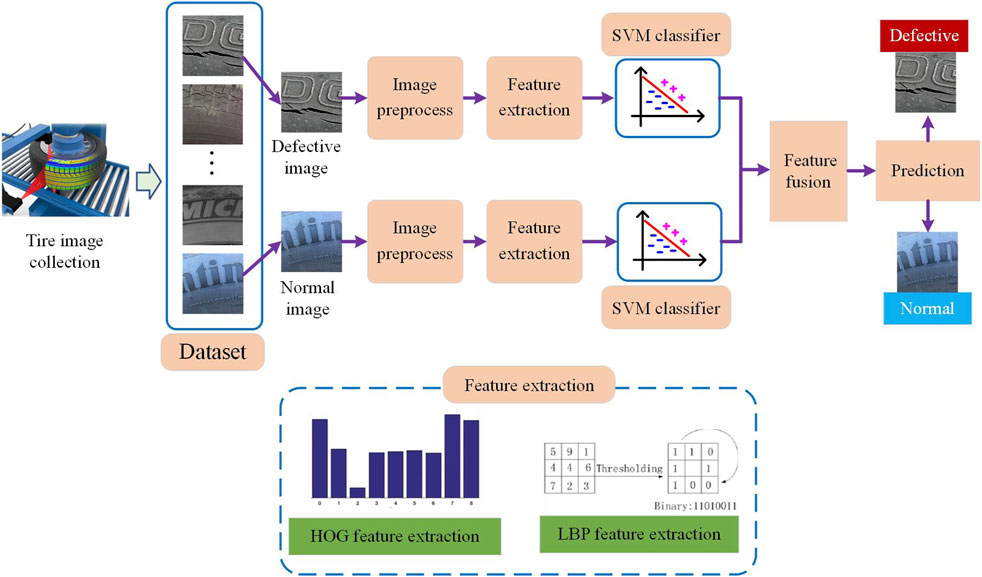
FIGURE 1. Tire appearance defect detection method via combining HOG and LBP features.
2.2 Construction of the tire image dataset
We construct a tire image dataset to effectively detect tire defects. A total of 1,021 tire pictures are obtained by collecting industrial field and network screenshots, including 530 defective tire pictures and 491 normal tire pictures.
This dataset is mainly designed for a type of tire crack defect. Some tires in the picture collected from the network are not from the production workshop, and these tires are older. Since dust, dirt, or other sundries on tires interfere with defect detection, it is more difficult to accurately detect defects for these tires compared with tires in the production workshop. Some tire images in the dataset are shown in Figure 2. Using all pictures in the dataset, we can test the robustness and accuracy of the proposed tire defect detection method.
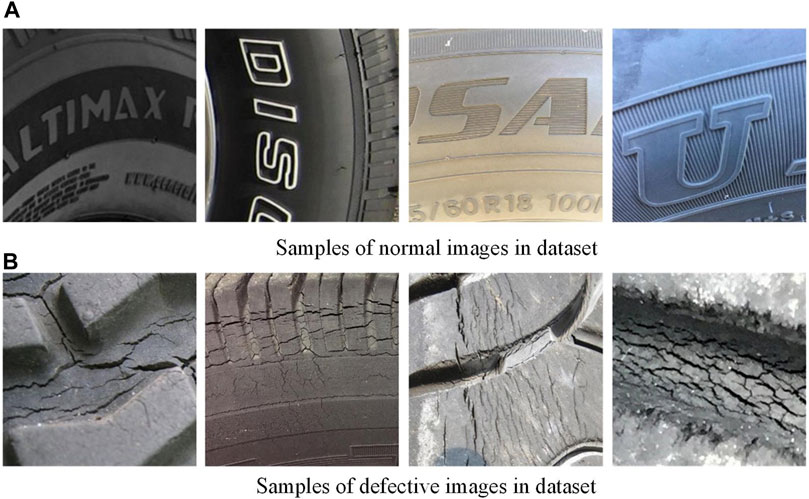
FIGURE 2. (A) shows samples of normal images in the dataset, (B) shows samples of defective images in the dataset.
2.3 Image preprocess
To reduce the amount of computation and facilitate the extraction of tire image features, the paper preprocesses the tire image by using the weighted average gray-scale algorithm and the bilinear interpolation image size normalization algorithm.
2.3.1 The weighted average gray-scale algorithm
The color of every pixel in the image is composed of R (red), G (green), and B (blue) colors. Each component of these three color components is described with 255 values. If the feature is extracted directly from the original image, each pixel can produce more than 16 million (i.e., 2553) parameters. These parameters easily lead to an exponential increase of computation in the process of feature extraction.
In this paper, the weighted average method is used for image gray processing, and different weights are used for the weighted average of RGB color components. The specific principles are interpreted as follows [22]:
where
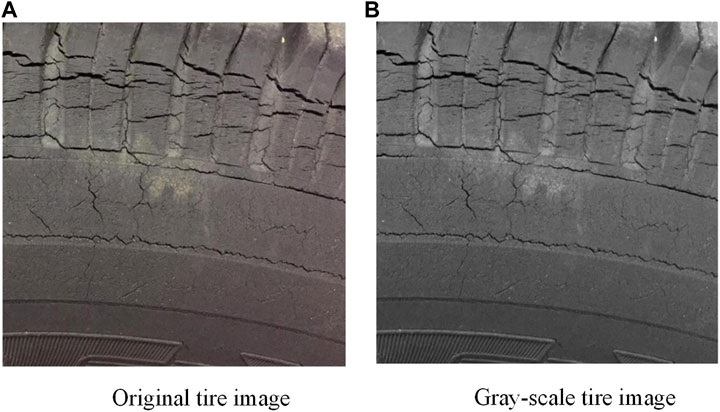
FIGURE 3. (A) shows Original tire image, (B) shows Gray-scale tire image.
2.3.2 The image size normalization algorithm
If the image sizes for feature extraction are different, the dimensions of feature vectors will also be different. This difference disturbs the subsequent defect recognition because the similarity between feature vectors cannot be calculated. Therefore, it is necessary to normalize the sizes of the images in the dataset. In this paper, the bilinear interpolation algorithm is used to unify the sizes of all images in the dataset to 64 × 64 pixels.
The schematic diagram of bilinear interpolation is shown in Figure 4. The value of a new pixel interpolated point P is calculated by interpolating in the vertical Y direction of
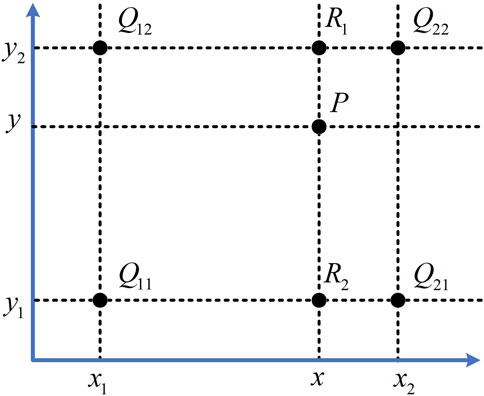
FIGURE 4. Schematic diagram of the bilinear interpolation method.
2.4 HOG feature extraction
The flowchart of the HOG feature extraction for the tire image is shown in Figure 5. The tire image is divided into several blocks without overlapping each other, and the block is then further divided into four cells. These cells and blocks are used to calculate HOG and LBP descriptors. In this section, we mainly interpret the HOG feature extraction process. LBP feature extraction is described in Section 2.5.
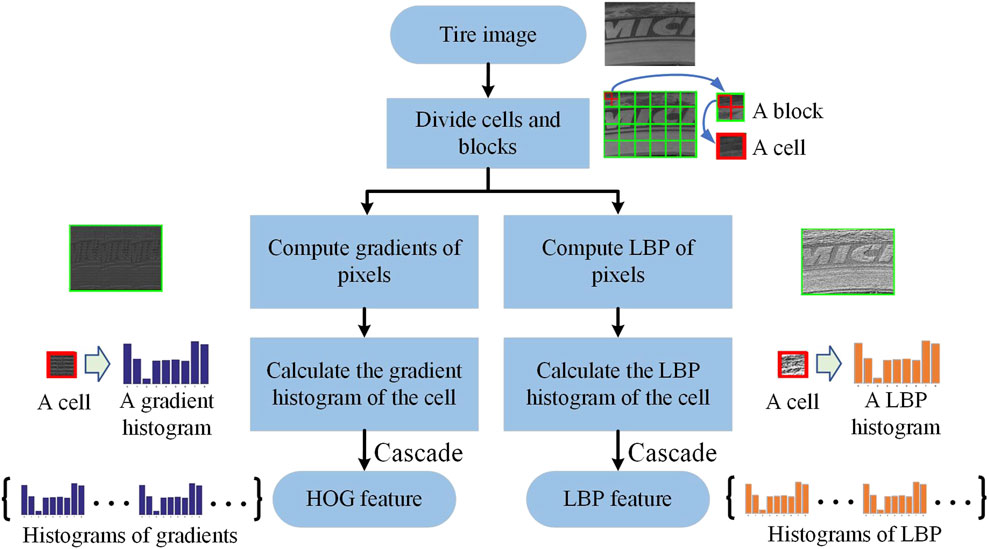
FIGURE 5. HOG and LBP feature extraction flow.
In the process of HOG feature extraction, the gamma transform of the target image is first used to reduce the influence of the illumination intensity change on image features, and then, the gradient operator is used to compute gradients of pixels. Afterward, our method calculates the cell’s histogram with weighted projection statistics. Finally, all histograms are cascaded to construct the HOG feature of the whole tire image.
2.4.1 Computational gradients of pixels
The accurate extraction of the HOG feature is interfered by the change of the illumination intensity when the image is photographed. To overcome this problem, gamma is used to improve the illumination robustness of the tire image to reduce the influence of the illumination intensity change. Assuming the gamma value is 1/2, the gamma compression transformation formula is as follows [24]:
where
The gradient calculation formulas for the X direction and Y direction of the image are described in the following equations:
where
The gradient amplitude and direction at the image pixel
where
2.4.2 Calculating the gradient histogram of the cell
Gradient directions and amplitudes of all pixels of the cell are counted to generate histograms. The horizontal axis of this histogram is the gradient direction, and the vertical axis is the gradient cumulative amplitude of each gradient direction interval. In general, the gradient direction ranges from 0° to 180°; it is divided into nine parts (bins) on average, i.e., any gradient direction bin = 20°.
Afterward, the cumulative sum of gradient amplitudes in each gradient direction bin is counted to obtain the eigenvector of each cell. This process is equivalent to mapping the pixels in the image to a corresponding angle range, and the weighted projection is carried out in the gradient direction histogram.
2.4.3 Obtaining the HOG feature
Each adjacent cell unit is combined into a large and spatially connected block, and then, the eigenvectors of each cell unit in the block are connected in a series to obtain the block descriptor. After eigenvectors of this block are normalized, we can obtain the HOG descriptor.
The final HOG feature of the tire image can be obtained by cascading all feature vectors in the block. Figure 6 shows the original image and gradient feature maps of normal and defective images.
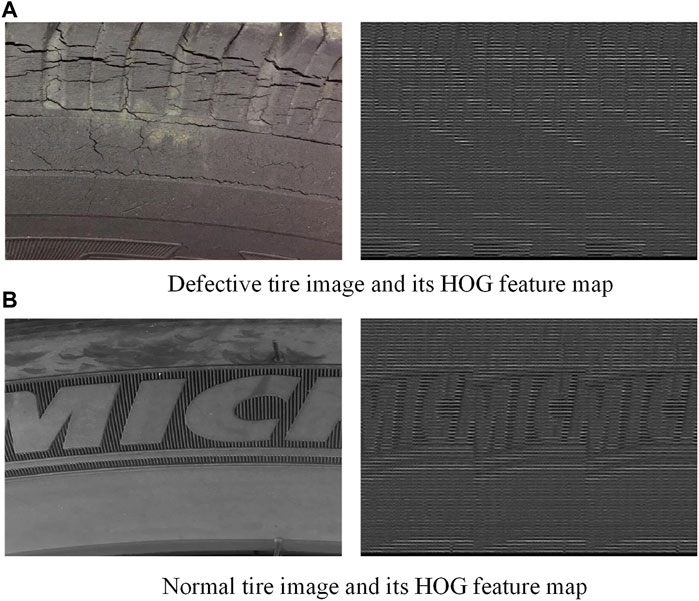
FIGURE 6. (A) shows defective tire image and its HOG feature map, (B) shows normal tire image and its HOG feature map.
2.5 LBP feature extraction
The local binary pattern (LBP) is an operator used to describe the local texture features of an image. The texture refers to the natural attribute of the surface of the object, which describes the distribution relationship between image pixels. The LBP feature does not change with the variation of the external illumination intensity.
2.5.1 Computation of the LBP of pixels
Figure 7 shows the flowchart of LBP feature extraction for the tire image. The basic idea of the LBP is to compare the gray value of an image pixel with the gray value of its surrounding pixels [25]. If the gray value of the surrounding pixels is greater than the gray value of the point, it is marked as 1; on the other hand, if the gray value of the surrounding pixel is less than the point, then it is marked as 0. The compared results are saved as a binary number, which is the LBP value of the point reflecting the local texture features of the image.
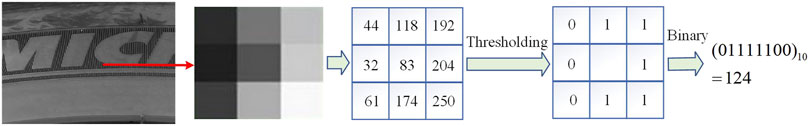
FIGURE 7. LBP descriptor calculation process.
In our method, the basic LBP operator is used to calculate the LBP value of each pixel for the pre-processed tire image. The gray value of each pixel is compared with the gray value of the surrounding 3 × 3 neighborhood. If the gray value of the pixel larger than the center point is marked as 1, then the gray value of the pixel smaller than the center point is marked as 0. The result is saved as a binary number. After calculating LBP descriptors of all pixels in the image, we can obtain the LBP feature map.
2.5.2 Calculating the LBP histogram of the cell
The LBP image is divided into non-overlapping blocks and cells. The histograms of all blocks and cells are calculated. Since there are 256 (i.e., 28) possible values for LBP values, the horizontal coordinate values of the histogram, therefore, range from 1 to 256.
2.5.3 Obtaining the LBP feature
The LBP feature vectors of the whole tire image can be obtained by cascading LBP features of each region block. Figure 8 shows LBP feature maps of the normal tire image and the defective tire image.
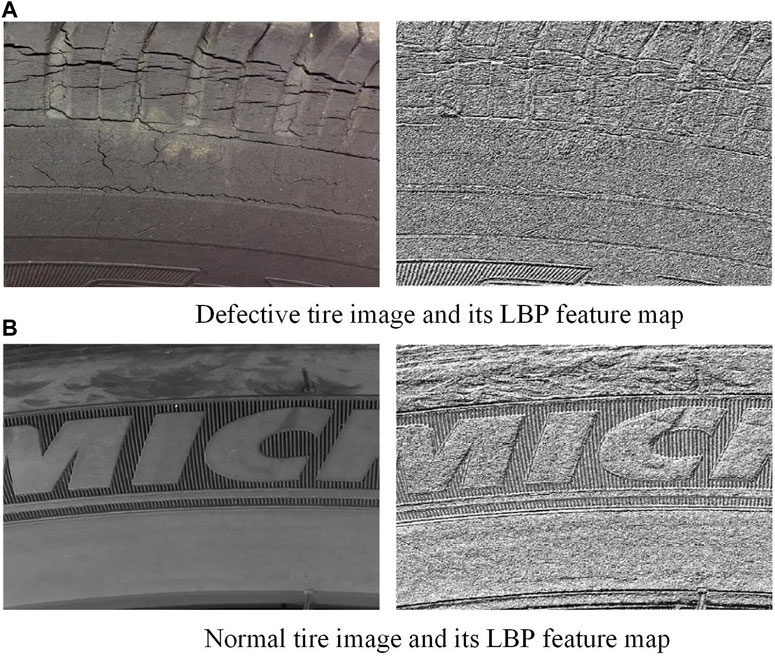
FIGURE 8. (A) shows defective tire image and its LBP feature map, (B) shows normal tire image and its LBP feature map.
2.6 SVM classifier
After extracting HOG and LBP features, this paper, respectively, uses the two features to train SVM classifiers to get the prediction probability values for feature fusion.
The idea of the SVM classifier is that if the original data cannot be classified effectively in a low dimension, then the original data samples can be mapped to a higher or even infinite dimension feature space by the non-linear mapping algorithm. Then, the linear indivisible problem of the original space can be transformed into a linear separable problem in the high-dimension space.
To design SVM with a better classification performance, it is necessary to choose an appropriate kernel function. In this paper, the linear kernel function is selected for the case of linear separability [26]:
The non-kernel functions selected for the linear indivisibility are as follows:
1) The polynomial kernel function:
This is a polynomial classifier of order q. q generally takes 1–10 values.
2) The radial basis kernel function:
where sigma is generally selected from .001 to .006.
The cross-validation method is employed to select the kernel function. Cross-validation uses different kernel functions to train original samples until a kernel function with the smallest error is obtained.
Using the SVM classifier to test the tire image, our method outputs the prediction scores to classify the tire image as a normal image or defective image. The SVM prediction scores using HOG and LBP features are recorded as
2.7 Fusion of HOG and LBP features
The HOG and LBP feature can, respectively, describe the shape and texture information, but the tire appearance image consists of complex semantic information, and the observation contained by one feature alone has limitations. Therefore, HOG and LBP features are fused to build a relatively comprehensive tire feature model.
The additive fusion method is used to combine HOG and LBP feature prediction scores, and this prediction score fusion considers the shape and texture information comprehensively. The additive fusion is chosen according to the characteristics of the SVM classifier score. We do not utilize multiplicative fusion because the SVM classifier score may be zero. Multiplying zero with any score still equals zero, which may interfere with the correct judgment in multiplicative fusion. In other words, the non-zero similarity score may be changed to zero after multiplicative fusion; however, this zero score may be wrongly classified, which reduces the defect detection accuracy. In comparison, additive fusion can reduce the influence of the zero value, so we select the additive fusion method in this paper. The additive fusion formula is as follows:
where
Finally, the input tire image is classified according to the score value, when the first element in
3 Experimental results and analysis
In this paper, we test our method on the formulated dataset, and the effectiveness and accuracy of the algorithm is verified.
In the experiments, we randomly assign 80% (i.e., 817 images) of 1,021 tire images as training sets and 20% (i.e., 204 images) as test sets. The experiment is based on the MATLAB platform. The computer processor is Intel Core i7 2.3 GHz, and the memory is 16 GB.
To verify the improvement of fusing HOG and LBP features for tire defect detection methods, the defect detection results and accuracies of the following three algorithms are compared and analyzed:
1) HOG + SVM: Using the HOG feature and SVM classifier to realize tire image defect detection.
2) LBP + SVM: Using the LBP feature and SVM classifier to realize tire image defect detection.
3) HOG + LBP + SVM: Fusing HOG and LBP features and then combining the SVM classifier to realize tire image defect detection.
3.1 HOG + SVM tire defect detection method
We implement the HOG + SVM algorithm for tire images. Figure 9 shows the detection results and the corresponding original image. The results show that the HOG + SVM algorithm can detect the defective and normal image correctly, as shown in Figures 9A,B. However, some defective images are prone to be determined as normal images easily, which generates a false result, as shown in Figure 9C. It is because that the HOG only describes the edge information on the tire, defects such as cracks are easily regarded as tire patterns. To verify the ability of the HOG + SVM algorithm, the accuracy of the defect detection method is computed. The accuracy is formulated as follows:
where
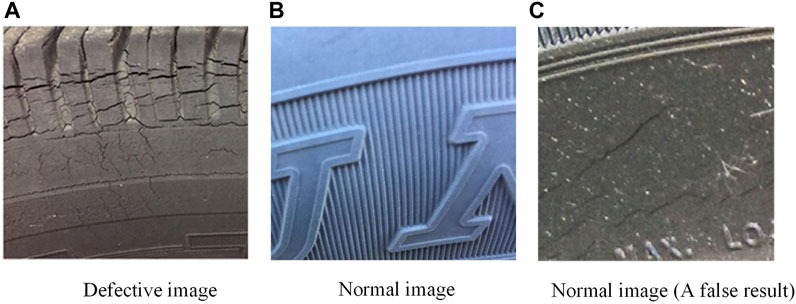
FIGURE 9. (A) shows defective image detection result using the HOG + SVM algorithm, (B) shows normal image detection result using the HOG + SVM algorithm, (C) shows a false result using the HOG + SVM algorithm.
Table 1 shows the tire image defect detection accuracies of the HOG + SVM algorithm. The experimental results show that the recognition rate of the tire appearance defect detection by the HOG feature combined with the SVM classifier is about 70%. Although it can effectively detect some defects, it is far from enough for the desired effect in actual production. This method has a higher accuracy when detecting normal images, but there are still errors when detecting defective images, as shown in Figure 9.
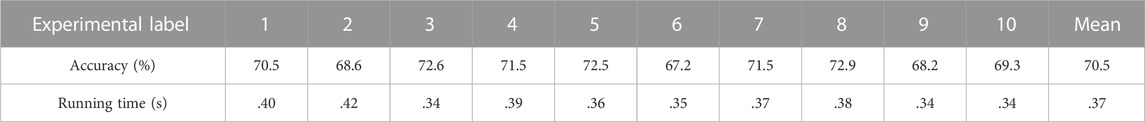
TABLE 1. Tire image defect detection accuracy of the HOG + SVM algorithm.
3.2 LBP + SVM tire defect detection method
We implement the LBP + SVM algorithm for tire images. Figure 10 shows the detection results and the corresponding original image. The results show that the LBP + SVM algorithm can detect the defect image correctly, as shown in Figure 10.
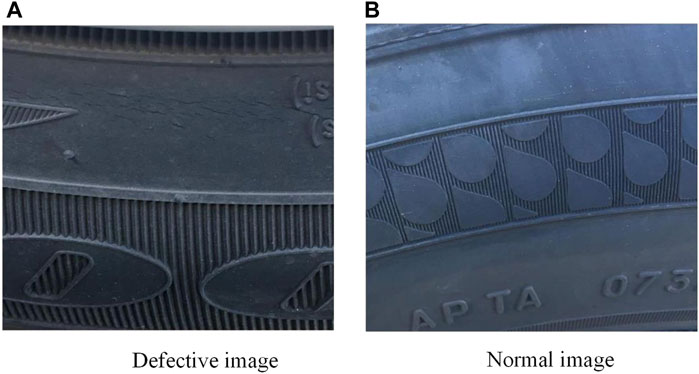
FIGURE 10. (A) shows defective image detection result using the LBP + SVM algorithm, (B) shows normal image detection result using the LBP + SVM algorithm.
Table 2 shows the tire image defect detection accuracies of the LBP + SVM algorithm. Compared with HOG + SVM, the LBP + SVM algorithm obtains higher detection accuracy. The accuracy of the LBP + SVM algorithm is higher than 12%. We think that the LBP is mainly used to describe texture features of the tire; the texture feature has a more discriminative ability for classifying the tire defect. Once a defect occurs, the LBP feature can clearly show the texture features of the image, and even small cracks can be detected.
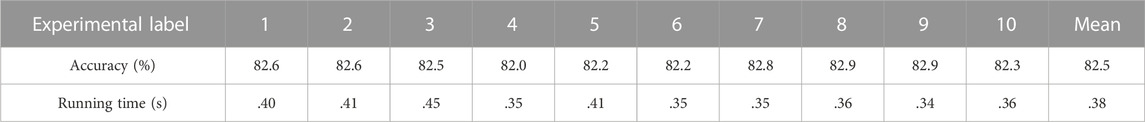
TABLE 2. Tire image defect detection accuracy of the LBP + SVM algorithm.
3.3 HOG + LBP + SVM tire defect detection method
3.3.1 Fusion parameters
According to Eq. 13, the additive fusion method consists of two important parameters, i.e.,
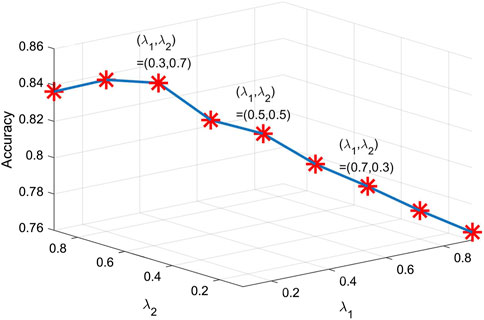
FIGURE 11. Accuracy curve with various weight coefficients.
If it is assumed that
3.3.2 Tire defect detection results
The detection images and defect results are shown in Figure 12 and Table 3. The experimental results show that our proposed HOG + LBP + SVM algorithm can correctly detect the defective and normal tire image. Moreover, the detection accuracy based on HOG + LBP + SVM is about 84%. The mean accuracy of the HOG + LBP + SVM is 1.6% and 13.6% higher than that of HOG + SVM and LBP + SVM algorithms, respectively. These results verify the effectiveness of combining the HOG feature and the LBP feature. The proposed method can complement the advantages of HOG and LBP features, and the edge and texture features of the tire image are comprehensively utilized to detect tire appearance defects.
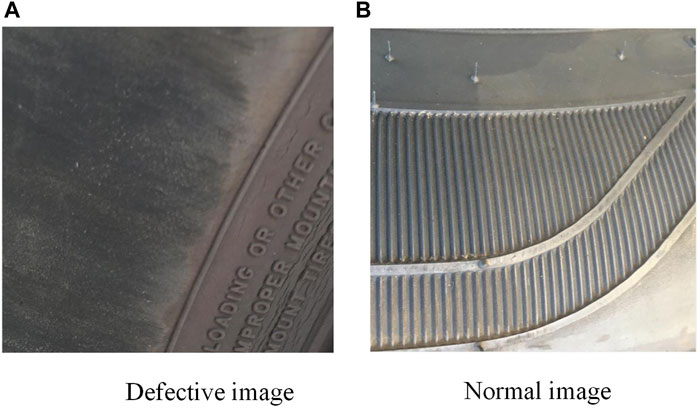
FIGURE 12. (A) shows defective image detection result using the HOG + LBP + SVM algorithm, (B) shows normal image detection result using the HOG + LBP + SVM algorithm.
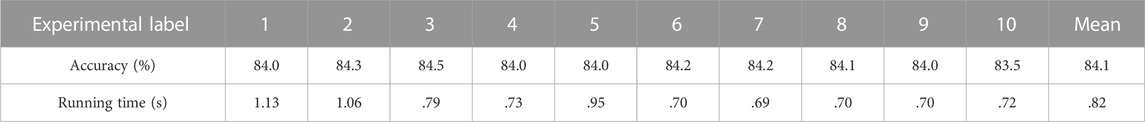
TABLE 3. Tire image defect detection accuracy of the HOG + LBP + SVM algorithm.
In addition, we list the running time of the three algorithms in Tables 1–3 to analyze the speed of our proposed method. When compared to the algorithm only using the HOG or LBP feature, the combined algorithm needs more running time. In other words, feature fusion really increases the computational complexity. However, the significance of the improving accuracy is more important than the influence of the increasing time in some applications. Certainly, we will further optimize the algorithm structure to improve the calculation speed, and it is believed that the increased running time with the milliseconds level can be accepted under the rapid development of the GPU computing ability.
4 Conclusion
The paper proposes a tire defect detection method based on the fusion of HOG and LBP features. First, we establish a tire image dataset that consists of normal and defective tire images. Then, tire images are grayed and normalized to reduce the computational complexity and enhance the image quality. Afterward, the HOG feature and LBP feature are extracted and used to train the SVM classifier. Finally, the tire images are classified into the normal or defective image by fusing the prediction scores of HOG and LBP features. The experimental results show that our proposed method can effectively detect tire appearance defects. Compared to algorithms only using the HOG or LBP feature, the proposed method obtains higher detection accuracy.
Data availability statement
The raw data supporting the conclusion of this article will be made available by the authors, without undue reservation.
Author contributions
HL, CS, and CL: methodology; XJ: software; HL and HY: formal analysis; HL and CS: writing—reviewing and editing.
Funding
This work was supported by the Doctoral Research Fund Project of Shandong Jianzhu University under grant XNBS20081, the Shandong Province Natural Science Foundation, China, ZR2021QF077, and the Shandong Provincial Key Research and Development Program (Major Scientific and Technological Innovation Project), China, 2021CXGC011205.
Conflict of interest
The authors declare that the research was conducted in the absence of any commercial or financial relationships that could be construed as a potential conflict of interest.
Publisher’s note
All claims expressed in this article are solely those of the authors and do not necessarily represent those of their affiliated organizations, or those of the publisher, the editors, and the reviewers. Any product that may be evaluated in this article, or claim that may be made by its manufacturer, is not guaranteed or endorsed by the publisher.
References
1. Zhang Y, Wang Y, Jiang Z, Liao F, Zheng L, Tan D, et al. Diversifying tire-defect image generation based on generative adversarial network. IEEE Trans Instrumentation Meas (2022) 71:1–12. doi:10.1109/tim.2022.3160542
2. Zhang Y, Wang Y, Jiang Z, Zheng L, Chen J, Lu J. Tire defect detection by dual-domain adaptation-based transfer learning strategy. IEEE Sensors J (2022) 22(19):18804–14. doi:10.1109/jsen.2022.3201201
3. Zhu Q, Ai X. The defect detection algorithm for tire x-ray images based on deep learning. In: IEEE International Conference on Image, Vision and Computing; 27-29 June 2018; Chongqing, China (2018). p. 138–42. doi:10.1109/ICIVC.2018.8492908a
4. Wang R, Guo Q, Lu S, Zhang C. Tire defect detection using fully convolutional network. IEEE Access (2019) 7:43502–10. doi:10.1109/access.2019.2908483
5. Zhang Y, Li T, Li Q. Defect detection for tire laser shearography image using curvelet transform based edge detector. Opt Laser Technol (2013) 47:64–71. doi:10.1016/j.optlastec.2012.08.023
6. Zhang Y, Li T, Li QL. Detection of foreign bodies and bubble defects in tire radiography images based on total variation and edge detection. Chin Phys Lett (2013) 30(8):084205. doi:10.1088/0256-307x/30/8/084205
7. Sun H, Gu N, Lin C. Tire impurity defect detection based on grayscale correction and threading method. In: IEEE International Conference on Computer and Communication Systems; 23–26 April 2021; Chengdu, China (2021). p. 229–33.
8. Cheng J, Liu A, Tian T. Tire defect detection algorithm based on multi-task learning and normal feature fusion. In: International Conference on Computer Graphics, Artificial Intelligence, and Data Processing; 24–26 December 2021; Harbin, China (2021). p. 415–22.
9. Shabir MA, Hassan MU, Yu X, Li J. Tyre defect detection based on GLCM and Gabor filter. In: International Multitopic Conference; 29-30 November 2019; Islamabad, Pakistan (2019). p. 1–6. doi:10.1109/INMIC48123.2019.9022777
10. Saleh RAA, Konyar MZ, Kaplan K, Ertunç HM. Tire defect detection model using machine learning. In: 2022 2nd International Conference on Emerging Smart Technologies and Applications; 25-26 October 2022; Ibb, Yemen (2022). p. 1–5. doi:10.1109/eSmarTA56775.2022.9935140
11. Lin C, Chen G, Zhang Y, Sun F. Automatic detection of shoulder bending defects in tire X-ray images. In: International Conference on Computer Engineering and Applications; 18-20 March 2020; Guangzhou, China (2020). p. 877–81. doi:10.1109/ICCEA50009.2020.00193
12. Chen J, Li Y, Zhao J. X-ray of tire defects detection via modified faster R-CNN. In: International Conference on Safety Produce Informatization; 28-30 November 2019; Chongqing, China (2019). p. 257–60. doi:10.1109/IICSPI48186.2019.9095873
13. Pahinkar A, Mohan P, Mandal A, Krishnamoorthy A. Faster region based convolutional neural network and VGG 16 for multi-class tyre defect detection. In: International Conference on Computing Communication and Networking Technologies; 06-08 July 2021; Kharagpur, India (2021). p. 01–7. doi:10.1109/ICCCNT51525.2021.9579855
14. Li P, Dong Z, Shi J, Pang Z, Li J. Detection of small size defects in belt layer of radial tire based on improved faster R-CNN. In: International Conference on Information Science and Technology; 21-23 May 2021; Chengdu, China (2021). p. 531–8. doi:10.1109/ICIST52614.2021.9440580
15. Tao J, Zhu Y, Liu W, Jiang F. Smooth surface defect detection by deep learning based on wrapped phase map. IEEE Sensors J (2021) 21(14):16236–44. doi:10.1109/jsen.2021.3076610
16. Yang H, Wang Y, Hu J, He J, Yao Z, Bi Q. Segmentation of track surface defects based on machine vision and neural networks. IEEE Sensors J (2021) 22(2):1571–82. doi:10.1109/jsen.2021.3133280
17. Guo R, Liu H, Xie G, Zhang Y. Weld defect detection from imbalanced radiographic images based on contrast enhancement conditional generative adversarial network and transfer learning. IEEE Sensors J (2021) 21(9):10844–53. doi:10.1109/jsen.2021.3059860
18. Mohan P, Pahinkar A, Karajgi A, Kumar LD, Kasera R, Gupta AK, Nar SJ. Multi-contrast convolution neural network and fast feature embedding for multi-class tyre Defect Detection. In: International Conference on Electronics, Communication and Aerospace Technology; 05-07 November 2020; Coimbatore, India (2020). p. 1397–405. doi:10.1109/ICECA49313.2020.9297615
19. Sa'idah S, Fany A, Suparta IPYN. Convolutional neural network GoogleNet architecture for detecting the defect tire. In: International Conference on Computer Science and Software Engineering; 15-17 March 2022; Duhok, Iraq (2022). p. 331–6. doi:10.1109/CSASE51777.2022.9759694
20. Zheng Z, Yang H, Zhou L, Yu B, Zhang Y. HLU2-Net: A residual U-structure embedded U-Net with hybrid loss for tire defect inspection. IEEE Trans Instrumentation Meas (2021) 70:1–11. doi:10.1109/tim.2021.3126847
21. Zheng Z, Zhang S, Shen J, Shao Y, Zhang Y. A two-stage CNN for automated tire defect inspection in radiographic image. Meas Sci Technol (2021) 32(11):115403. doi:10.1088/1361-6501/ac13f8
22. Kumar K, Li JP, Shaikh RA, Ahmed R. Content based image retrieval using gray scale weighted average method. Int J Adv Comput Sci Appl (2016) 7(1). doi:10.14569/ijacsa.2016.070101
23. Kirkland EJ. Bilinear interpolation. In: Advanced computing in electron microscopy. Boston, MA: Springer (2010). p. 261–3.
24. Huang J, Haq IU, Dai C, Khan S, Nazir S, Imtiaz M. Isolated handwritten Pashto character recognition using a K-NN classification tool based on zoning and HOG feature extraction techniques. Complexity (2021) 2021:1–8. doi:10.1155/2021/5558373
25. Zeebaree DQ, Abdulazeez AM, Zebari DA, Haron H, Nuzly Abdull Hamed H. Multi-level fusion in ultrasound for cancer detection based on uniform LBP features. Comput Mater Continua (2021) 66(3):3363–82. doi:10.32604/cmc.2021.013314
Keywords: tire appearance, defect detection, non-destructive testing, feature fusion, image feature
Citation: Liu H, Jia X, Su C, Yang H and Li C (2023) Tire appearance defect detection method via combining HOG and LBP features. Front. Phys. 10:1099261. doi: 10.3389/fphy.2022.1099261
Received: 15 November 2022; Accepted: 28 December 2022;
Published: 12 January 2023.
Edited by:
Bo Feng, Huazhong University of Science and Technology, ChinaReviewed by:
Fengfei Jin, Shandong Normal University, ChinaMingwei Shao, Qingdao University of Technology, China
Copyright © 2023 Liu, Jia, Su, Yang and Li. This is an open-access article distributed under the terms of the Creative Commons Attribution License (CC BY). The use, distribution or reproduction in other forums is permitted, provided the original author(s) and the copyright owner(s) are credited and that the original publication in this journal is cited, in accordance with accepted academic practice. No use, distribution or reproduction is permitted which does not comply with these terms.
*Correspondence: Hongbin Liu, bGl1aG9uZ2JpbjE5QHNkanp1LmVkdS5jbg==