
94% of researchers rate our articles as excellent or good
Learn more about the work of our research integrity team to safeguard the quality of each article we publish.
Find out more
ORIGINAL RESEARCH article
Front. Phys., 04 January 2023
Sec. Optics and Photonics
Volume 10 - 2022 | https://doi.org/10.3389/fphy.2022.1096290
This article is part of the Research TopicAdvances in BiophotonicsView all 5 articles
 Shuyan Zhang1*
 Jian Jun Chua1,2Wilbert Yao Hwee Tang1,2Joseph Yong Xin Cheng1,2Xiuting Li1Malini Olivo1*
Most fluorescent imaging systems use pre-defined filter sets with limited flexibility in the choice of excitation and emission bands and suffer from crosstalk between different fluorophores for multiplexed imaging. When implemented in the context of optical fibers for biological imaging in a remote setting with space constraints, the size of the fiber probe is crucial. To overcome these challenges, we combined the merits of hyperspectral imaging and an ultrathin optical imaging fiber where fluorescent images at 311 spectral bands in the visible range were captured using a liquid crystal tunable filter with a fiber probe of 500 μm in diameter. Fluorescent experiments were performed on quantum dots mixtures and genetically modified E. coli bacteria mixtures to demonstrate the system’s capabilities for multiplexed imaging. Images were first processed using a Fourier transform filtering technique to remove the fiber core pattern artifact. Subsequently, the classification of different types of bacteria samples was calculated using two methods, namely, spectral unmixing with maximum abundance and spectral matching with minimum spectral angle distance. Finally, the spatial distributions of individual bacteria types were overlaid with the mixture image, and the two classification results matched well. A simple-to-use graphic user interface (GUI) platform for the hyperspectral imaging fiber probe system was developed which performs image processing and displays the classification results. The methods and results presented will appeal to the optical fiber-based imaging and hyperspectral imaging communities in general and have great potential for biological imaging applications.
The technique of utilizing fluorophores such as quantum dots to label and image particular features in a sample is known as fluorescent imaging [1], on the basis that fluorophores can provide better visual contrast and localization information for the features of interest as compared to unlabeled samples. While fluorescent imaging can acquire spatial information regarding the localization of fluorophores across a sample, it cannot identify each fluorophore according to its unique spectral fingerprint; for this to be accomplished, fluorescence spectroscopy has to be performed instead. Conversely, while it is able to acquire spectral information to deduce the type of a particular fluorophore and its intensity, the technique of fluorescence spectroscopy is only able to do so for a single point within a sample and lacks the ability to visualize the localization of fluorophores across the sample. Currently, emission filters are used to isolate the spectral band corresponding to the fluorescence emission of each fluorophore, thus allowing for one fluorophore to be imaged at a time; as such it is not strictly necessary for fluorophores to be identified by their spectral fingerprint. However, imaging multiple fluorophores with different spectral characteristics remains a tedious process, requiring the use of separate excitation and emission filters that are specifically optimized for each fluorophore, which has to be swapped out before imaging each fluorophore as such the sample has to be imaged sequentially for each fluorophore used. Unconventional fluorophores thus pose an added challenge when they do not match well with the spectral bandwidth of commonly used emission filters. Furthermore, it is especially challenging to identify fluorophores with highly similar emission spectra and large spectral overlaps. This may impose limitations on the experimental design when multiple fluorophores are intended to be used simultaneously or when imaging targets in the sample are located close to each other spatially.
Several solutions have been proposed to solve this problem, for example, fluorescent imaging with switchable photochromic naphthopyrans [2] and fluorescent lifetime imaging microscopy (FLIM) [3]. Fluorescent imaging using the hyperspectral imaging (HSI) technique is another promising solution because the spectral channel selection is very precise which allows the detection of hundreds of different fluorophores simultaneously and rapidly. HSI combines the principles of optical imaging with spectroscopy, capturing three-dimensional images comprised of information from the spatial dimensions (x, y) and the spectral dimension (λ) [4]. As such, each pixel in a hyperspectral image contains the complete spectrum of the sample imaged by that pixel, and conversely, each wavelength on the spectrum contains its corresponding single-channel image. This technique is useful in multiplexed fluorescent imaging where each fluorophore within the sample can be identified by its spectral characteristics and at the same time, the spatial localization of each type of fluorophore can be elucidated. Pioneer work was developed for optical fiber-based hyperspectral imaging probes, especially for biological applications [5–11]. For example, Bae et al. demonstrated a multispectral fluorescent imaging endoscopy system based on optical fibers with multiple fluorophores for colon cancer detection [5]. Kim et al. demonstrated a multimodal endoscopic system based on optical fibers with white light, multispectral, and photometric stereo imaging features for colorectal cancer detection [6].
This paper builds on the existing literature and improves the fiber size, spatial resolution, and spectral resolution. It also introduces a simple-to-use open-source graphic user interface (GUI) that includes functions for image pre-processing (image correction, selecting region of interest, Fourier transform filtering for fiber core pattern removal) and image classification results (spectral unmixing and spectral angular mapper). An ultrathin fiber-based fluorescent imaging probe based on hyperspectral imaging was constructed with two key components. One was an ultrathin imaging fiber consisting of 10,000 cores with a diameter of 500 μm and the other one was a liquid crystal tunable filter which selected the spectral channels at high precision without any mechanical movements. The system was demonstrated with quantum dot fluorophores and genetically modified bacteria samples using single-band ultraviolet illumination. For each sample, a hyperspectral image consisting of 311 spectral bands was captured and their spectral and spatial features were studied. The GUI implements the image processing techniques including Fourier transform filtering for removing the fiber core pattern artifact and spectral unmixing and spectral matching for performing classification were explored. Classification results of different bacteria types and their spatial distributions in a mixed environment were compared using both methods and the results matched well. Overall, the results presented here will be useful for the data acquisition and processing of optical fiber-based imaging and hyperspectral imaging in general.
The system was constructed based on a hyperspectral microscopy system that we reported earlier [12], where the condenser was replaced with an imaging fiber. The schematic is shown in Figure 1. Customized holders were made to place the imaging fiber with fine adjustment of the proximal and distal ends in the x-, y-, and z-axis. This enables the sample images at a far distance to be relayed through the imaging fiber to the camera with high precision. A UV LED light source (M375L4, Thorlabs) with central peak emission at 375 nm. It was connected to a collimator to produce collimated input light to the sample. To avoid any chromatic aberration during the hyperspectral image acquisition, an achromatic microscope objective was used (CFI Plan Apochromat Lambda 10x/0.45 NA, Nikon). With high proficiency in correcting chromatic aberration, this objective lens is capable of enhancing the spatial resolution of images across a broad spectral range, hence, improving the spectral profiles of the hyperspectral images. After the light passed through the objective, a liquid crystal tunable filter (Kurios-VB1, Thorlabs) was used to scan the spectral range from 420 to 730 nm with an FWHM of 10 nm and at a switching speed of 200 ms for the narrow band setting. All HSI images in this paper were captured using a step size of 1 nm, corresponding to a total of 311 spectral bands. Compared to a rotating filter wheel, this filter does not have any mechanical vibration, avoiding image misregistration issues and preserving both spatial and spectral signals. The monochrome camera (CS126MU, Thorlabs) features a large field of view (1.1″ optical format, 12.3 MP) with a frame rate of 21.7 fps.
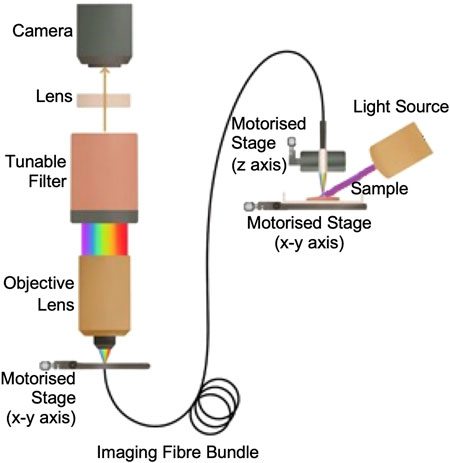
FIGURE 1. Schematic of the fiber-based fluorescent imaging system based on hyperspectral imaging.
The fiber probe was constructed using an ultrathin imaging fiber bundle of 10,000 cores with a diameter of 500 μm (FIGH-10-500N, Fujikura) and the distal end attached to an imaging focusing rod lens with an NA = 0.5 and a working distance of 5 mm made of non-toxic silver-based glass material (GT-IFRL-050-005-50-NC, GRINTech). In addition, we have also characterized several other imaging fibers with similar specifications for comparison. For example, a bare FIGH-10-500N fiber without the imaging focusing rod lens and a FIGH-10-350S fiber with the imaging focusing lens. Comparing FIGH-10-500N with and without the focusing lens, it was found that the working distance and image field of view (FOV) were increased significantly, but the spatial resolution was decreased. Comparing FIGH-10-500N and FIGH-10-350S, both with an imaging focusing lens, the former has a larger field of view, but a poorer spatial resolution. The FOV and the spatial resolution of three imaging fiber bundles from Fujikura were measured using a 1951 USAF resolution target, as shown in Table 1. The values were obtained after performing the fiber core pattern removal. The selection of the imaging fiber should consider the FOV, resolution, and working distance required for each application.
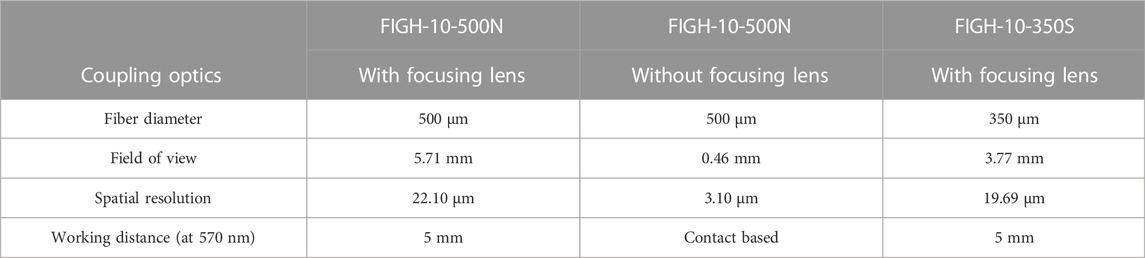
TABLE 1. FOV and resolution of imaging fibers.
Although fiber bundles are powerful tools with great flexibility to access difficult-to-reach regions in a minimally invasive way, the physical structures of optical fibers, however, introduce honeycomb-like patterns on the obtained images, as shown in Figure 2A. A zoom-in image is shown in Figure 2E where the honeycomb-like patterns are clearly visible. These patterns can be periodic or irregular. The spatial arrangement of the fiber cores depends on the type of imaging fibers. The artifact comes from the fact that the fiber cores are made of glass with a high refractive index and coated with cladding with a lower refractive index. Light is guided from one end to another through the individual cores based on total internal reflections at the core-cladding interface. Outside the cores, light is unable to pass through, resulting in bright cores with dark surroundings, hence the so-called honeycomb-like patterns or pixelation artifact. The claddings that do not carry signals cause a loss of information in the spectral analysis of the hyperspectral images. Here, we implemented a Fourier transform filtering method to remove the artifact.
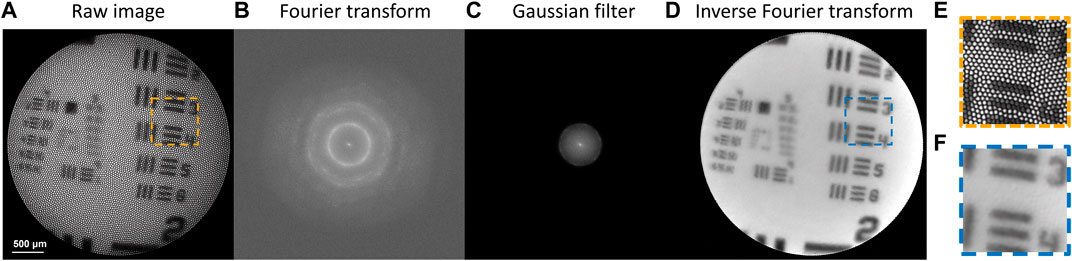
FIGURE 2. Workflow of the fiber core pattern removal algorithm. (A) The raw image with honeycomb-like patterns artifact. (B–D) Workflow of the Fourier transform filtering method. (E,F) Zoom-in images of (A,D), respectively.
Fourier transform filtering is one of the commonly used correction methods [9, 13, 14]. It was first performed on a single spectral channel image where the image was mathematically transformed to its frequency domain through Fourier transform. It computed the two-dimensional discrete Fourier transform F of an image with an m-by-n matrix X based on the fast Fourier transform algorithm:
where i is the imaginary unit, p and j are indices from 0 to m-1, q and k are indices from 0 to n-1. It was followed by shifting the zero-frequency components in F to the center of the Fourier spectrum, yielding a zero-frequency-shifted Fourier transform F′. The result is shown in Figure 2B. The Fourier spectrum F′ was then multiplied by a Gaussian filter G that was of the same size to suppress the fiber core patterns as well as smooth the data in the spatial domain. The Gaussian filter acted as a low-pass filter, and it was derived from:
where x and y are the distances from the spectrum origin in the horizontal and vertical axes, respectively, and σ is the variable parameter that determines the efficiency of the Gaussian filter in suppressing the fiber core patterns. The result is shown in Figure 2C. After filtering, the product of F′ and G was rearranged back to the original transform position followed by a two-dimensional discrete inverse Fourier transform to obtain the filtered image X′ in the spatial domain. The discrete inverse Fourier transformed is defined by:
The processed image is shown in Figures 2A, D zoom-in image is shown in Figure 2F. Comparing Figures 2E, F, the method resolves the spatial features of an image well. For hyperspectral images, the correction step must be performed for all the spectral bands. This may be time-consuming, but selecting only the most informative bands may help improve the processing speed.
Spectral unmixing is an algorithm that studies the spectrum of a sample containing multiple material classes by decomposing the overall spectrum into the set of its endmembers and their abundances [15]. For hyperspectral imaging, spectral unmixing can be applied for each pixel where multiple material classes are present. Eq. 4 describes a linear spectral unmixing model where the assumption that different material classes do not interact with each other applies:
where
Spectral angle mapper (SAM) is another classification technique that uses an n-D angle to match each pixel of a hyperspectral image to a reference spectral library. The spectral similarity between the sample spectrum and the reference spectrum was represented by the angle between them and treating them as vectors in a space with dimensionality equals to the number of spectral bands. The spectral angle distance, or SAM score, can be expressed in the following formula [16]:
where
In this section, we demonstrated the capabilities of our system using two samples. Firstly, the quantum dot samples were used as a validation of the system performance and the fiber core pattern artifact removal method because their fluorescent properties were well characterized by the manufacturer. Subsequently, genetically modified E. coli mixture samples were imaged, and the classification results were discussed using the developed GUI. Finally, the system was also explored for monitoring the bacteria growth remotely over time.
Quantum dots (QD) are one of the commonly used fluorophores for multiplexed fluorescent imaging applications. However, conventional fluorescent microscopy systems cannot image multiple quantum dots at one go because each type of quantum dot has a unique emission spectrum, so different filter sets are required and crosstalk in signals may exist. Here, we demonstrated imaging of individual quantum dot samples and quantum dot mixtures (Supplementary Material) using the hyperspectral imaging approach. Quantum dot conjugates (Invitrogen, Thermo Fisher Scientific) were excited with a single excitation light source at 375 nm with a power setting of 90% (1,143 mW) and a constant exposure time of 170 ms. Figures 3A, B are the reconstructed full-color images of Qdot 585 (QD585) and Qdot 705 (QD705) samples, respectively, after the removal of the core artifacts. The extracted emission spectra from Figures 3A, B are shown in Figure 3C. The mean values are plotted as solid lines. The standard deviations are plotted as shaded regions. The manufacturer-provided data is shown in Figure 3D. Our measured results match with the standard well, which shows that our discussed Fourier transform filtering method is able to remove the fiber core pattern artifact and improve the spatial resolution while maintaining the spectral features for fluorescent imaging applications.
FIGURE 3. Hyperspectral imaging of quantum dot samples. (A) Reconstructed full-color image of QD585 after removal of core artifacts. (B) Reconstructed full-color image of QD705 after removal of core artifacts. (C) Measured emission spectra of QD585 and QD705 samples. The mean values are plotted as solid lines. The standard deviations are plotted as shaded regions. (D) Manufacturer-provided measurement reference.
Three strips of different genetically modified E. coli bacteria were cultured on an agar substrate in a petri dish, labeled “R”, “Y”, and “F”, respectively. The samples were prepared by Dynacyte Biosciences Pte Ltd. Figure 4 are photographs of the samples on Day 0, Day 1, Day 3, and Day 5. The strips were arranged in a triangle shape. The overlapped regions contain a mixture of two types of E. coli bacteria. The “R”, “Y”, and “RY” mixed regions were used to perform the classification using the developed GUI. The “F” strip showed the strongest fluorescence signal, so it was used to study the bacteria growth.
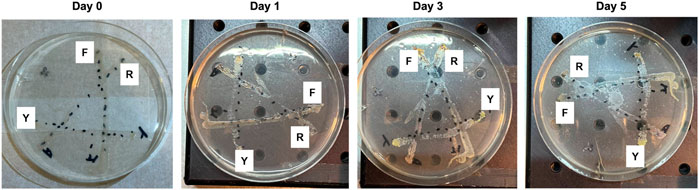
FIGURE 4. Photographs of bacteria samples in a petri dish on Day 0, Day 1, Day 3, and Day 5.
The results in this section will be presented using the GUI to demonstrate its functions. The GUI was developed using the MATLAB App Designer (Mathworks®). The access link and an introductory video can be found in Supplementary Material. The data was from experiments conducted on Day 5. The lamp intensity was 60% (762 mW) and the exposure time was 500 ms. The various sections in the GUI are shown in Figure 5. The left panel asks for user input. The right panel displays the processed results. It can be used for any type of imaging fiber in general.
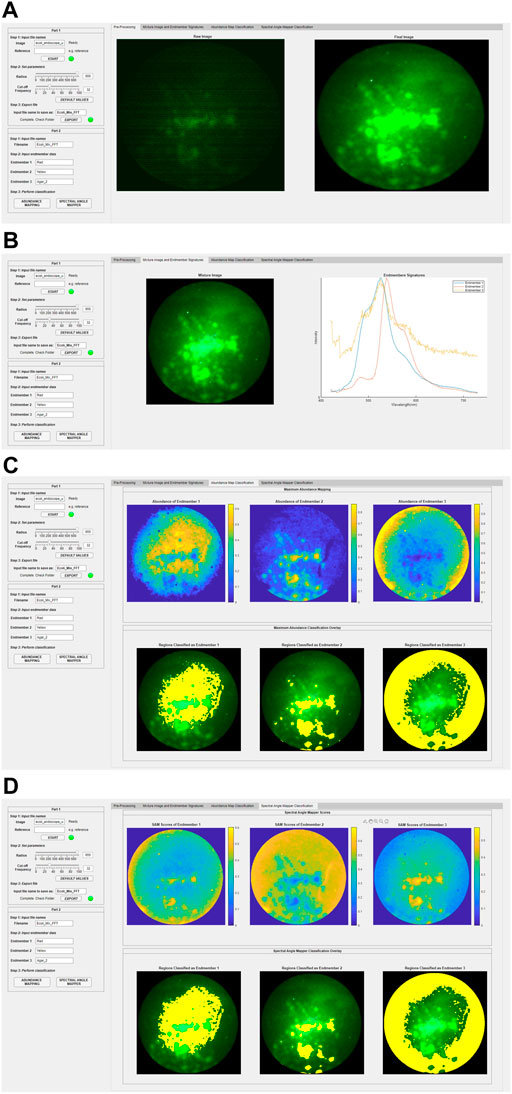
FIGURE 5. GUI design and results. Left panel is for user inputs. Right panel is for displaying results. (A) Pre-processing results. (B) Reconstructed full-color images of the mixture and endmember spectral signatures. (C) Classification based on abundance calculations. (D) Classification based on spectral angle mapper scores.
Part 1: Figure 5A is a screenshot of the pre-processing step. In Step 1, the user is asked to input raw hyperspectral image datacube for the sample and the reference where the reference is a white standard with close to 100% reflectance across the wavelength range. It will perform a pixel-by-pixel division of the sample and reference data so that the new datacube represents the reflectance of the sample. Note that a reference is not necessary for fluorescent measurements because a white standard is not applicable. The “Raw Image” will be displayed on the right panel which shows the full-color reconstructed image. In Step 2, the fiber core pattern artifact removal using the Fourier transform filtering method will be performed. A radius value can be adjusted to select the best region of interest of the image and the region outside will be masked black; a cut-off frequency value can be adjusted to apply the Gaussian filter specified in Figure 2C. Default values are provided as a good starting point. The “Final Image” will be displayed on the right panel. In Step 3, the processed datacube can be exported.
Part 2: Figures 5B–D are screenshots for performing the classification using the processed datacube. In Step 1, the user is asked to input the processed datacube for the mixture image (i.e., mixed “YR” region). In Step 2, the user is asked to input the endmember signatures which are the spectral reference library consisting of the spectrum of each known endmember. This reference library can be from user-measured data or manufacturer-provided data. In this case, there are three endmembers, namely “R” bacteria, “Y” bacteria, and agar. The results are displayed on the right panel, as shown in Figure 5B. Note that the endmember spectra were obtained from the pure “R” region, the pure “Y” region, and the pure agar region. In Step 3, image classification of the mixed region into its endmembers for each pixel is performed. There are two options, one is based on the maximum abundance obtained from the spectral unmixing results and the other is based on the spectral similarity obtained from the spectral angle mapper scores. These methods are discussed in Section 2.3.1 and Section 2.3.2, respectively. Figure 5C displays the results from the maximum abundance classification calculations based on the fully constrained least-square (FCLS) method [17]. An abundance map is obtained for each endmember. The abundance of the endmember at each pixel in the mixture image is color-coded according to the color bar, taking a value between 0 and 1. The greater the value, the more abundance. This gives a clear picture of the spatial distribution of each endmember. Classification is then performed based on the maximum abundance where each pixel is classified as one endmember if it has the maximum abundance value among all the endmembers at that pixel. The classification results are overlaid on the original mixture image and are highlighted in yellow. Note that there is no color bar for the classification overlay because the yellow highlight only shows the presence of the endmember with the maximum abundance at that pixel; it does not represent the abundance value itself. It is seen that most central areas are classified as “R” and “Y” bacteria and the peripheral areas are classified as the agar substrate. Figure 5D displays the results from the spectral matching calculations. A SAM score map is obtained for each endmember. The SAM score of the endmember at each pixel in the mixture image is color-coded according to the color bar, taking a value between 0 and 1. The smaller the value, the more similar the spectrum to the endmember signature. The SAM score maps are a good representation of the spatial distribution of each endmember. Classification is performed based on the minimum SAM score among all the endmembers at that pixel. The classification results are overlaid on the original mixture image and are highlighted in yellow. The results are similar to those obtained using the maximum abundance calculations, which shows that our entire workflow and the GUI display work correctly.
Another experiment was conducted to monitor the growth of the “F” type bacteria over 5 days. The illumination conditions, such as the lamp intensity and the exposure time, were set up in a way such that the maximum of the histograms on different days were the same. Because the bacteria were growing over the days, the fluorescent signals were getting stronger and less incident light power was required to achieve the same fluorescent intensity. The lamp intensities were set to be 90% (1,143 mW), 45% (571.5 mW), and 16% (203.2 mW) on Day 1, Day 3, and Day 5, respectively, and the exposure time was kept constant at 500 ms throughout. Figures 6A–C show the reconstructed full-color images of the bacteria on Day 1, Day 3, and Day 5, respectively. The spatial distribution of the bacteria colonies was elucidated. The extracted spectra after factoring in the different lamp intensities are plotted in Figure 6D. The peak intensity increases over the days which likely corresponds to the exponential (log) phase of the bacteria growth curve where the metabolic activities of the bacteria population are high.
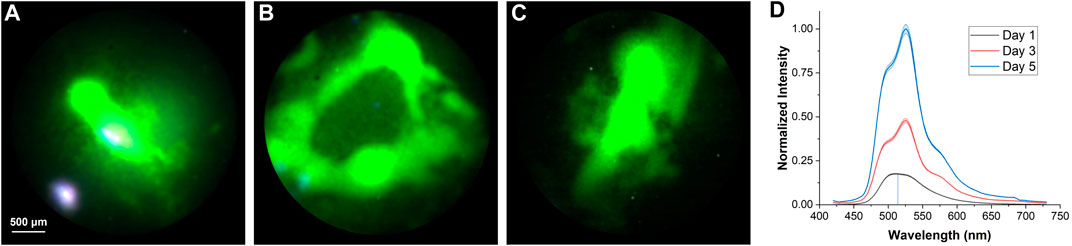
FIGURE 6. Hyperspectral imaging of “F” type bacteria samples over the days. Reconstructed full-color image on (A) Day 1, (B) Day 3, and (C) Day 5, respectively. (D) Extracted spectra from (A–C).
Fluorescent imaging based on fiber bundles may suffer from poor spatial resolution caused by the fiber core pattern artifact and a limited selection of fluorescent filter sets. In this paper, we showed the use of the Fourier transform filtering method to remove the fiber core pattern artifact and the use of a liquid crystal tunable filter to freely and precisely select a detection wavelength and obtain images in 311 spectral channels. The hyperspectral imaging feature allows the detection of multiple fluorescent samples in a mixture in one go with minimal crosstalk. Hyperspectral image processing such as spectral unmixing classification and spectral angular mapper classification were discussed to decode the spatial and spectral information of the mixed image into its individual material class. This image processing workflow improves the spatial resolution and elucidates the spatial distribution of each material class in a mixed environment with minimal computational resources. However, the limitations are that the Fourier transform filtering method performs the best for periodic structures, and the two classification methods discussed perform the best for a well-defined spectral library, i.e., one-to-one correspondence between the spectrum and material class. Otherwise, machine learning or deep learning classification could be explored, but it will require more computational resources and may be time-consuming. For experimental demonstration, firstly, two types of quantum dot samples with different spectral peaks were characterized and processed with the fiber core pattern removal method and benchmarked with manufacturer-provided data to validate the system performance. Next, a mixture of two types of genetically modified E. coli bacteria was imaged. The data was analyzed using a simple-to-use GUI which includes all the analysis steps from data input, to pre-processing for the fiber core pattern removal, and to classification results based on maximum abundance and minimum SAM score. It was shown that the GUI could successfully process the images and display the classification results. Lastly, the system was used for monitoring bacteria growth in a remote setting. Since the imaging fiber probe described here is ultrathin, it can be used for small animal in vivo experiments and can fit into the accessory channels of any general medical endoscopes for medical diagnosis and surgical guidance in the future. Future work could investigate the integration of the light source and the imaging probe in a compact size, the co-registration of HSI images with white light images to minimize the motion artifact as well as the selection of the most informative spectral bands using principal component analysis to improve the speed of image acquisition and processing for in vivo endoscopy experiments.
The raw data supporting the conclusion of this article will be made available by the authors, without undue reservation.
Conceptualization, SZ; methodology, experiments, analysis, SZ, JJC, WT, JYC, and XL; writing, SZ, JJC, and JYC; supervision, MO. All authors have read and agreed to the published version of the manuscript.
This research was funded by A∗STAR Career Development Award (202D800042) and BMRC Central Research Fund (CRF, UIBR) Award.
The authors thank Dynacyte Biosciences Pte. Ltd. for providing genetically modified E. coli bacteria samples and Ryan Ron Zee Tan for creating the GUI. The authors declare that this study received contribution from Dynacyte Biosciences Pte Ltd. The company was not involved in the study design, collection, analysis, interpretation of data, the writing of this article or the decision to submit it for publication.
The authors declare that the research was conducted in the absence of any commercial or financial relationships that could be construed as a potential conflict of interest.
All claims expressed in this article are solely those of the authors and do not necessarily represent those of their affiliated organizations, or those of the publisher, the editors and the reviewers. Any product that may be evaluated in this article, or claim that may be made by its manufacturer, is not guaranteed or endorsed by the publisher.
The Supplementary Material for this article can be found online at: https://www.frontiersin.org/articles/10.3389/fphy.2022.1096290/full#supplementary-material
1. Lichtman JW, Conchello J-A. Fluorescence microscopy. Nat Methods (2005) 2:910–9. doi:10.1038/nmeth817
2. Kuroiwa H, Inagaki Y, Mutoh K, Abe J. On-demand control of the photochromic properties of naphthopyrans. Adv Mater (2019) 31:1805661. doi:10.1002/adma.201805661
3. atta R, Heaster TM, Sharick JT, Gillette AA, Skala MC. Fluorescence lifetime imaging microscopy: Fundamentals and advances in instrumentation, analysis, and applications. J Biomed Opt (2020) 25:1. doi:10.1117/1.jbo.25.7.071203
4. Lu G, Fei B. Medical hyperspectral imaging: A review. J Biomed Opt (2014) 19:010901. doi:10.1117/1.jbo.19.1.010901
5. Bae SM, Bae D-J, Do E-J, Oh G, Yoo SW, Lee G-J, et al. Multi-spectral fluorescence imaging of colon dysplasia in vivo using a multi-spectral endoscopy system. Transl Oncol (2019) 12:226–35. doi:10.1016/j.tranon.2018.10.006
6. Kim J, Al Faruque H, Kim S, Kim E, Hwang JY. Multimodal endoscopic system based on multispectral and photometric stereo imaging and analysis. Biomed Opt Express (2019) 10:2289. doi:10.1364/boe.10.002289
7. Yoon J, Joseph J, Waterhouse DJ, Luthman AS, Gordon GSD, di Pietro M, et al. A clinically translatable hyperspectral endoscopy (HySE) system for imaging the gastrointestinal tract. Nat Commun (2019) 10:1902. doi:10.1038/s41467-019-09484-4
8. Martin ME, Wabuyele MB, Chen K, Kasili P, Panjehpour M, Phan M, et al. Development of an advanced hyperspectral imaging (HSI) system with applications for cancer detection. Ann Biomed Eng (2006) 34:1061–8. doi:10.1007/s10439-006-9121-9
9. Regeling B, Thies B, Gerstner A, Westermann S, Müller N, Bendix J, et al. Hyperspectral imaging using flexible endoscopy for laryngeal cancer detection. Sensors (2016) 16:1288. doi:10.3390/s16081288
10. Wang P, Turcatel G, Arnesano C, Warburton D, Fraser SE, Cutrale F. Fiber pattern removal and image reconstruction method for snapshot mosaic hyperspectral endoscopic images. Biomed Opt Express (2018) 9:780. doi:10.1364/boe.9.000780
11. Park SY, Singh-Moon RP, Wan EY, Hendon CP. Towards real-time multispectral endoscopic imaging for cardiac lesion quality assessment. Biomed Opt Express (2019) 10:2829. doi:10.1364/boe.10.002829
12. Zhang S, Xin Cheng JY, Chua JJ, Li X, Olivo M. Dual-modality hyperspectral microscopy for transmission and fluorescence imaging. Opt Contin (2022) 1 (11):2404. doi:10.1364/OPTCON.469040
13. Han J-H, Lee J, Kang JU. Pixelation effect removal from fiber bundle probe based optical coherence tomography imaging. Opt Express (2010) 18:7427. doi:10.1364/oe.18.007427
14. Winter C, Rupp S, Elter M, Munzenmayer C, Gerhauser H, Wittenberg T. Automatic adaptive enhancement for images obtained with fiberscopic endoscopes. IEEE Trans Biomed Eng (2006) 53:2035–46. doi:10.1109/tbme.2006.877110
15. Keshava N, Mustard JF. Spectral unmixing. IEEE Signal Process Mag (2002) 19:44–57. doi:10.1109/79.974727
16. Kruse FA, Lefkoff AB, Boardman JW, Heidebrecht KB, Shapiro AT, Barloon PJ, et al. The spectral image processing system (SIPS)—Interactive visualization and analysis of imaging spectrometer data. Remote Sens Environ (1993) 44:145–63. doi:10.1016/0034-4257(93)90013-n
Keywords: fiber sensor, hyperspectral imaging, fluorescent imaging, spectral unmixing, bioimaging, quantum dots, bacteria, spectral angle mapper
Citation: Zhang S, Chua JJ, Tang WYH, Cheng JYX, Li X and Olivo M (2023) An ultrathin fiber-based fluorescent imaging probe based on hyperspectral imaging. Front. Phys. 10:1096290. doi: 10.3389/fphy.2022.1096290
Received: 11 November 2022; Accepted: 12 December 2022;
Published: 04 January 2023.
Edited by:
Qinggong Tang, University of Oklahoma, United StatesReviewed by:
Zhenyang Ding, Tianjin University, ChinaCopyright © 2023 Zhang, Chua, Tang, Cheng, Li and Olivo. This is an open-access article distributed under the terms of the Creative Commons Attribution License (CC BY). The use, distribution or reproduction in other forums is permitted, provided the original author(s) and the copyright owner(s) are credited and that the original publication in this journal is cited, in accordance with accepted academic practice. No use, distribution or reproduction is permitted which does not comply with these terms.
*Correspondence: Shuyan Zhang, emhhbmdfc2h1eWFuQGliYi5hLXN0YXIuZWR1LnNn; Malini Olivo, bWFsaW5pX29saXZvQGliYi5hLXN0YXIuZWR1LnNn
Disclaimer: All claims expressed in this article are solely those of the authors and do not necessarily represent those of their affiliated organizations, or those of the publisher, the editors and the reviewers. Any product that may be evaluated in this article or claim that may be made by its manufacturer is not guaranteed or endorsed by the publisher.
Research integrity at Frontiers
Learn more about the work of our research integrity team to safeguard the quality of each article we publish.