 Sining Ma1*
 Jie Li2
- 1Fujian Hesheng Zhixin Intelligent Electric Co., Ltd., Quanzhou, China
- 2State Grid Corporation of China Europe Representative Office, Berlin, Germany
With the rapid increase of Electric vehicle (EV) penetration, EV charging network become an important infrastructure. This paper studies the configuration of EV charging network from a safety perspective. It is found that cascading failures may happen if one charging station is out of work and its load has to be redistributed to its neighboring stations. The cascading failure model borrowed from network science area is used in the study, and the results show the effects of system parameters on the network robustness. The results indicate that in order to achieve a good performance, it is better to assign extra load based on neighbors’ degree when a node is overloaded. On the other hand, the extra load redistribution should not consider the distance between the overloaded node and its neighbors.
1 Introduction
Electric vehicle (EV) has received much attention in the past years due to its environment-friendly feature [1]. Indeed, the industrialization all over the world results in wide fossil fuel applications and more and more greenhouse gas emission. Among them, the emission from automotive vehicles becomes one of the main reasons for air pollution, especially in big cities. It was shown that all kinds of transportation uses about 49% of oil consumption [2]. Comparing to the traditional gas-powered vehicles, EVs has higher efficiency which can reduce the dependence on fossil fuel greatly. Due to its advantage, many governments encourage people to change from gas-powered vehicles to EV.
However, the limited battery limits the usage of EV and causes the so-called mileage anxiety. To solve the problem, it is important to develop the charging or swapping infrastructures [3]. Currently, the electric vehicle charging mainly relies on charging facilities located at home or work place. It is also important to develop public EV charging networks, especially for long-range travellers.
There has been quite lots of research on the EV charging technology, mainly focusing on the location and capacity of charging facilities. Some research has been carried out on the planning of electric vehicle charging stations, mainly from the perspective of traffic flow [4, 5] and the temporal and spatial distribution of EV charging load [6–9], and the site selection of EV charging stations. In Ref. [10], from the operator’s point of view, the profits of charging stations are studied and the limitations of the grid are taken into account. Reference [11] used the multi-objective optimization algorithm to minimize the costs due to the investment and operating. Reference [12] gives the planning of charging stations by using an optimization problem with the goal to minimize the total time and cost of charging operations. The proposed model was tested to provide a realistic and flexible bus service in Luxembourg. Reference [13] used the Bayesian game and considered the power grids and transportation networks together. Reference [14] considered the strategic and competitive charging behavior of EV drivers. Reference [15] take into account the service radius of charging stations, and find the optimal location of stations by a two-step screening method. Reference [16] used block chain technology in the EV incentive system.
All the above research assumed that the EV charging network works in a normal status. That is, each and every charging station works effectively. However, since there are many charging stations in the charging network, it is highly possible that one or several charging stations are out of work for some reason. When it happens, the EVs which used to charge in the failed stations have to find other stations to charging. This will enhance the burden of these working stations. If too many EVs are concentrated in one charging station and exceed its capacity, then the EVs have to find other stations again, as the waiting time is too long. This may increase the load of other charging stations. If this cascade effect keeps going, then the whole charging network may be affected. We call it as the cascading failures in EV charging network.
The cascading failures have been well studied in network science. There are different kinds of cascading failure models. The first kind of cascading failures consider the load transmitted from source node to destination node [17–20]. Usually, the transmission follows the shortest path length between source and destination. In this way, a node handles the traffic load not only generated by itself but also transmitted through it due to other source-destination pairs. When a node is attacked or failed, shortest paths which used to go through this node have to change. Then, the traffic load of other nodes will change accordingly. The addition of traffic load on some nodes may exceed their capacities so that the overloaded nodes are out of work. The failure of these nodes will change the load distribution and causes another round of overloading. The process keeps going and cascading failures occur. This cascading failure model is suitable for the transmission process such as the telecommunication or power transfer. The second kind of cascading [21, 22] also considers the load. However, different from the first kind, here the load is more about the burden the node has to afford. Once a node is failed or attacked, its burden will be distributed to its neighbors. That is, the load (or burden) of its neighbors increases. If the load of a node exceeds its capacity, then the overloaded node fails and redistributes its load to its neighbors. The process keeps going and cascading failures occurs. Comparing the first kind of cascading failures, the second kind of cascading failures is local, i.e., a failure of node only influence its neighbors. Instead, in the first kind of cascading failures, the failure of one node may have direct effect on some nodes far away from it. The third kind of cascading failures do not consider the traffic load. Instead, it is based on the structure. For example, Watts [23] proposed a cascading failure model to show the influence from neighbors. In this model, there are two states for nodes, say, 0 or 1. Once more than a pre-defined threshold of its neighbors are at state 1, then this node will be at state 1, otherwise it will be at state 0. At the initial time, a proportion of nodes are set as state 1. Then based on the basic rule, the state of nodes evolves cascadingly. Obviously, there is no load on nodes, and nodes’ states change in a cascading manner. This kind of cascading failures can be used to study how people’s opinion is influenced by acquaintance. Comparing three kinds of cascading failures, obviously the second kind is more suitable for our study.
In this paper, we consider the EV charging network as a complex network and study how the cascading failures affect the network performance. Different from previous study on the cascading failures in complex networks, we not only consider the attributes of node, but also consider the role of link attributes in the load redistribution process.
The rest of this paper is organized as follows. In Section 2 we give the network model and the cascading failure model for EV charging network. In Section 3 the simulation results are shown. Section 4 summarizes the paper.
2 Network model
The EV charging network is modeled as a complex network. In this network, the charging stations are modeled as nodes and the paths between them are modeled as the links. Moreover, each node has a location, and each link has a length. Therefore, this network is a spatial network. To model the network in practice, the most often used model is the random geometric graph (RGG). It is described as follows.
1) Before the generation process, set parameters including the number of node
2)
3) For each node, calculate the distance from it to other nodes. The distance from node
where
4) Repeat step 3 until all nodes are considered.
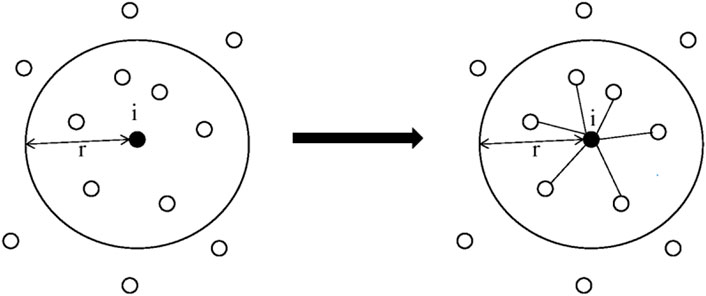
FIGURE 1. Building connections by using RGG model. All nodes within node
From above description, the RGG model is quite simple. However, when using the RGG model, the connection radius
1) Before the generation process, set parameters including the number of node
2)
3) For each node, calculate the distance from it to other nodes. The distance from node
4) Repeat step 3 until all nodes are considered.
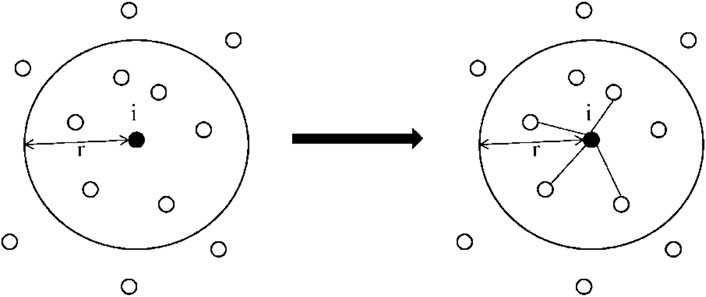
FIGURE 2. Building connections by using IRGG model. Nodes within node
From the above description, the difference between RGG and IRGG is only at the connection probability p. When p = 1, IRGG becomes identical to RGG. Therefore, RGG is a special case of IRGG, and IRGG has higher flexibility to control the number of links by using different value of p.
By using the IRGG model, the information about links is also easily available. Since all the nodes are allocated in a 1 × 1 square, the average number of nodes within node
3 Cascading failures model
In the charging network, the load at charging stations is EVs coming for charging. Without loss of generality, we assume that each EV increases identical load to the station, i.e., the more EVs at a charging station, the higher load this station has to burden. On the other hand, each charging station has a capacity, which limits the number of EVs it can serve (which is the load of station). If too many EVs come at the same time, the station cannot afford such a high load and EVs will prefer to go to other charging stations. Then, the redistribution of load may cause the overloading of other charging station, and finally the cascading failures may occur. This is the case when one charging station is out of work. A robust structure of charging station.
To model the above phenomenon, we build the following cascading failures model.
First, the initial load of node
where
The node capacity is set to be proportional to its initial load, i.e.,
where
When a node
Unfortunately, the above two aspects have different units and it is impossible to combine them directly. To consider them both, we first normalize them.
where
where
As we discussed before, when a node
where
The capacity is the maximal load a node can handle. So after receiving extra load from node
In the above cascading failure process, the selection of initially removed node directly affects the cascading failure scale. In other words,
Since
4 Simulations
4.1 Settings
In our simulation, the IRGG model is used to generate the spatial network. The number of nodes is
4.2 Simulation results
In the cascading failure model, the most important thing is how to redistribute the load when a node is removed. Based on Eq. 7, the load redistribution considers two aspects. One is the degree of neighbor and the other is the distance from the removed node to its neighbor. These two aspects are controlled by tunable parameters
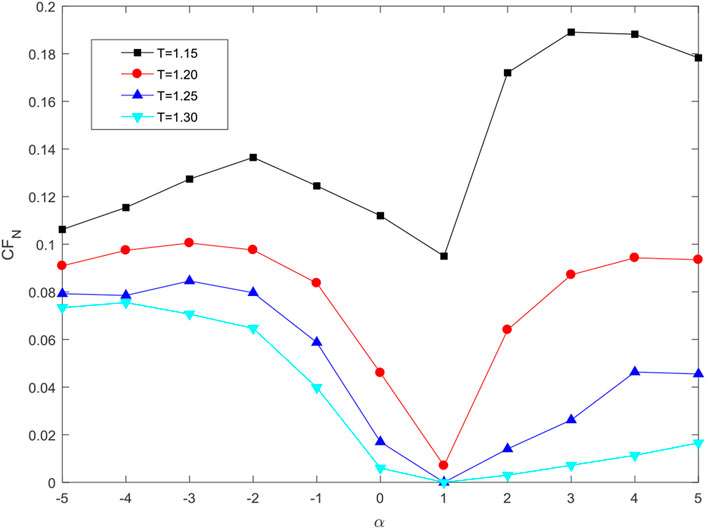
FIGURE 3. Effect of parameter
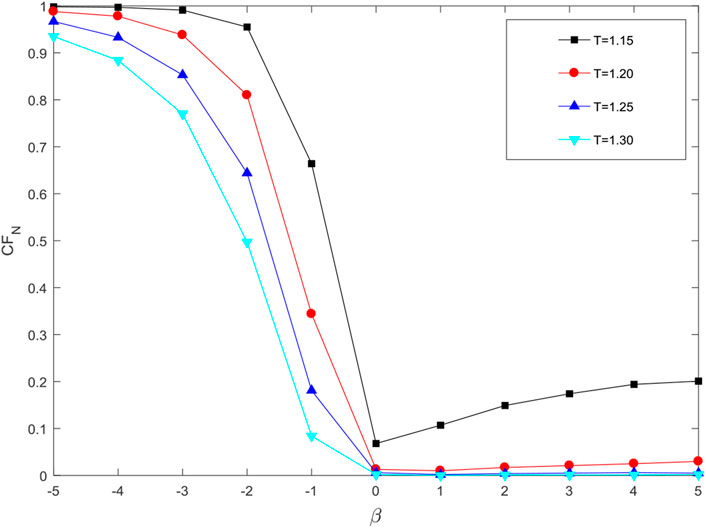
FIGURE 4. Effect of parameter
Next, we show how the redundancy parameter
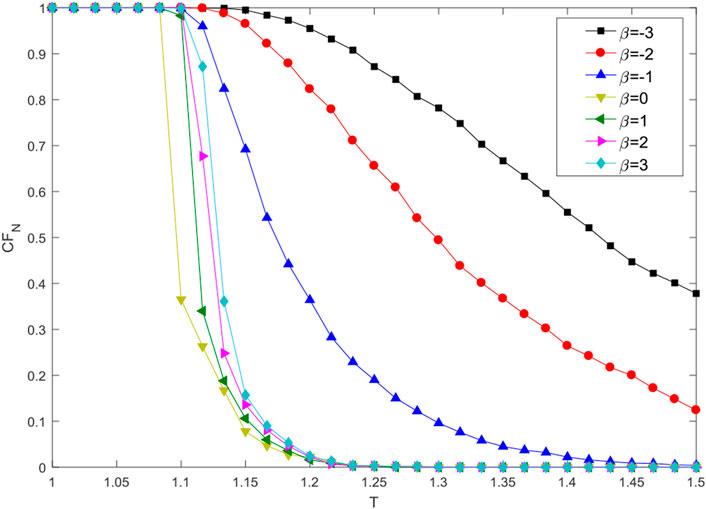
FIGURE 5. Effect of redundancy parameter
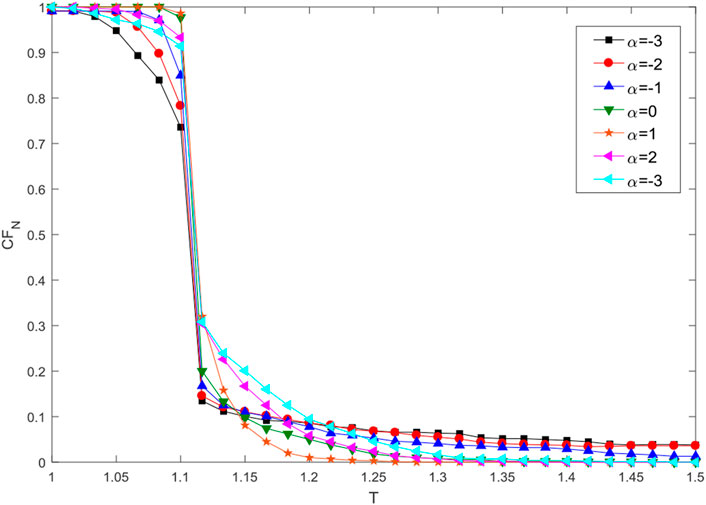
FIGURE 6. Effect of parameter
In Figure 5, when
In Figure 6, the robustness performance drops with redundancy parameter
Finally, we consider the network with different average number of links, and show the robustness performance in Figure 7. It can be seen that the average number of links plays little role in the result. Indeed, when the average number of links is small, an overloaded node will redistribute its load to these small number of neighbors, then each neighbors will receive a relatively high extra load. On the other hand, however, also due to the small average number of links, a node will receive extra load from fewer neighbors. Putting these two aspects together, the total effect is almost the same. That is why the curves in Figure 7 are so closed.
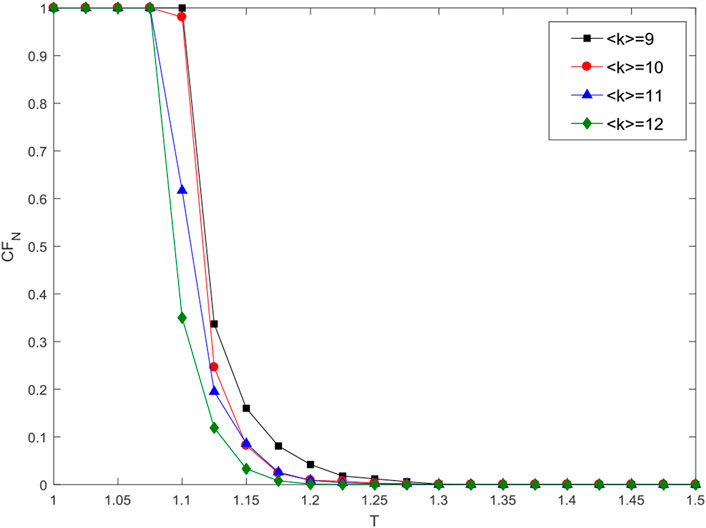
FIGURE 7. Effect of redundancy parameter
5 Conclusion
In summary, this paper studies the robustness of the EV charging network. It is found that the load redistribution rule plays an important role in determine the network robustness. To achieve a good performance, the load should be transmitted to the neighbors based on neighbors’ degree. That is, neighbor with higher degree should receive more extra load and neighbor with lower degree should receive less extra load. On the other hand, to improve the performance, the distance should not be taken into account. Of course, when the load redundancy is large enough, the decision positively related to the distance has little effect on the network robustness.
Data availability statement
The original contributions presented in the study are included in the article/Supplementary Material, further inquiries can be directed to the corresponding author.
Author contributions
The conceptualization, method determination, mathematical modeling, simulation and data validation of this paper were done by SM, and JL participated in the algorithm design, simulation design, data organization and visualization, and report writing. All authors have read and agreed to the published version of this manuscript.
Conflict of interest
Author SM was employed by Fujian Hesheng Zhixin Intelligent Electric Co., Ltd. Author JL was employed by State Grid Corporation of China Europe Representative Office.
Publisher’s note
All claims expressed in this article are solely those of the authors and do not necessarily represent those of their affiliated organizations, or those of the publisher, the editors and the reviewers. Any product that may be evaluated in this article, or claim that may be made by its manufacturer, is not guaranteed or endorsed by the publisher.
References
1. Yong JY, Ramachandaramurthy VK, Tan KM, Mithulananthan N. A review on the state-of-the-art technologies of electric vehicle, its impacts and prospects. Renew Sustain Energ Rev (2015) 49:365–85. doi:10.1016/j.rser.2015.04.130
2. Ding N, Prasad K, Lie TT. The electric vehicle: A review. Int J Electric Hybrid Vehicles (2017) 9:49–66. doi:10.1504/ijehv.2017.082816
3. Chen X, Xing K, Ni F, Wu Y, Xia Y. An electric vehicle battery-swapping system: Concept, architectures, and implementations. IEEE Intell Transport Syst Mag (2022) 14:175–94. doi:10.1109/mits.2021.3119935
4. Sun Z, Zhou X, Du J, Liu X. When traffic flow meets power flow: On charging station deployment with budget constraints. IEEE Trans Veh Technol (2017) 66:2915–26. doi:10.1109/tvt.2016.2593712
5. Erdogan S, Capar I, Capar I, Nejad MM. Establishing a statewide electric vehicle charging station network in Maryland: A corridor-based station location problem. Socio-Economic Plann Sci (2022) 79:101127. doi:10.1016/j.seps.2021.101127
6. Yi T, Zhang C, Lin T, Liu J. Research on the spatial-temporal distribution of electric vehicle charging load demand: A case study in China. J Clean Prod (2020) 242:118457. doi:10.1016/j.jclepro.2019.118457
7. Ge X, Shi L, Fu Y, Muyeen SM, Zhang Z, He H. Data-driven spatial-temporal prediction of electric vehicle load profile considering charging behavior. Electric Power Syst Res (2020) 187:106469. doi:10.1016/j.epsr.2020.106469
8. Xiang Y, Jiang Z, Gu C, Teng F, Wei X, Wang Y. Electric vehicle charging in smart grid: A spatial-temporal simulation method. Energy (2019) 189:116221. doi:10.1016/j.energy.2019.116221
9. Chen X, Wang H, Wu F, Wu Y, Gonzlez MC, Zhang J. Multimicrogrid load balancing through EV charging networks. IEEE Internet Things J (2022) 9:5019–26. doi:10.1109/jiot.2021.3108698
10. Zhang Y, Chen J, Cai L, Pan J. EV charging network design with transportation and power grid constraints. In: Proceedings of the IEEE conference on computer communications. Honolulu, HI, USA (2018). p. 249215–50019.
11. Wang S, Dong ZY, Luo F, Meng K, Zhang Y. Stochastic collaborative planning of electric vehicle charging stations and power distribution system. IEEE Trans Industr Inform (2018) 14:321–31. doi:10.1109/tii.2017.2662711
12. Ma TY, Xie S. Optimal fast charging station locations for electric ridesharing with vehicle-charging station assignment. Transportation Res D: Transport Environ (2021) 90:102682. doi:10.1016/j.trd.2020.102682
13. Luo C, Huang Y, Gupta V. Placement of ev charging stations—Balancing benefits among multiple entities. IEEE Trans Smart Grid (2017) 8:759–68.
14. Xiong Y, Gan J, An B, Miao C, Bazzan ALC. Optimal electric vehicle fast charging station placement based on game theoretical framework. IEEE Trans Intell Transp Syst (2018) 19:2493–504. doi:10.1109/tits.2017.2754382
15. Liu Z, Wen F, Gerard L. Optimal planning of electric-vehicle charging stations in distribution systems. IEEE Trans Power Deliv (2013) 28:102–10. doi:10.1109/tpwrd.2012.2223489
16. Chen X, Zhang T, Ye W, Wang Z, Iu HHC. Blockchain-based electric vehicle incentive system for renewable energy consumption. IEEE Trans Circuits Syst (2021) 68:396–400. doi:10.1109/tcsii.2020.2996161
17. Motter AE, Lai Y-C. Cascade-based attacks on complex networks. Phys Rev E (2002) 66:065102. doi:10.1103/physreve.66.065102
18. Crucitti P, Latora V, Marchiori M. Model for cascading failures in complex networks. Phys Rev E (2004) 69:045104. doi:10.1103/physreve.69.045104
19. Schäfer B, Witthaut D, Timme M, Latora V. Dynamically induced cascading failures in power grids. Nat Commun (2018) 9:1975. doi:10.1038/s41467-018-04287-5
20. Xia Y, Wang C, Shen H-L, Song H. Cascading failures in spatial complex networks. Physica A: Stat Mech its Appl (2020) 559:125071. doi:10.1016/j.physa.2020.125071
21. Wang J-W, Rong L-L. Cascade-based attack vulnerability on the US power grid. Saf Sci (2009) 47:1332–6. doi:10.1016/j.ssci.2009.02.002
22. Jin Z, Duan D, Wang N. Cascading failure of complex networks based on load redistribution and epidemic process. Physica A: Stat Mech its Appl (2022) 606:128041. doi:10.1016/j.physa.2022.128041
23. Watts DJ. A simple model of global cascades on random networks. Proc Natl Acad Sci U S A (2002) 99:5766–71. doi:10.1073/pnas.082090499
24. Lin H, Xia Y, Liang Y. Efficient routing for spatial networks. Chaos (2022) 32:053110. doi:10.1063/5.0091976
Keywords: EV charging network, cascading failures, spatial network, robustness, electric vehicle (EV)
Citation: Ma S and Li J (2022) Cascading failures in EV charging network. Front. Phys. 10:1087410. doi: 10.3389/fphy.2022.1087410
Received: 02 November 2022; Accepted: 16 November 2022;
Published: 29 November 2022.
Edited by:
Yongxiang Xia, Hangzhou Dianzi University, ChinaReviewed by:
Cunlai Pu, Nanjing University of Science and Technology, ChinaJiajing Wu, Sun Yat-sen University, China
Copyright © 2022 Ma and Li. This is an open-access article distributed under the terms of the Creative Commons Attribution License (CC BY). The use, distribution or reproduction in other forums is permitted, provided the original author(s) and the copyright owner(s) are credited and that the original publication in this journal is cited, in accordance with accepted academic practice. No use, distribution or reproduction is permitted which does not comply with these terms.
*Correspondence: Sining Ma, bWFzaW5pbmdAc2dlcHJpLnNnY2MuY29tLmNu