 Valeriano S. Álvarez Salazar1
 Leonardo Di G. Sigalotti2*
 Abraham Medina Ovando3
 Ignacio Carvajal-Mariscal4
 Jaime Klapp5
- 1Departamento de Energía, Universidad Autónoma Metropolitana—Azcapotzalco (UAM-A), Mexico City, Mexico
- 2Departamento de Ciencias Básicas, Universidad Autónoma Metropolita—Azcapotzalco (UAM-A), Mexico City, Mexico
- 3ESIME-Azcapotzalco Instituto Politécnico Nacional (IPN), Mexico City, Mexico
- 4ESIME UPALM Instituto Politécnico Nacional (IPN), Mexico City, Mexico
- 5Departamento de Física, Instituto Nacional de Investigaciones Nucleares (ININ), La Marquesa, Ocoyoacac, Estado de México, Mexico
In this paper we report experiments on the growth of dry foams and their rise in vertical pipes of different circular cross-sectional radii with length over diameter ratios in the interval 25 ≤ h/D ≤ 80 for applications in the study of fracture stimulation in enhanced oil recovery processes. Air injection at the bottom of the pipes is performed at a constant flow rate by means of a single capillary tube. The formation and rising of the foam was investigated for two different cases: 1) when the top cap of the vertical pipes is open and 2) when it is closed. We find that the position and velocity of the foam front as well as the foam dispersivity are both dependent on the pipe diameter and on whether its top end is open or capped. When the top is open, the foam column grows faster compared to the case when it is sealed. In pipes with h/D ≥ 30, the growth rate is non-linear and faster than in pipes with h/D < 30 in which cases the foam rises at an almost constant rate. As the diameter of the pipe increases, the size of the produced bubbles also increases. In closed-top pipes the foams tend to be more homogeneous than in open top pipes. The experimental observations indicate that under foam drainage driven by gravity, the liquid flow velocity across the Plateau borders is indicative of a drainage model based on a plug-like flow in channels with fully mobile interfaces, where viscous dissipation occurs only in the nodes.
1 Introduction
Foams have long been of great practical interest because of their recurrent widespread occurrence in everyday life. Since long time they have been used for many different purposes in a wide range of applications. For example, applications in the oil industry involve the use of foams during oil well drilling, cementing, fracturing, reservoir injection, and enhanced oil recovery processes, just to mention a few [1, 2]. In everyday experience foams are encountered in foods, detergency, personal care products, process industry, and in many other instances as, for example, in fire extinguishers, fumigants, herbicide blankets, and explosion suppressing blankets [1]. Due to its rheological properties foams can be combined with fluids and solids to produce low densities and high viscosities [2, 3].
Aqueous foams are known to be metastable, two-phase systems composed of gas bubbles (or cells) enclosed by thin liquid films [3]. Most typical foams formed by shaking or nucleation are in general disordered in the sense that they are characterized by randomly distributed bubbles of different sizes. These foams can also be thought of as a special type of colloidal dispersion, i.e., a two-fluid system where the gas phase is dispersed in a continuous liquid phase. In most foams of practical and industrial interest the gas phase is typically made of air, nitrogen, carbon dioxide, and hydrocarbons, among other compounds, while the liquid phase usually consists of water and a surface active agent, commonly referred to as the surfactant. Surfactants are important because they increase the lifetime of a foam. For instance, the presence of these surface active molecules at the gas-liquid interfaces lowers the surface tension of the liquid, thereby enhancing the film stability in pre-existing foams [4]. Hence, the presence of a surfactant in the liquid phase is responsible for the very existence of foams and therefore to its desirable or undesirable persistence [5]. An example of desirable foams are those produced in oil reservoirs to increase the viscosity and improve the volumetric sweep efficiency in oil recovery processes. However, these foams become undesirable because once produced they persist without collapsing.
In dry foams the thin liquid films that separate the bubbles are usually flat and are commonly referred to as lamellas. In addition to containing little liquid, dry foams are characterized by gas cells of polyhedral shapes separated by thin lamellas, which resemble quasi-regular dodecahedra. In dry foams three lamellas meet symmetrically in a line at angles of 120° and the lines of intersection of three lamellas are called Plateau borders. In actual three-dimensional foams, four of these Plateau borders meet at one corner forming tetrahedral angles. If a lamella is nearly flat and its borders are nearly straight, then the angles between converging borders in a corner are approximately equal to arccos (−1/3) ≈ 109.5° [6]. On the other hand, pneumatic foams are produced when a gas-liquid foam continuously rises up a vertical column due to gas bubbles be sparged at the bottom by gas injection through a single capillary or a set of capillaries, or even through a porous diffuser stone [4]. During foam formation through pneumatic injection, the foam height (or equivalently its volume) and its rate of ascent in confining pipes are in general measurable quantities of interest while the gas continues to be injected and produce bubbles [4].
In this work, a set of experiments was designed to investigate the rise of a foam column in thin vertical pipes of different circular cross-sectional radii with length over diameter ratios in the interval 25 ≤ h/D ≤ 80 for applications to enhanced oil recovery in naturally fractured reservoirs. Such long and thin tubes should ideally mimic a reservoir fracture [7, 8]. While the present experiments deal with the case where h/D ≫ 1, which is more relevant in the petroleum industry, a generalization of the results for h/D = 1 and h/D ≪ 1 will be the subject of a forthcoming paper in this line of experimental research. For example, it would be interesting to see whether h/D = 1 may represent a threshold value for some foam property. In the present experiments foam production was generated pneumatically using the method of gas injection through a single capillary immersed in an aqueous solution at the bottom of the vertical pipes. This procedure is particularly attractive because it allows fine control on the bubble size uniformity, which is typical of foams formed from single capillary tubes [9, 10]. In contrast, when the bubbles emerge from either a set of capillary tubes or a porous frit, foams of polydisperse bubble sizes are produced even when the gas flow rate is kept constant. The size polydispersity arises because emerging bubbles coalesce during their growth [11]. The experiments are aimed at studying the effects of varying the pipe diameter on the foam as it grows in open and closed-top vertical pipes through pneumatic air injection with a single capillary tube.
The paper is organized as follows. Section 2 provides a description of the foam parameters that can be measured. The experimental setup is described in Section 3 and the results of the experiments are presented in Section 4. In particular, the results of the experiments indicate that the velocity at which the foam front rises along the vertical pipe and the foam dispersivity both depend on the pipe diameter and on whether the pipe top is open or closed. Finally, Section 5 summarizes the main conclusions.
2 Measurable foam properties
An important parameter that affects the foam rheology is the foam dispersivity, which is a measure of the average bubble size. However, this is a qualitative rather than a quantitative foam property. Therefore, foam dispersivity cannot be assigned a simple number, but rather it has to be described in physical terms. Among the factors that can affect the dispersivity of foams are the composition and pressure. The static stability of a foam is its ability to resist the breakdown of bubbles as a result of their collapse or coalescence. The gravity and capillary draining of liquid across the Plateau borders (or channels), where three lamellas meet, result in an increased quality above 92% and may cause foam instability [1, 12]. Foam quality is defined as the volume fraction of gas in the whole foam and is expressed in percent as
where Vg is the gas volume and Vl is the liquid volume. The volume fraction of gas is generally very high in dry foams as opposed to wet foams, which are representative of low-quality foams, i.e., foams with lower gas fractions. For example, foams with a quality lower than 60% are considered to be low-quality foams since they behave similarly to bubbles dispersed in a liquid phase that do not significantly interact with each other during the flow. On the other hand, foams with a quality value higher than 92% are considered to be of high quality. These foams tend to convert themselves into a mist flow where the liquid is the disperse phase and the gas is the continuous phase.
The amount of liquid contained in a foam is defined by the liquid volume fraction, ϕl = 1 − ϕg. Depending on the value of ϕl, different types of foam structure can be obtained. For example, if
The steady-state height of the foam column as a function of the bubble velocity is determined by applying proper boundary conditions for the liquid fraction at the bottom (z = 0) and top (z = h) of the foam column. As shown in Figure 1, hl is the height of the aqueous solution at the bottom of the pipe and hf = h−hl, where h is the height of the pipe. Here, hf is used to mean the height of the foam front, which becomes equal to h when hl = 0. If the bubbles at the bottom of the column are in contact with a pool of liquid, their packing will resemble that of a dense packing of hard spheres, and therefore the liquid fraction at the bottom is set to ϕ(z = 0) = ϕ0 ≈ 0.36 and at the top to ϕ(z = h) = ϕh, where ϕh is a finite critical liquid fraction below which the films collapse [16]. This value must be determined by experimental observation. By pneumatic injection from the bottom of the vertical pipe, the structure of the forming foam depends on the specific variant of the Bikerman’s experimental setup employed [17]. In the Bikerman test [4], gas is injected at a constant flow rate, Q, and the growing foam is collected in a vessel. The maximum height achieved by the foam column depends on Q. As was mentioned above, here we shall use a single capillary tube for foam generation in vertical pipes with length over diameter ratios in the interval 25 ≤ h/D ≤ 80, as shown in the last column of Table 1, in order to control the uniformity of bubble sizes. It has been demonstrated that if the ratio of the diameter of the pipe (containing the liquid) over the diameter of the capillary tube (through which the gas is injected) is large, then the effects of the wall on the shape and size of the emerging bubbles is almost negligible [18]. In this context, an important parameter to characterize the foam formation is the so-called Bikerman’s unit of foaminess, which is defined by the relation
where Σ has units of time [16]. This parameter is equal to the time an average bubble exists in the foam before bursting.
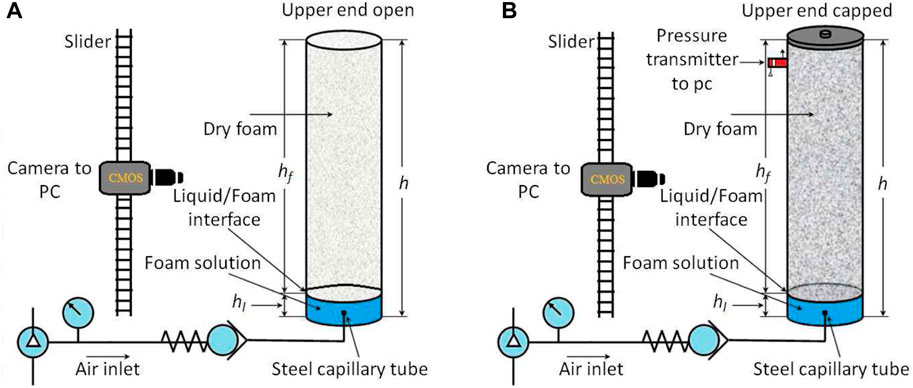
FIGURE 1. Schematic drawing of the experimental rig. (A) Open top pipe and (B) closed-top pipe. The gray region above the liquid film of height hl = 10 cm in both vertical pipes indicates the presence of foam.
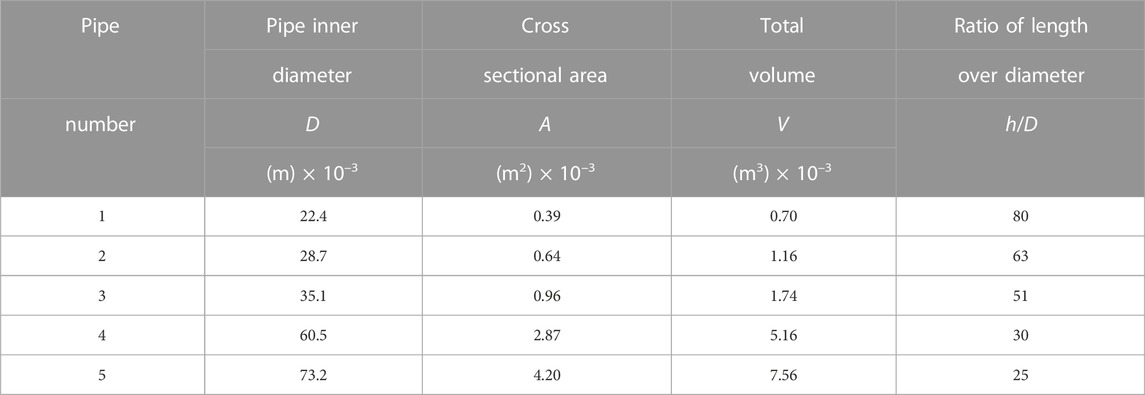
TABLE 1. Dimensions of the vertical pipes.
3 Experimental setup
In this work a set of experiments was designed to investigate the growth of foam columns by pneumatic injection of air into an aqueous film placed at the bottom of a vertical pipe. Figure 1 shows a schematic drawing of the experimental setup.
All pipes are made of 3 mm thick transparent Plexiglas acrylic. They have a height h = 1.8 m and varying inner diameters as shown in Table 1. Air is injected from below with the aid of a compressor connected to a capillary tube located at the bottom of the pipe and immersed in a film of aqueous solution of height hl = 10 cm. This height was taken to be the same for all pipes. The capillary tube is made of stainless steel and has a nominal inner diameter of 2.0 × 10⁻⁴ m. Air is injected at a constant pressure, p = 68.65 kPa, and volumetric flow rate, Q = 1.58 m3 h−1. We consider vertical pipes with five different inner diameters varying from D = 22.2 mm to 73.2 mm (see Table 1). For each pipe diameter the experiments are performed using pipes with open (see Figure 1A) and closed (see Figure 1B) tops. In the latter cases, a hermetic lid is used to close the top of the pipes. In both cases, the height of the foam front, hf, increases continuously during foam generation, while the height of the initial liquid film at the bottom of the pipe decreases. This occurs because liquid is continuously being added to the lamellas during the process of foam growth. In open-top pipes, the foam column reaches its maximum height when the foam generation at the bottom is balanced with the foam rupture at the top. Conversely, in closed-top pipes the experiment is stopped when the entire pipe volume is filled by the generated foam to avoid foam disruption by the increased pressure due to continued gas injection. The time of foam generation, i.e., t = tend, corresponds to the time when the foam column achieves its maximum height. A high-speed CMOS Redlake HG-100 K camera working with a full-frame resolution of 1,504 × 1,128 pixels at a rate of 1,000 frames per second and mounted on a slider was used to take photographic pictures of the growing foams. Movement of the camera along the slider was controlled by means of a host computer.
The working liquid used in the experiments consisted of a mixture of water (with density ρw = 0.998 kg m−3, viscosity μw = 0.891 mPa s, surface tension σw = 72.5 mN m−1, and contact angle between the water and acrylic wall θw = 12.45° ± 0.5°) and a commercial liquid soap (with viscosity μs = 4 mPa s, surface tension σs = 72.86 mN m−1, and contact angle between the liquid soap and the acrylic wall θs = 48.76° ± 0.5°. The resulting physical properties of the mixture solution were: ρsol = 0.999 kg m−3, μsol = 2 mPa s, σsol = 76.12 mN m−1, and θsol = 28.4° ± 0.5°. Contrary to what is usually done in most experiments, here a surfactant with a surface tension higher than that of water was used to study fracturing stimulation applied to the petroleum industry [1]. All experiments were performed at a room temperature of 25°C and 33% relative humidity. The viscosity of the liquids were measured using a Brookfield Viscosimeter DLVD-II + P and the values of the surface tension were obtained using a DataPhysics Dynamic Contact Angle Measuring Device and tensiometer DCAT 11. In order to investigate foam drainage, the mixture liquid solution at the bottom of the pipe was seeded with approximately 1 g of spherical LaVision polyamide tracer particles of diameter 50 μm and density of 1,030 kg m−3. Each experiment was repeated up to 10 times to assess the reproducibility of the results. In all cases, the growth of the foam column as well as its maximum height were reproduced with a standard deviation of
4 Experimental results
4.1 Open top pipes
The position of the foam front, hf, during the vertical rise of the foam column as a function of time for different pipe diameters is shown in Figure 2. The error bars on each measurement in Figure 2A correspond to the standard error of the sample calculated as its standard deviation divided by the square root of its size (i.e., the square root of the number of measurements for each pipe). The standard errors vary between
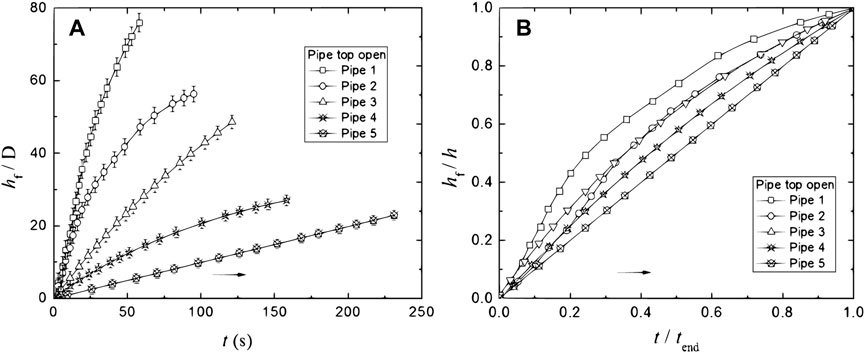
FIGURE 2. (A) Measured height of the foam front normalized to the pipe diameter, hf/D, as a function of time for varying D as listed in Table 1 for the case of open top pipes. The error bars depicted on each measurement corresponds to the standard error calculated as the standard deviation divided by the square root of the number of measurements. The standard errors are: 5.0% for Pipe 1, 4.7% for Pipe 2, 4.3% for Pipe 3, 4.1% for Pipe 2, and 3.8% for Pipe 5 with confidence intervals around 95%. (B) Same data as in (A) but normalized to the height of the vertical pipe, hf/h, as a function of time normalized to the foam generation time, t/tend. The arrows in (A) and (B) indicate the direction in which the pipe diameter increases.
The log-log plot of Figure 3 shows that the growth of hf obeys an approximate power-law behavior with time, i.e., hf ∼ tn, where n depends on the specific pipe diameter. Pipes 1 and 2 with the smallest diameters exhibit a temporal evolution characterized by two different power-law dependencies. For times less than about 1.35 s (marked by the vertical arrow on the left), hf evolves as t1.11 for Pipes 1 and 2, while for times greater than 1.35 s, the height of the foam front evolves as t0.69 for Pipe 1 and t0.53 for Pipe 2. Since in Pipes 3 and 4 with larger diameters, the foam column experiences a slower growth compared to Pipes 1 and 2, the threshold time has been shifted to approximately 1.5 s as marked by the vertical arrow on the right. In this case, hf ∼ t0.97 in Pipe 3 and hf ∼ t0.85 in Pipe 4 when t < 1.5 s, while hf ∼ t0.81 in Pipe 3 and hf ∼ t0.68 in Pipe 4 when t > 1.5 s. In Pipe 5 with the largest diameter, the log-log plot reveals an approximate linear behavior (hf ∼ t) as was already noticed from Figure 2. According to Denkov et al. [19], as the foam front rises a capillary number, Ca = μv/σ, can be defined, where μ is the liquid viscosity, v is the relative velocity between the foam and the pipe wall (here the front rise velocity) and σ is the surface tension. They found that the wall stress is proportional to Ca1/2. Although we have not measured the viscous stress in the foam/wall region, it has been verified experimentally that friction forces were relatively stronger in pipes with smaller h/D-ratios, thereby affecting the surface mobility of the bubbles [19, 20]. This was confirmed by the increased apparent foam viscosity, which slowed down the front velocity in pipes with decreasing h/D-ratios. This occurs because foams with larger bubble sizes were formed in those pipes, resulting in larger zones of viscous friction with the pipe wall and therefore in reduced surface mobility of the bubbles.
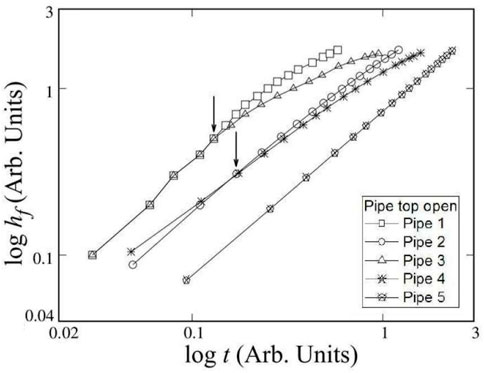
FIGURE 3. Logarithm of the foam height in meters versus the logarithm of time in seconds for the same data of Figure 2. The left and right vertical arrows mark the times when the power-law dependence of foam height on time changes in Pipes 1, 2, and 3, 4, respectively.
Figure 4 shows the foam front velocity, vf = dhf/dt, as a function of time for the five pipe diameters listed in Table 1. The velocity of the foam front was calculated by comparing successive measurements of the front height with time using one-sided finite differences. With the exception of Pipe 5, in all cases the front velocity decreases with time. However, during the first 50 s the decrease is considerably much steeper in Pipes 1 and 2 with the smallest diameters. In Pipe 2, with a diameter of 2.87 mm, the foam growth slows down after about 50 s and reaches its maximum height at a slower rate compared to Pipes 3, 4, and 5 with larger diameters. The same does not occur in Pipe 1 (with the smallest diameter) because there the foam achieves its maximum height within the first 50 s, i.e., faster than for the other pipe diameters. As the pipe diameter increases, the slope of the foam rise velocity decreases until it approximately vanishes for Pipe 5 with the largest diameter, where the foam grows at an almost constant rate. These differences in velocity are related to the movement of the bubbles. When the pipe diameter decreases faster rates occur due to direct pushing of bottom bubbles upward with little or no lateral movements, while when the pipe diameter is increased lateral motion of the bubbles slows down the rise of the foam. Gravity drainage of the liquid along the Plateau borders may also affect the front velocity. However, according to the experimental results of Enzendorfer et al. [8], who performed foam rheology measurements in long pipes of varying small diameters, the slower front velocity in pipes with smaller h/D ratios (i.e., with larger diameters) is due to the increasing apparent foam viscosity, which can be interpreted as a consequence of the increasing specific volume expansion ratio, defined as the ratio of the density of the base liquid to that of the foam [7], and not only as the consequence of the lateral bubble movement. An estimate of how the front velocity varies with time can also be obtained from the power-law scaling
From Figure 4, the front velocity in Pipes 1 to 4 decays with time following approximately a power-law dependence of the form
Therefore, values of n < 1 implies that the front velocity decreases rapidly as depicted in Figure 4. However, as n → 1 as in Pipe 5, the front velocity is approximately constant as n−1 → 0. In this case, the formation of new bubbles due to gas injection and liquid drainage along the Plateau borders are no longer affecting the front velocity. According to Table 2 the Bikerman unit of foaminess increases with the pipe diameter, meaning that more stable foams are formed in pipes with larger diameters.
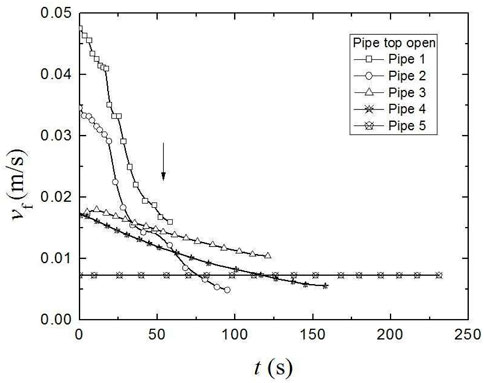
FIGURE 4. Foam rise velocity, vf, in m s−1 as a function of time in seconds for foam columns generated within open top pipes of varying diameters. The arrow indicates the direction in which the pipe diameter increases.
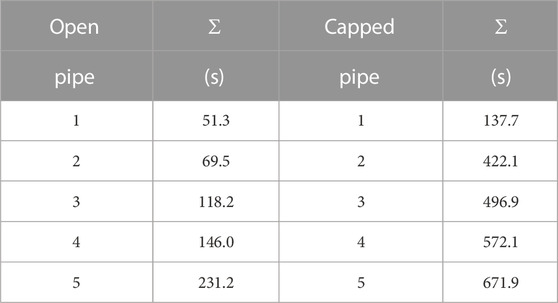
TABLE 2. Bikerman’s unit of foaminess.
4.2 Closed-top pipes
In a second set of experiments the pipe tops were sealed with a hermetic lid to impede the gas exit. Figure 5 shows the evolution of the foam front for the various pipe diameters when the pipe top is closed. The error bars correspond to standard errors, which vary from
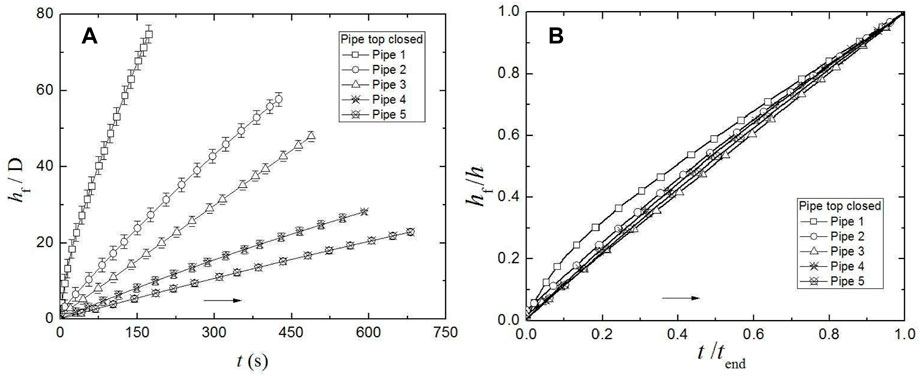
FIGURE 5. (A) Measured height of the foam front normalized to the pipe diameter, hf/D, as a function of time for different pipe diameters as listed in Table 1 for the case of closed-top pipes. The error bars depicted on each measurement correspond to standard errors. The standard errors are: 4.8% for Pipe 1, 4.0% for Pipe 2, 3.5% for Pipe 3, 3.0% for Pipe 4, and 2.5% for Pipe 5 with confidence intervals around 96%. (B) Same data as in (A) but normalized to the height of the vertical pipe, hf/h, as a function of time normalized to the foam generation time, t/tend. The arrows in (A) and (B) indicate the direction in which the pipe diameter increases.
The log-log plot of Figure 6 shows that the data for all pipe diameters follow approximately a power-law trend. For example, in Pipe 1 the foam height evolves as ∼ t0.70, while for Pipe 2 goes as ∼ t0.84 and for Pipe 3 as ∼ t0.95. For the case of the largest diameters, the foam grows as ∼ t0.89 (in Pipe 4) and ∼ t0.93 (in Pipe 5). In contrast to the case of open top pipes, here the exponents show a clear tendency to increase with the pipe diameter. As shown in Figure 6, the trends for Pipes 3 to 5 are very similar yielding on average a power-law dependence of ∼ t6/7. The foam rise velocity as a function of time is displayed in Figure 7. The foam column in all pipes, with the only exception of Pipe 1, grows with a nearly constant velocity. In these cases, n is close to unity and therefore n−1 → 0. However, for Pipe 1, n < 1 and the front velocity decays steepily during the first 30 s and then at a much slower rate until it reaches the maximum height after about 175 s. When the pipe top is closed, the pressure accumulated in its upper parts is correspondingly higher than in the open case. This explains why the rise of the foam columns is much slower in the former case. Also, in this case the bubbles tend to fill the foam volume almost completely. This has been evidenced by the high packing of bubbles which ultimately forms a foam with a well-marked honeycomb structure. The values of Σ listed in Table 2 are in all cases greater than those for the open-top pipes, implying that the growing foams are more stable when formed within closed-top pipes. As in the former experiments, the size of Σ also increases with the pipe diameter.
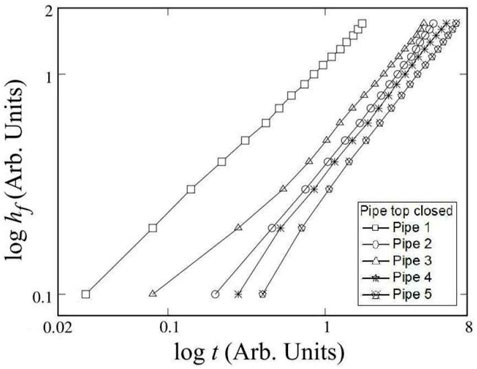
FIGURE 6. Logarithm of the foam height in meters versus the logarithm of time in seconds for the same data of Figure 5.
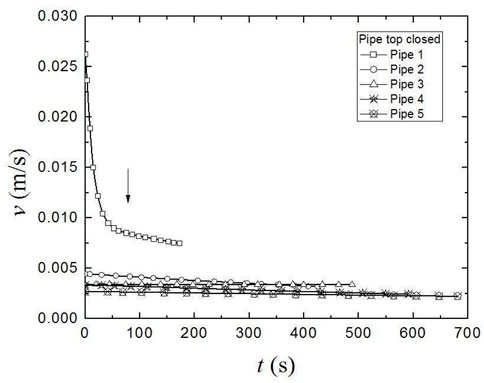
FIGURE 7. Foam rise velocity, vf, in m s−1 as a function of time in seconds for foam columns generated in closed-top pipes of varying diameters. The arrow indicates the direction in which the pipe diameter increases.
4.3 Pressure
According to the Laplace equation, the pressure difference between the inside and outside of a gas bubble is given by [12, 21].
where σ denotes surface tension and r is the bubble radius. Therefore, it follows that the smaller the radius, the greater the pressure inside. That is, the inner pressure of small bubbles is higher compared to that of larger bubbles. Hence as a foam collapses, the pressure above it increases. If the collapsing foam is contained within a sealed vessel, the rate of pressure increase inside the vessel will be directly proportional to the rate of foam collapse [12, 13]. In the present experiments foams formed in open-top pipes may collapse after a few hours (typically 3–4 h), while those formed in closed-top pipes were observed to collapse after more than 3 days.
We have performed measurements of the pressure close to the upper end of closed-top vertical pipes using a Dwyer pressure transducer D1635 with a pressure range between 0 and 103.24 kPa and operating temperature between 256.15 and 473.15 K, which is compatible with liquids and gases. For the data acquisition, it was necessary to develop a LabVIEW 2013 program and use a National Instruments SCB-68 data acquisition module. Figure 8 shows the measured pressure field as a function of time for all closed-top pipe diameters of Table 1. The pressure of the compressed air due to foam generation increases as the pipe diameter decreases. The dashed horizontal line marks the value of the atmospheric pressure (p = 77.98 kPa) in Mexico City. For all pipes, with the exception of Pipe 5, the pressure close to the top of the vertical pipes increases steeply during the first 75 s and then remains approximately constant. In particular, for Pipe 5 with the largest diameter the pressure at its top section remains slightly above the atmospheric pressure for all the evolution.
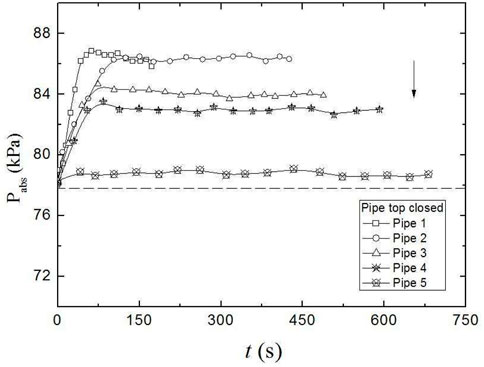
FIGURE 8. Pressure variation with time as measured close to the pipe top for the case of dry foams generated in closed-top pipes. The arrow indicates the direction in which the pipe diameter increases.
4.4 Bubble size distribution
The size distribution of bubbles is an important factor for the stability and utility of foams. In particular, the mean bubble size in a flowing foam can be influenced by a number of factors, including the gas flow rate employed for foam generation, the liquid viscosity, and the foam generator method [22]. When measuring the size of foams there are at least four lengths of interest that characterize the properties of a dry foam, namely a) the length of the whole foam, with typical scales of
Figure 9A shows an amplified photograph of a small foam region inside Pipe 2 with top open. The picture shows that the bubbles that formed have a polyhedral shape and therefore their size cannot be characterized by a simple diameter. Instead their size can be defined by the length between two opposite faces as shown by the lengths l1, l2, and l3. In this case as well as for all other diameters the size of the forming bubbles is not uniform. For comparison Figure 9B shows an amplified view of a small region of the foam formed in Pipe 5 with top closed. In contrast to Figure 9A, the size of the bubbles looks much more uniform. Uniform sized bubbles were also produced for all other closed-top pipe diameters. The dry foam was cut at different pipe cross-sectional planes and the bubble size was measured on each section using 100 micro-photographs. The resulting pictures were analyzed using the commercial softwares AutoCad and ImageJ. The bubble size distribution influences the effective foam viscosity in the sense that it will be higher when the bubble size distribution is relatively homogeneous as in the case shown in Figure 9B [1].
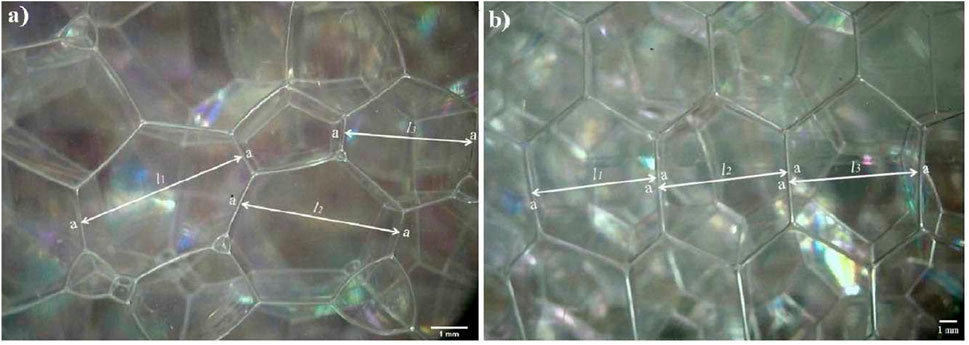
FIGURE 9. Photographic pictures showing a small region of a foam formed inside (A) Pipe 2 with top open and (B) Pipe 5 with top closed. The white arrows mark three lengths between opposite bubble faces: l1≈3.6 mm, l2≈6.1 mm, and l3≈3.3 mm in (A) and l1≈7.1 mm, l2≈7.2 mm and l3≈7.3 mm in (B).
Figure 10 depicts typical cumulative bubble size distributions (CDs) for the case when the top of the vertical pipe is open (Figure 10A, corresponding to Pipe 2) and closed (Figure 10B, corresponding to Pipe 5). In both plots the cumulative size percentage (open circles) and frequency (crosses) are plotted against the bubble size. Here the cumulative size distribution was calculated by dividing the cumulative frequency by the total number of observations (
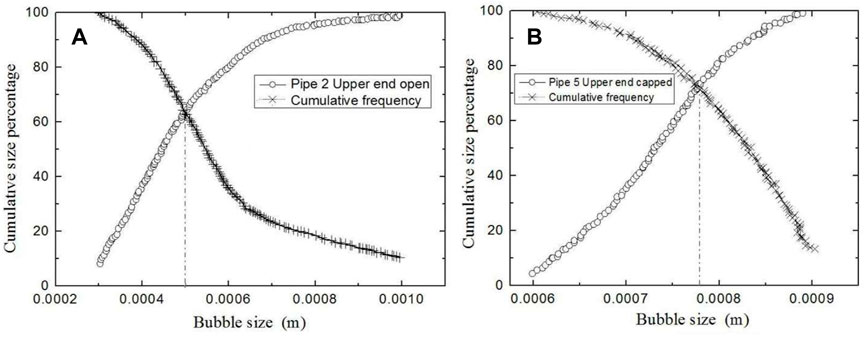
FIGURE 10. Cumulative distribution (CD) of bubble sizes (open circles) and cumulative frequency (crosses): (A) for Pipe 2 with top open and (B) for Pipe 5 with top closed. The dot-dashed vertical line in each frame marks the average bubble size.
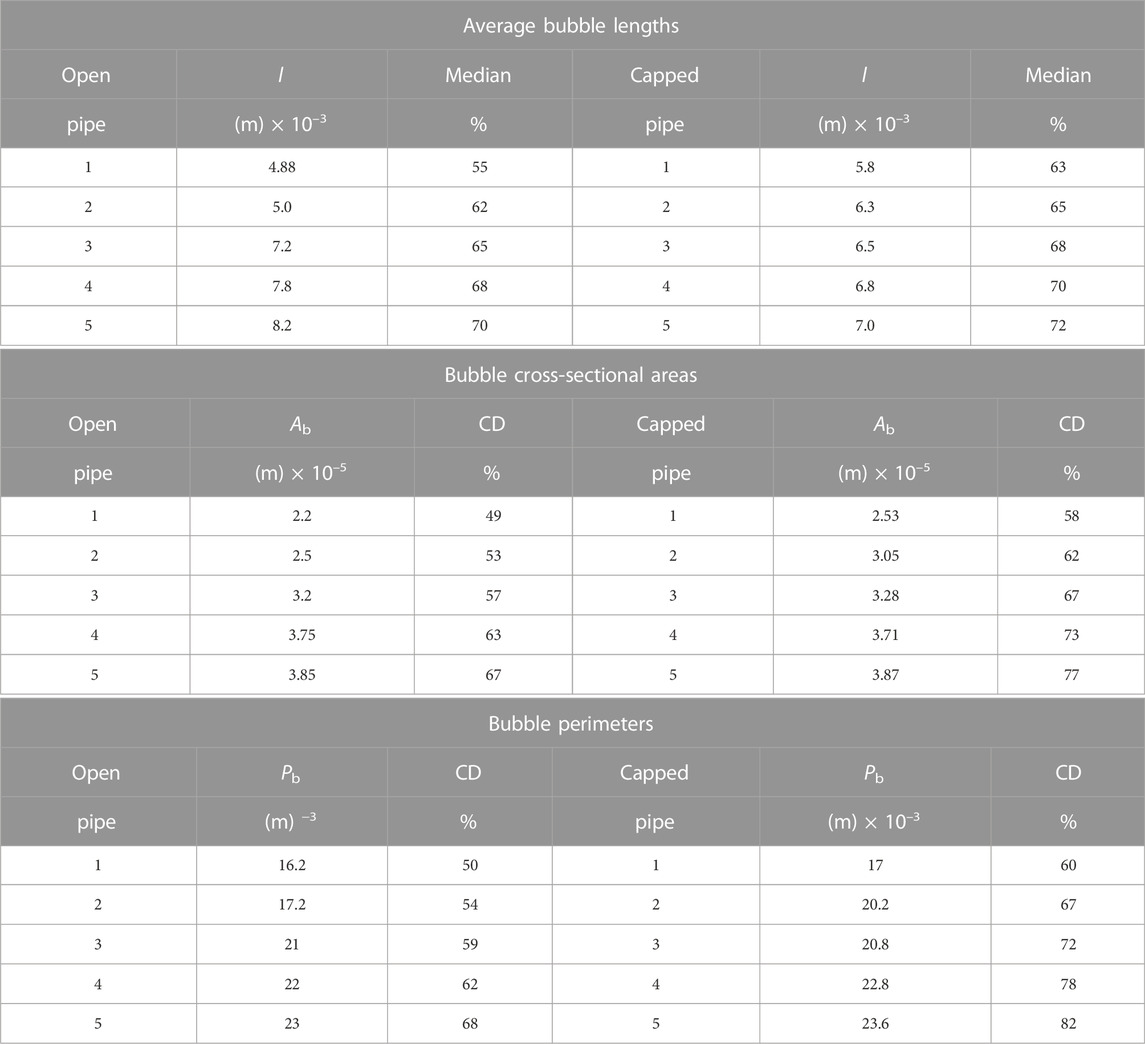
TABLE 3. Bubble sizes.
4.5 Foam drainage
A foam is said to be draining under the influence of gravity when there is liquid flowing along the Plateau borders (or channels intersecting three liquid films), which ultimately accumulates at the bottom and results in foams with non-uniform liquid content, that is, in foams that are wet at the bottom and drier at the top [24]. Even on the scale of a single bubble, the dynamics of foam drainage is intricate because the flow of liquid that converges in a node from different channels merges and then separates into flows through other channels. The situation complicates even more when the gas-liquid interfaces are coated with surfactants to prevent the liquid films from rupture by just keeping their opposite faces from merging [25]. A generalized foam drainage equation describing the spatial and temporal dynamics of the liquid volume fraction was derived by Koehler et al. [26], which takes into account the effects of viscous damping from flow in the nodes as well as in the liquid-carrying Plateau borders. However, the foam drainage equations found in the literature apply mostly to polydisperse foams [27].
For the dry foams formed in the present set of experiments, the flow velocity as measured along a Plateau border shows a marked difference from the traditional drainage model based on Poiseuille-type flow characteristic of channels with rigid gas-liquid interfaces, in which case viscous damping of the liquid flow is dominated by the channels. Figure 11A shows the velocity of a polyamide tracer particle along a Plateau border of the dry foams produced in Pipes 1 (open squares) and 2 (open circles) with top closed as a function of time. Figure 12 shows a photograph of the Plateau border analyzed, corresponding to the case of Pipe 2 in Figure 11A. The photograph captures an instant when the tracer particle (enclosed by the black circle) was flowing across the channel. In both cases the velocity of the tracer particle is rather erratic, showing a zig-zag behavior with time. The zig-zagging dynamics is due to mobile gas-liquid interface across the channels. The amplitude of the oscillations looks a bit larger in Pipe 1 than in Pipe 2. Pipe 3 with a larger diameter displayed on average smaller amplitudes compared to Pipe 2, confirming a dependence of the zig-zag motion on the pipe diameter. For both pipes in Figure 11A, the velocity of the particle zig-zags about a mean value, which is approximately uniform in time. This appears to be more indicative of a plug-like flow across a channel with fully mobile gas-liquid interfaces, in which case viscous dissipation takes place in the nodes where the converging flow is diverted into three different directions [26, 28]. According to Koehler et al. [26] two different drainage regimes can be identified, which are characterized by the power law ɛ ∼ t−η, where η > 1 indicates a mobile gas-liquid interface corresponding to a plug-like flow and η < 1 indicates a more rigid interface with a Poiseuille flow through the Plateau borders. However, the value of η for the foams produced in the present experiments could not be determined because it would have required to measure the decay time of the foams, which for the case of the closed-top pipes usually it took more than 3 days. Figure 11B depicts the instantaneous positions of the tracer particle during its passage across the full length of the Plateau border. Independently of the pipe type, the instantaneous positions varies linearly with time as the tracer particle crosses the entire channel.
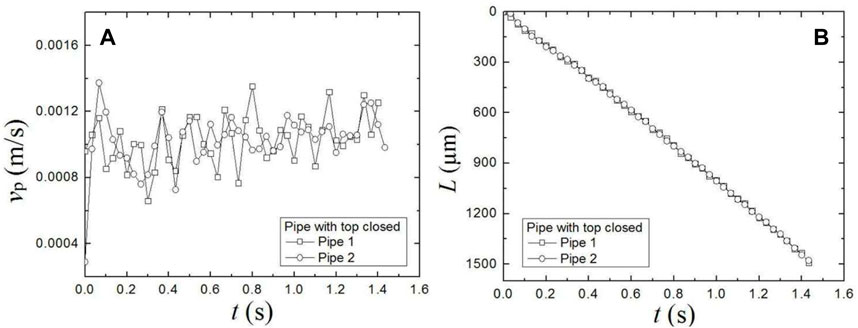
FIGURE 11. (A) Drain velocity of liquid along a Plateau border and (B) measured instantaneous position of a tracer polyamide particle flowing along the same Plateau border as functions of time for the foams produced in Pipe 1 (open squares) and Pipe 2 (open circles) both with their tops closed.
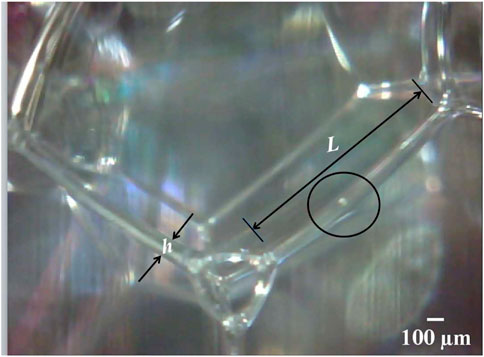
FIGURE 12. High-resolution photograph of the Plateau borders for a foam produced in Pipe 2 with top closed. On average, the diameter of the Plateau borders is from h =100–120 μm. The black circle encloses a polyamide tracer particle flowing through a Plataeu border of length L as was observed with a microscope resolution corresponding to a magnification of × 1000.
5 Conclusion
We have performed an experimental study on the growth of foams in thin vertical pipes of varying diameters by pneumatic injection of air into a mixture of water and commercial liquid soap. Air injection was performed by means of a single capillary tube and the growth of the foam column was investigated for two different cases: a) when the top of the pipe is open and b) when it is hermetically sealed.
The main conclusions can be summarized as follows:
• The foam column grows much faster as the pipe diameter is decreased. This trend was observed in both open and closed-top pipes. The slower front velocity observed when the pipe diameter is increased can be explained by the correspondingly increased apparent foam viscosity combined with the larger space available for lateral bubble movement. However, in pipes of the same diameter the foam column grows faster when the top is open. This occurs because of the increasing air pressure in the closed-top pipes, which slows down the rise of the foam front.
• A transition from non-linear to linear growth of the foam column occurs when the pipe diameter is increased, independently of whether the top end is open or closed. The non-linearity comes from the fact that the foam front grows faster at the beginning and then slows down before achieving the equilibrium height. This effect, which was more prominent in open-top pipes with h/D ≥ 30 and in closed-top pipes with h/D ≥ 51, is due to the greater pressure exerted by the foam weight over the newly formed bubbles when the pipe diameter decreases.
• The foam front grows following a power-law dependence on time, i.e., hf ∼ tn, where n may vary between
• The foam dispersivity was seen to depend on whether the top of the pipe is open or closed. The foams produced in open top pipes were characterized by a modest degree of polydispersivity in the bubble sizes compared to those formed in closed-top pipes, where the size of bubbles looks much more homogeneous. In the former case, the non-homogeneity was seen to decrease with decreasing pipe diameter, while in the latter case the homogeneity in the bubble size distribution increased with decreasing pipe diameter. The increase of homogeneity in both cases when the pipe diameter decreases is due to the fact that forming bubbles has less space available to move laterally, thereby reducing the chance for bubble coalescence and film rupture.
• In both types of pipes the bubble size increases with increasing pipe diameter. In particular, for diameters
• The pressure of the compressed air due to foam generation increases as the pipe diameter decreases in closed-top pipes. In particular, as the pipe diameter increases the pressure at the top section of the pipe becomes progressively closer to atmospheric pressure.
• The foam rise velocity and the bubble size depend on the pressure gradient generated within the pipe. For instance, in open top pipes the pressure gradients are lower than in closed top pipes. Therefore, hf → h faster and the bubble sizes are larger in the former case.
• Under gravity-driven drainage, the flow of liquid through the Plateau borders varies rather erratically with time, following a zig-zag motion about a mean value which remains almost constant with time. This is inconsistent with a rigid-wall model based on Poiseuille-type flow, and is more indicative of a plug-like flow resulting in Plateau borders with mobile gas-liquid interfaces. As a final remark, we note that when tracer particles are located inside the foam, the detected particle centroids are affected by reflection or refraction at each bubble interface, thereby leading to errors in the drain speed. However, on average the particle displacement provides a fairly good measure of the drain velocity.
Data availability statement
The raw data supporting the conclusion of this article will be made available by the authors, without undue reservation.
Author contributions
The experiments were designed and performed by VA and AM. All authors contributed to the analysis. The manuscript was organized and written by LS. Discussions and interpretation of the results were provided by IC-M and JK. All authors read and approved the final manuscript.
Acknowledgments
We acknowledge support from the Departamento de Ciencias Básicas of the Universidad Autónoma Metropolitana—Azcapotzalco (UAM-A) during the writing of the manuscript. We are grateful to the reviewers who have provided a number of suggestions and comments that have improved the content of the manuscript.
Conflict of Interest
The authors declare that the research was conducted in the absence of any commercial or financial relationships that could be construed as a potential conflict of interest.
Publisher’s note
All claims expressed in this article are solely those of the authors and do not necessarily represent those of their affiliated organizations, or those of the publisher, the editors and the reviewers. Any product that may be evaluated in this article, or claim that may be made by its manufacturer, is not guaranteed or endorsed by the publisher.
References
1. Schramm LL, Wassmuth F. Foams: Basic principles. Washington: Advances in Chemistry Series Publications (1994). chap. 1. 3–45. doi:10.1021/ba-1994-0242.ch001
2. Tyrode E, Pizzino A, Rojas OJ. Foamability and foam stability at high pressures and temperatures. I. Instrument validation. Rev Sci Instrum (2003) 74:2925–32. doi:10.1063/1.1569403
5. Edinzo I, Anderez J, Forgiarini A, Salager JL. A new method to estimate the stability of short-life foams. Colloids Surf A: Physicochemical Eng Aspects (1995) 98:167–74. doi:10.1016/0927-7757(95)03101-i
6. Sullivan JM. “The geometry of bubbles and foams,” in Foams and Emulsions, NATO ASI Series. Editors J. F. Sadoc, and N. Rivier (Dordrecht: Springer) (1999) 354. p. 379–402.
7. Valkó P, Economides MJ. Volume equalized constitutive equations for foamed polymer solutions. J Rheol (N Y N Y) (1992) 36:1033–55. doi:10.1122/1.550300
8. Enzendorfer C, Harris RA, Valkó P, Economides MJ, Fokker PA, Davies DD. Pipe viscometry of foams. J Rheol (N Y N Y) (1995) 39:345–58. doi:10.1122/1.550701
9. Oguz HN, Prosperetti A. Bubble entrainment by the impact of drops on liquid surfaces. J Fluid Mech (1990) 219:143–79. doi:10.1017/S0022112090002890
10. Briceño MI, Joseph DD. Self-lubricated transport of aqueous foams in horizontal conduits. Int J Multiphase Flow (2003) 29:1817–31. doi:10.1016/j.ijmultiphaseflow.2003.10.001
11. Wesley DJ, Smith RM, Zimmerman WB, Howse JR. Influence of surface wettability on microbubble formation. Langmuir (2016) 32:1269–78. doi:10.1021/acs.langmuir.5b03743
12. Prud’homme RK, Khan SA. Foams: Theory, measurements and applications. New York: RoutledgeTaylor & Francis Group (1996).
13. Drenckhan W, Hutzler S. Structure and energy of liquid foams. Adv Colloid Interf Sci (2015) 224:1–16. doi:10.1016/j.cis.2015.05.004
14. Farr RS, Groot RD. Close packing density of polydisperse hard spheres. J Chem Phys (2009) 131:244104. doi:10.1063/1.3276799
15. Drenckhan W, Saint-Jalmes A. The science of foaming. Adv Colloid Interf Sci (2015) 222:228–59. doi:10.1016/j.cis.2015.04.001
16. Hutzler S, Lösch D, Carey E, Weaire D, Hloucha M, Stubenrauch C. Evaluation of a steady-state test of foam stability. Philos Mag (2011) 91:537–52. doi:10.1080/14786435.2010.526646
17. Karakashev SI, Giorgev P, Balashev K. On the growth of pneumatic foams. Eur Phys J E (2013) 36:13. doi:10.1140/epje/i2013-13013-4
18. López-Villa A, Medina A, Higuera FJ. Bubble growth by injection of gas into viscous liquids in cylindrical and conical tubes. Phys Fluids (1994) (2011) 23:102102. doi:10.1063/1.3643248
19. Denkov ND, Subramanian V, Gurovich D, Lips A. Wall slip and viscous dissipation in sheared foams: Effect of surface mobility. Colloids Surf A: Physicochemical Eng Aspects (2005) 263:129–45. doi:10.1016/j.colsurfa.2005.02.038
20. Denkov ND, Tcholakova S, Golemanov K, Subramanian V, Lips A. Foam–wall friction: Effect of air volume fraction for tangentially immobile bubble surface. Colloids Surf A: Physicochemical Eng Aspects (2006) 282:329–47. doi:10.1016/j.colsurfa.2006.04.028
22. Deshpande NS, Barigou M. The flow of gas-liquid foams in vertical pipes. Chem Eng Sci (2000) 55:4297–309. doi:10.1016/S0009-2509(00)00057-9
23. Cantat I, Elias F, Graner F, Höhler R, Pitois O, Rouyer F, et al. Foams: Structure and dynamics. Oxford: Oxford University Press (2013).
24. Weaire D, Hutzler S, Verbist G, Peters E. A review of foam drainage. Adv Chem Phys (1997) 102:315–74. doi:10.1002/9780470141618.ch5
26. Koehler SA, Hilgenfeldt S, Stone HA. A generalized view of foam drainage: Experiment and theory. Langmuir (2000) 16:6327–41. doi:10.1021/la9913147
27. Koehler SA, Hilgenfeldt S, Stone HA. Liquid flow through aqueous foams: The node-dominated foam drainage equation. Phys Rev Lett (1999) 82:4232–5. doi:10.1103/PhysRevLett.82.4232
Keywords: pneumatic foams, dry foams, bubbles, gas-liquid interfaces, foam dispersivity, capillarity
Citation: Álvarez Salazar VS, Sigalotti LDG, Medina Ovando A, Carvajal-Mariscal I and Klapp J (2022) Experimental study on the rise of aqueous foams in vertical pipes. Front. Phys. 10:1081168. doi: 10.3389/fphy.2022.1081168
Received: 26 October 2022; Accepted: 05 December 2022;
Published: 15 December 2022.
Edited by:
Minping Wan, Southern University of Science and Technology, ChinaReviewed by:
Antonio Perazzo, Novaflux, United StatesXin Tang, Southern University of Science and Technology, China
Copyright © 2022 Álvarez Salazar, Sigalotti, Medina Ovando, Carvajal-Mariscal and Klapp. This is an open-access article distributed under the terms of the Creative Commons Attribution License (CC BY). The use, distribution or reproduction in other forums is permitted, provided the original author(s) and the copyright owner(s) are credited and that the original publication in this journal is cited, in accordance with accepted academic practice. No use, distribution or reproduction is permitted which does not comply with these terms.
*Correspondence: Leonardo Di G. Sigalotti, bGVvbmFyZG8uc2lnYWxvdHRpQGdtYWlsLmNvbQ==