 Julian Roers
 Damian Czarnecki
 Mohamad Alissa1
 Klemens Zink
- 1Institute of Medical Physics and Radiation Protection (IMPS), University of Applied Sciences Giessen, Giessen, Germany
- 2Department of Radiotherapy, University Hospital Münster, Münster, Germany
- 3Department for Radiotherapy and Radiooncology, University Medical Center Giessen-Marburg, Marburg, Germany
- 4Marburg Iontherapy Center (MIT), Marburg, Germany
Purpose: The aim of this study is to investigate the depth-dependent detector response of detailed thimble air-filled ionization chambers by calculating spectral charged particle fluence correction factors at different depths in water. Those spectral correction factors will help to understand, how the detector response varies at different depths and what kind of influences disparate effects have on the spectral detector response.
Methods: The cema-approach can be used to obtain spectral charged particle fluence-based correction factors for various measurement conditions by substituting the commonly well-known dose conversion factor with a conversion factor based on the dosimetric quantity cema (“converted-energy per unit mass”). The resulting spectral fluence correction factors were calculated with the EGSnrc software toolkit and analyzed for two air-filled cylindrical ionization chambers (PTW type 31021 Semiflex 3D, SNC125c™) at different depths in a water phantom irradiated with a 6 MV linear accelerator x-ray spectrum. The ionization chamber models have been stepwise decomposed to investigate the perturbation caused by internal and external effects on the fluence distribution within the detector.
Results: Monte Carlo calculated fluence-based perturbation correction factors revealed that for all investigated detectors, considerable fluence disturbances occur, especially in the build-up region of depth-dose curves. Our results have shown that even slight variations in depth can have major consequences on the differential charged particle fluence within the ionization chamber, mainly due to internal cavity-specific effects. Furthermore, the results showed that in the case of relative dose measurements, the depth-depending detector response can significantly differ from unity in a range of 1.4%–2.8% depending on the ionization chamber design.
Conclusion: The complexity of different effects on the fluence disturbance could be broken down with regard to their influence on the spectral fluence distribution in the sensitive volume of the investigated detectors. It could be demonstrated, that the displacement of water is a depth-depending effect, which can not be compensated or corrected ideally for each investigated water depth by the shift of the effective point of measurement. Generally, the spectral analysis of those energy-dependent correction factors serves to a deeper understanding of the detector response under various conditions.
1 Introduction
In clinical routine, the absorbed dose to water is commonly obtained from measurements made with an air-filled ionization chamber placed at the point of interest in water. The procedure is based on standards of absorbed dose to water and is specified in current national and international dosimetry protocols such as the IAEA TRS-398 Code of Practice [1]. If the ionization chamber is used under non-calibration conditions, the detector reading has to be corrected using a correction factor obtained theoretically by the fundamental Spencer-Attix cavity theory [2] with the track-end correction by Nahum [3]. This theory is based on the assumption that the presence of an air-filled cavity does not perturb the charged particle fluence spectrum. However, different detector components and cavity-specific influences affect the charged particle fluence. Thus further correction factors are necessary to take into account all deviations from the ideal assumptions made in the Spencer-Attix cavity theory. Such fluence-based correction factors are of considerable interest because the sum of all these factors describes the radiation response of the ionization chamber under various conditions in a proper way.
Monte Carlo (MC) simulation offers a method to obtain the required beam quality correction factor at a given radiation beam quality by calculating the well-known dose conversion factor expressed by the ratio between the absorbed dose to water and the dose determined in the sensitive volume of the ionization chamber. The determination of the dose conversion factor is a straightforward procedure, recommended by Codes of Practice and dosimetry protocols, e.g., the IAEA TRS 398 [1], TG-51 [4, 5] or DIN 6800-2 [6]. Alternatively, the fluence disturbance can be investigated directly by calculating the spectral charged particle fluence under different conditions via MC simulations. These fluence spectra can be used to approximate the dosimetric quantity dose by the quantity cema (“converted-energy per unit mass”), which was defined in ICRU Report 60 [7] and revised in ICRU Report 90 [8] as the mean energy lost in electronic interactions in the mass dm of a material by secondary charged particles. The cema refers to the fluence distribution of primary charged particles as well as to secondaries of high energies and is thus especially useful for high-energy photon beams [9]. This approximation provides the possibility to substitute the dose conversion factor with a cema conversion factor as introduced by Hartmann et al. [10] in a comprehensive manner which also complies with the fundamental Spencer-Attix cavity formalism. Because the cema can be expressed in terms of the charged particle fluence distribution ΦE, this approach offers the benefit to decompose the cema conversion factor into a product of energy-dependent (i.e., spectral) fluence-based correction factors pE,i and to analyze the differential fluence spectra with regard to the detector-induced fluence disturbance. Additionally, the cema-approach offers a well-understandable relationship between the spectral fluence disturbance and the resulting detector response. It was suggested by Bouchard [11] and Hartmann et al. [12] that a full account for the detector properties by decomposing detector-specific perturbation correction factors is necessary to determine absorbed dose at different conditions. To follow this suggestion, the global fluence correction factor can be divided into sub-components accounting for the spectral fluence perturbation due to internal cavity-specific effects and external fluence perturbations caused by different detector components [13–15]. In the past years, the MC simulation has become the state-of-art process for the determination of correction factors as described above [16, 17]. In analogy to the dose conversion factor, the cema-approach can also be used to calculate fluence correction factors under non-reference conditions. Hence, correction factors for any changes in the beam quality due to different field size, off-axis distance, or depth can be expressed using the ratio between the cema conversion factors at reference and non-reference conditions.
According to DIN 6800-2 [6] a depth-dependent detector response for photon beams is usually not taken into account so that the non-reference correction factor depends only on the Spencer-Attix restricted stopping power ratios
This study aims to investigate the depth-dependent detector response of detailed thimble air-filled ionization chambers by calculating spectral fluence correction factors at different depths in water. To better comprehend the role of different cavity-induced and external effects influencing the charged particle fluence spectrum in water, the spectral fluence correction factors are additionally decomposed individually by using decomposition methods introduced by Wang and Rogers [19, 20] and Wulff et al. [15]. With their help, it was also investigated if the positioning of the effective point of measurement as recommended in several dosimetry protocols can adequately compensate for the displacement of water at the build-up region. The purpose of this paper is not primarily the determination of exact correction factors for clinical use, it is more motivated by previous studies that dealt with the general understanding of the detector response under non-equilibrium conditions [10, 12, 18].
2 Materials and methods
2.1 Fundamental dosimetric quantities
The fundamental dosimetric quantities were defined in detail in ICRU Report 60 [7] and were continually corrected in ICRU Report 85 [21] and Report 90 [8]. Concerning the dosimetric quantity absorbed dose, it is usually derived from the energy loss along a given particle track length and is directly related to the dosimetric quantity particle fluence Φ. The absorbed dose to a medium Dmed due to charged particles can thus be calculated by integrating all differential fluences ΦE,med in a medium med of a given particle type multiplied with the associated electronic collision stopping power L as defined in ICRU 85 [22].
If there is no delta-particle equilibrium (δ-CPE) the quantity determined is not necessary the absorbed dose but the medium cema Cmed according to ICRU Report 60 [7, 17]. Because the cema is defined for all charged particles; such as electrons, positrons, protons, etc., the energy transfer per unit distance has to be specified for the existing particle type. In this study, the secondary electron and positron fluence were considered for the calculation of cema, but note that positrons and electrons are not always explicitly separated by word. In ICRU 90 [8] a modified concept; the restricted or reduced cema CΔ,med with the correction of track-end terms is defined as:
Formally, LΔ from Eq. 1 has to be replaced by the reduced collision stopping power ΛΔ as described by Kellerer et al. [9]. Nevertheless, the restricted stopping power as an approach for the reduced collision stopping power offers a good approximation for the applied photon energies and materials used in this study [9, 10]. The restricted medium cema is especially interesting because the requirement that δ-CPE exists can be neglected (Eq. (1)). In regards to MC-applications, the quantity restricted medium cema is also particularly useful, because MC-calculated fluence distributions are derived on a discrete energy grid and also limited by the low-energy cut-off value Δ. Electrons with kinetic energies less than Δ were presented by the so-called track-end term
2.2 Definition of cema conversion factor
According to Hartmann et. al. [10], the cema conversion factor fcema is defined in analogy to the dose conversion factor fdose as the ratio between the restricted water cema at the point of interest CΔ,w and the volume-averaged mean restricted medium cema
with
and
where
For the decomposition of the cema conversion factor fcema, it is necessary to combine a stopping power medium with a different fluence medium, resulting in a hybrid version of restricted cema. Therefore a third subscript is used, which refers to the medium in which the fluence is calculated. If the fluence medium is identical to the stopping power medium, both subscripts are summarized into one subscript. The cema conversion factor fcema can thus be decomposed into a product of sub-factors:
where CΔ,med,w is the restricted medium cema in water at the point of interest surrounded by water:
The first term of Eq. (4) is the Spencer-Attix restricted stopping power ratio water to the cavity medium
The global fluence correction factor can further be decomposed into
with the internal fluence correction factor pint
which corrects for cavity-specific influences only and pext
for external fluence perturbations due to different detector components. The external fluence correction factor pext can also be decomposed into the correction factors from specific constructive detector components for example: pcel for the perturbation caused by the central electrode in an ionization chamber, pstem for the perturbation related to the detector stem and pwall for the perturbation due to the wall (Figure 1). To investigate those specific external fluence correction factors, a decomposition technique introduced by Wulff et al. [18] and Zink and Wulff [22] can be applied. Note that this approach was originally developed for the calculation of dose conversion factors derived from dose ratios. In this study, the restricted cema ratios, respectively the fluence ratios were used. A schematic description of the decomposition technique is shown in Figure 1: The specific fluence correction factors are derived by calculating the cema in the sensitive volume of the ionization chamber while specific components are being removed. In the first step, the volume-averaged restricted medium cema in the detector cavity is calculated while all constructive components are being considered
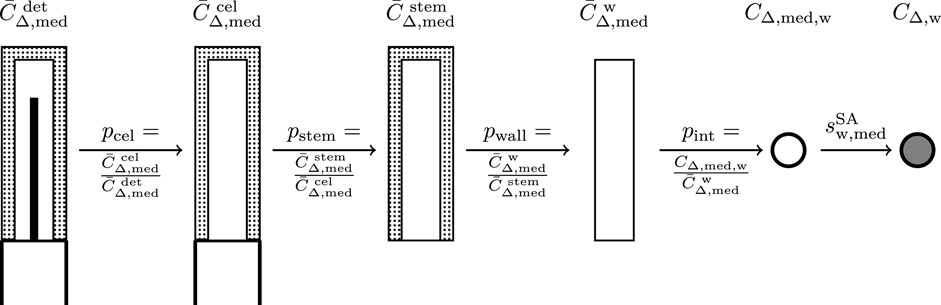
FIGURE 1. Schematic description of the determination of cema-based perturbation factors for air-filled ionization chambers. The principle of this determination method was originally introduced by Wulff et al. [18] and Zink and Wulff [22]. In this study, the fluence correction factors are calculated by comparing the cema values in the cavity while specific constructive details are missing. The internal fluence correction factor pint includes the correction factors for the volume-averaging effect pvol, the density effect pρ and the displacement effect pdis. The last step describes the conversion between the cema in the air voxel and the cema in a water voxel, which can be described by the Spencer-Attix restricted stopping-power ratio water to the detector medium
The internal fluence correction factor can be further decomposed into a product of fluence correction factors pint = pdis ⋅ pvol ⋅ pρ, where pdis corrects the effects due to the displacement of water, pvol corrects the volume-averaging effect and pρ accounts for the perturbation due to the different physical density of medium “med” in comparison to water (Figure 2). If a measurement is performed with a shift of the effective point of measurement (EPOM), it can be assumed that pdis is equal one [6]. Note that the fluence correction factor pfl accounting for the influence of different atomic compositions on the charged particle fluence was not separately determined in this study [13]. To analyze the spectral behavior of the internal fluence correction factor pint and its sub-factors pvol and pρ under charged particle dis-equilibrium, a determination method by Wang and Rogers [19, 20] was used. Therefore, a simulation in a cylindrical volume with a length of 0.48 cm and different radii, placed with their shifted reference point at 0.5 cm and 1.5 cm depth in the water phantom, was performed. The first simulation contains a volume filled with “low-density water” (ldw), a virtual material with a physical density of air and a restricted stopping power of water. The second simulation was performed with a water-filled cavity. The spectral density correction factor pρ is thus given as the ratio between the calculated cema values from both simulations. A schematic description of the determination of internal fluence correction factors is shown in Figure 2. It should be pointed out that almost all simulations with a sensitive medium different than liquid water were performed with a shift of EPOM 0.5 ⋅ rcav away from the focus, where rcav is the internal radius of the chamber cavity, to compensate the influence of the displacement effect according to the DIN6800-2 [6]. In the case of the ldw-filled cylindrical volume as shown in Figure 2, the spectral fluence was once calculated with and once without the shift of EPOM to investigate its influence on the spectral fluence correction factors.

FIGURE 2. Schematic description of the determination of cema-based internal fluence correction factors for air-filled ionization chambers following [19, 20]. The internal fluence correction factor pint includes the volume-averaging effect pvol and the density effect pρ. The acronym ldw refers to the virtual medium “low-density water”. Note that
The decomposition in external and internal effects as described above is very similar to Bouchard’s decomposition following a sequence of detector components. This formulation is consistent with the classical cavity theory-based factorization of the dose conversion
A major advantage of the cema formulation is that all named correction factors can be expressed as a function of energy pE,i. For example
the energy-independent value of pglf can thus be calculated through the fluence-weighted mean-value of pE,glf, i.e.,
2.3 The non-reference correction factor expressed by cema conversion factors
Under non-reference conditions the determined dose has to be corrected by the conceptual foundation included in the current DIN 6800-2 dosimetry protocol [6]. The factor kNR corrects any changes of the beam-quality correction factor kQ due to different field size FS, off-axis distance R, depth z or source-to-surface distance SSD compared to the geometrical reference conditions with
and can also be expressed by
Analogously to the dose conversion factor Dw/Dmed, a cema conversion factor Cw/Cmed, introduced by Hartmann et al. [10] can be used to calculate the non-reference correction factor kNR:
In this study, kNR is calculated as a function of depth z.
2.4 Monte Carlo simulation setup
The simulations were performed with a modified version of the EGSnrc user code egs_chamber [22]. The charged particle fluence scoring was adopted from the user code cavity [23] and extended using the track-end correction method III as described in [24]. A short overview of the fluence calculation method is given in [10, 24]. The choice of the Monte Carlo user code egs_chamber is motivated by high usability for dosimetric calculations of air-filled ionization chambers. In a previous study [25] and internal work reports the compatibility of all used variance-reduction techniques was confirmed. With the modified user code, the absorbed dose D, the spectral electron as well as the positron fluence
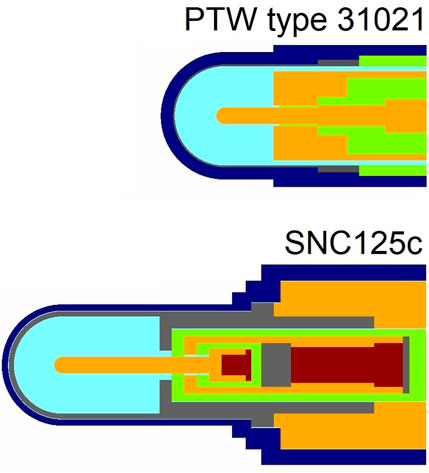
FIGURE 3. Cross sections of the investigated ionization chambers as used in this study (not to scale). The colors represent different materials.
For all calculations, a low-energy cut-off limit from 1 keV kinetic energy was used. The lower limit of the spectral fluence calculation was also set to 1 keV as well as the energy resolution of the spectral charged particle fluence but all calculated ratios in Figures 5–10 have been averaged over a logarithmic bin size from 1 keV to 100 keV in order to reduce statistical fluctuations. The Russian Roulette (RR) and cross-section enhancement (XCSE) were used to decrease the statistical uncertainties and gain efficiency due to reduced CPU runtimes. The RR-Parameter ESAVE was therefore set to the ECUT-value of 512 keV to produce an accurate spectral fluence distribution. For the RR—and XCSE-Region, the detector was covered with a cylindrical volume with a +1 cm shell thickness filled with water. For depths 0.5 cm and 1 cm the RR- and XCSE-region was extended as far as the surface of the water phantom was reached. The general simulation settings, according to the recommendations of AAPM TG-268 [29] are shown in Table 1.
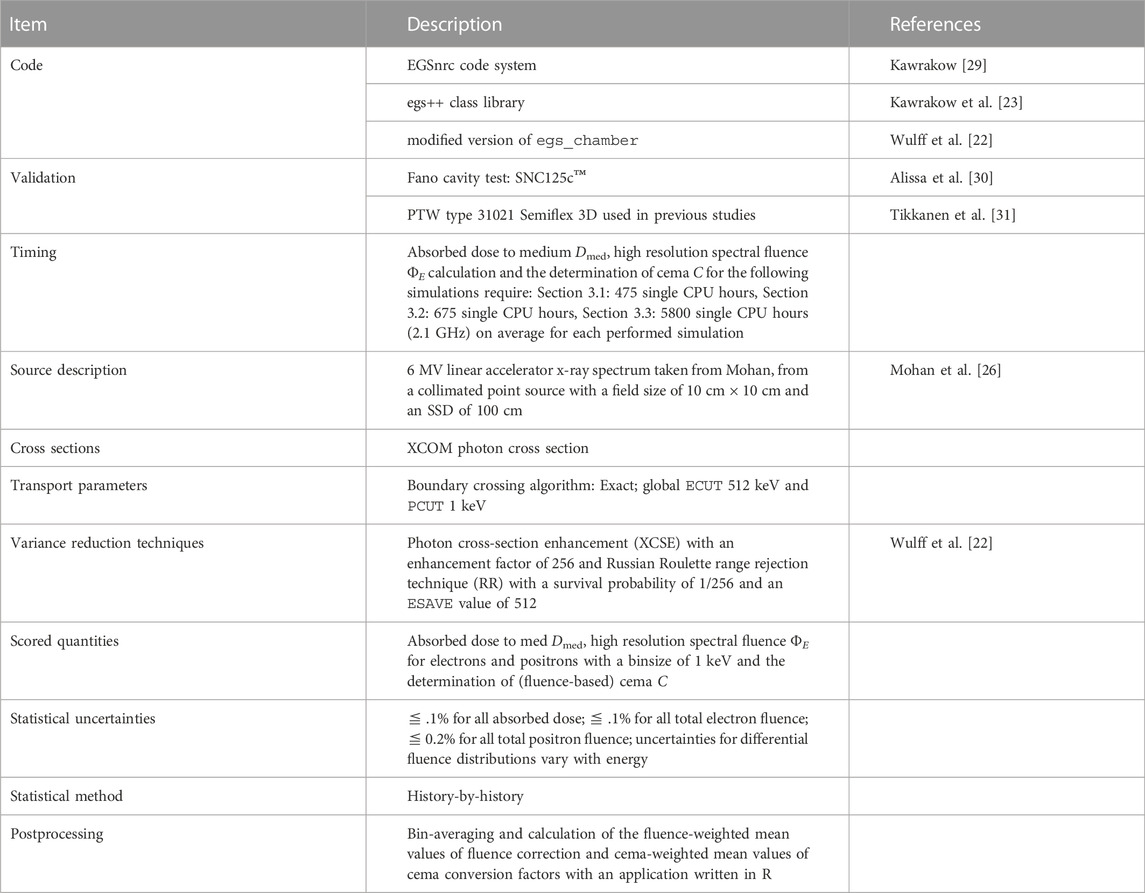
TABLE 1. Summary of simulation properties and parameters with EGSnrc, according to the recommendations of AAPM TG-268.
3 Results
3.1 Depth-depending fluence spectra in water
In Figure 4A the undisturbed electron fluence spectrum ΦE,w is shown at different depths in water evoked by the irradiation with a 6 MV linear accelerator x-ray spectrum taken from Mohan [26]. For clarity reasons, the spectral electron fluence in 2 cm, 5 cm and 20 cm water depth were omitted in Figure 4. Qualitatively, it can be seen that ΦE,w is depth-dependent while the highest fluence occurs at a water depth of 1.5 cm. For energies above 4 MeV, the spectral electron fluence decreases by several orders of magnitude and converges to zero. The relative secondary electron fluence at depth z normalized to 1.5 cm water depth given in Figure 4B revealed that ΦE,w changes differently in energy depending on depth in water: In the build-up region, the relative electron fluence spectrum systematically depends on energy; especially in the high-energy range whereas at 10 cm water depth only slight spectral fluctuations occur.
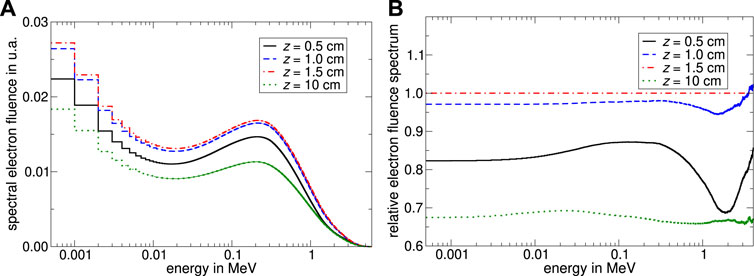
FIGURE 4. Monte Carlo calculated spectral secondary electron fluence in water at different depths. The water phantom was irradiated with a 6 MV linear accelerator x-ray spectrum taken from Mohan [26] from a collimated point source with a field size of 10 cm × 10 cm. Subfigure (A) shows the secondary electron fluence as a function of energy. Panel (B) shows the relative secondary electron fluence spectrum normalized to the spectral electron fluence at 1.5 cm water depth. The uncertainty varies depending on energy in a range of 0.005%–0.5% for panel (A) and 0.01%–1.2% for panel (B).
3.2 Internal fluence correction factors in the build-up region
In Figure 5 the spectral internal fluence correction factor pE,int for a “low-density water”-filled cavity of different radii and 0.48 cm length is shown as a function of charged particle energy in 0.5 cm water depth irradiated by a 6 MV linear accelerator x-ray spectrum [26]. Because the positron fluence proportion is
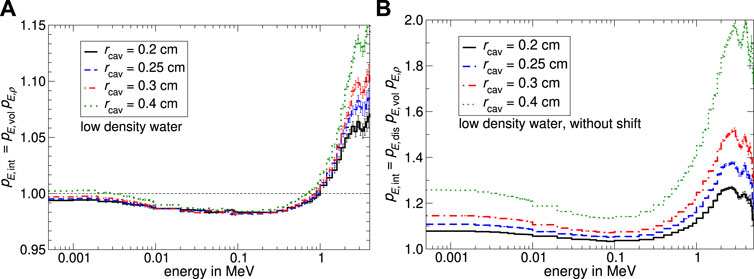
FIGURE 5. Monte Carlo calculated spectral internal fluence correction factors for a cavity with a length of 0.48 cm and different radii filled with “low-density water” as a function of energy at the build-up region. In subfigure (A) the cavity was oriented with its axis perpendicular to the beam axis and placed with their reference point shifted by 0.5 ⋅ rcav away from the focus. In panel (B) the spectral internal fluence correction factors are shown, whereby the reference point is placed at 0.5 cm depth. The uncertainty varies depending on energy in a range of 0.05%–1.3% for panel (A) and 0.07%–1.9% for panel (B).
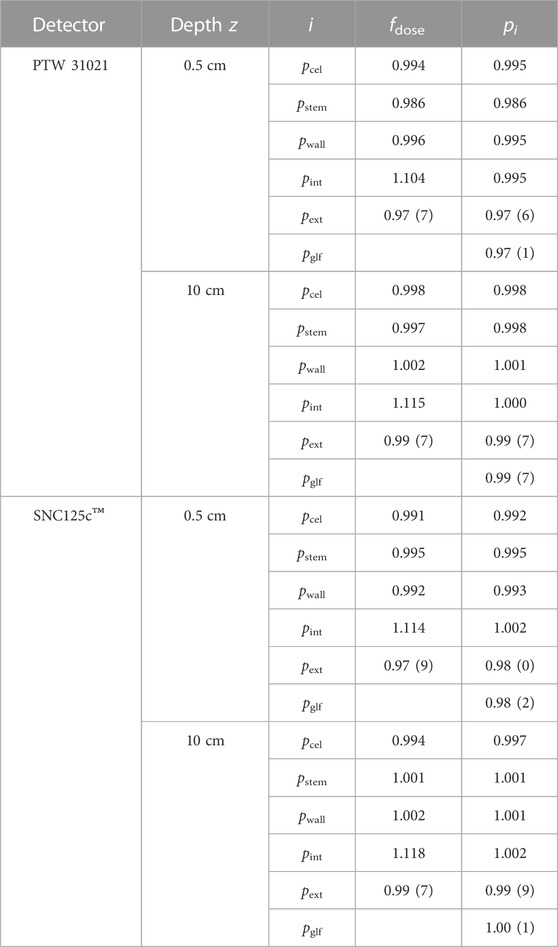
TABLE 2. Specific fluence correction factors pi for the perturbation caused by different constructive details from the PTW 31021 and SNC125c™ as well as the calculated dose-conversion factor according to Eq. 9. The uncertainties vary below 0.1% for all unmarked values.
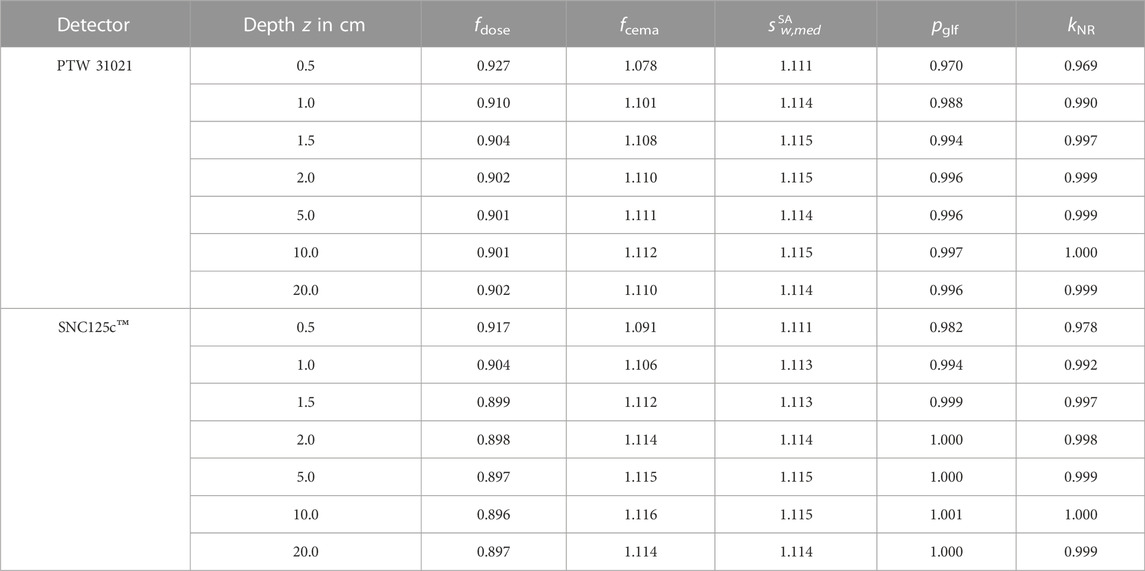
TABLE 3. Monte Carlo calculated fluence correction, cema - as well as dose conversion factors for cylindrical air-filled ionization chambers as a function of depth in water irradiated with a 6 MV linear accelerator x-ray spectrum taken from [26] from a collimated point source with a field-size of 10 cm × 10 cm. The uncertainties vary below 0.1% for all calculated values.
To verify the influence of the displacement effect in the build-up region, a simulation without the shift of the EPOM was performed. Comparing the spectral internal fluence correction factor pE,int from Figure 5A, B, indicates that the displacement effect is nearly compensated by the positioning of the cavity 0.5 ⋅ rcav away from the focus; in particular for energies below 1 MeV. The increase of pE,int from Figure 5A for energies
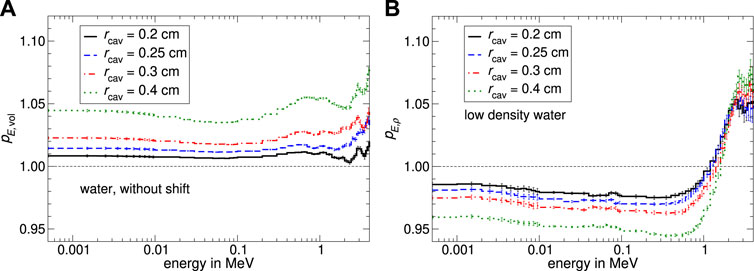
FIGURE 6. Monte Carlo calculated volume-averaging correction factor pE,vol and density correction factor pE,ρ as a function of energy in the build-up region determined by the factorization of the internal fluence correction factor shown in Figure 5A. The spectral volume-averaging correction factor pE,vol is shown in panel (A). In subfigure (B) The density effect correction factor pE,ρ as a function of energy was calculated by the quotient of pE,int divided by pE,vol as shown in Figure 2. The uncertainty varies depending on energy in a range of 0.09%–0.5% for panel (A) and 0.14%–1.8% for panel (B).
According to the procedure shown in Figure 2, the spectral internal fluence correction factor pE,int from Figure 5A was factorized into the subfactors pE,vol and pE,ρ (Figure 6). The fluence correction factors for the volume-averaging effect pE,vol shown in Figure 6A is approximately constant for all energies and varies with the particle’s energy likely by 1%–3%. Generally pE,vol is greater than unity for all cylinder radii. As shown in Figure 6B the calculated density correction factor pE,ρ is below unity for energies from 0 to 1 MeV and greater than unity for energies
In Figure 7A the Monte Carlo calculated internal fluence correction factors pint as well as the factorization into the subfactors pρ and pvol are shown as a function of the cavity radius. For a water depth of 0.5 cm a systematic dependency on the cavity radius is observable: on the one hand pvol is increasing with increasing cavity radii. Conversely pρ is decreasing almost by the same margin as pvol is increasing. For a cavity radius of 0.5 cm both effects have a maximum deviation from unity of below 5‰. The volume-averaging correction factor pvol prevails over the density effect correction factor pρ for all cavity radii. Consequently the internal fluence correction factor pint is greater unity for all investigated cavity radii. The fluence correction factors for 1.5 cm water depth are shown in Figure 7B. All fluence correction factors differ from unity with a maximum deviation of 0.4%, while pvol is greater; and pρ is below unity. The volume correction factor pvol is only slightly increasing depending on the cavity radius whereby the internal fluence correction factor is increasing by a few tenths of a percentage too. The density effect correction factor pρ remains constant within the range of uncertainties.
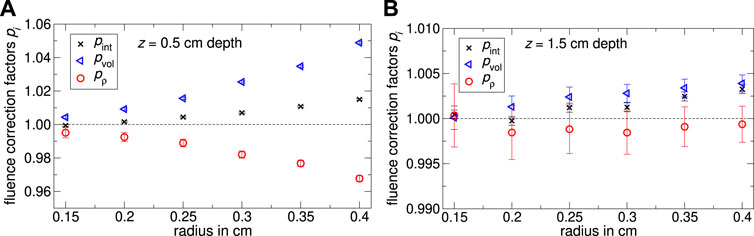
FIGURE 7. The Monte Carlo calculated internal fluence correction factor pint, the volume-averaging correction factor pvol and the density correction factor pρ for the cavity with a length of 0.48 cm and different radii in (A) 0.5 cm and (B) 1.5 cm water depth. The uncertainty varies likely by 0.2% for pint, respectively pvol and 0.4% for pρ.
3.3 Cema conversion and fluence correction factors for air-filled cylindrical ionization chambers at different depths
In Figure 8 the global fluence correction factor pE,glf and the cema conversion factor fE,cema differential in energy at different depths in water are shown for cylindrical ionization chambers irradiated with a 6 MV linear accelerator x-ray spectrum taken from Mohan [26]. A value of pE,glf below unity implements that the particles fluence in the ionization chamber
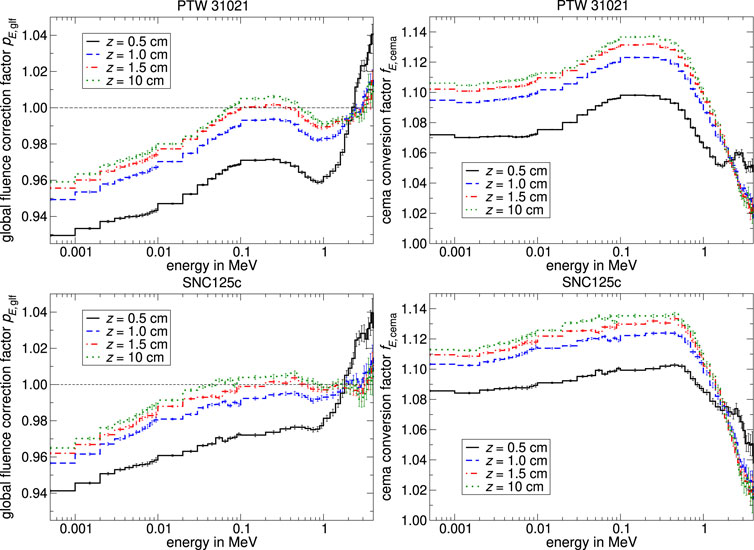
FIGURE 8. Monte Carlo calculated global fluence correction factors pE,glf and cema conversion factors
As described in Section 2.2, the cema conversion factor fE,cema is calculated by multiplying with the Spencer-Attix restricted stopping-power ratio
In Figure 9A the specific fluence correction factors for constructive details from the PTW type 31021 as a function of energy are shown for a depth of 0.5 cm in water. The fluence correction factor for the perturbation caused by the central electrode pE,cel is quite constant as a function of energy and differs from unity in a range of 2% for high electron energies. The wall perturbation correction factor pE,wall changes marginally by ∼1% in the energy range from 0 to 1 MeV and decreases for energies below 1 MeV. On the contrary, the fluence correction factor for the influence of the stem pE,stem is smaller than unity and shows a substantial decrease in the energy spectrum from 0.2 MeV to 1 MeV with a maximum deviation from unity from nearly 3%. As can be seen in Figure 9A, the internal fluence correction factor depends on energy and follows the course of pE,int shown in Figure 6 with only one exception: An decrease occur in the low-energy spectrum.
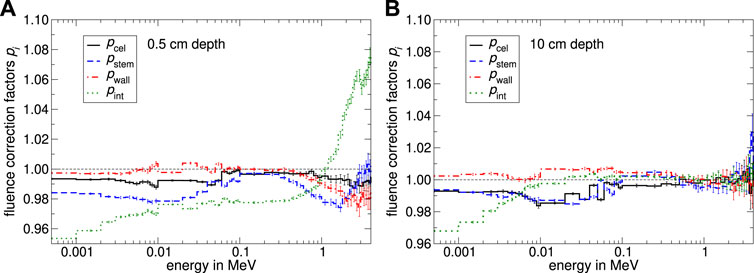
FIGURE 9. Monte Carlo calculated specific fluence correction factors pE,i for different constructive details from the PTW 31021 Semiflex 3D as a function of energy. Panel (A) shows the spectral specific fluence correction factors pE,i, whereby the shifted EPOM was positioned at 0.5 cm depth. In subfigure (B) pE,i was calculated at 10 cm depth. The uncertainty varies depending on energy in a range of 0.05%–1%.
Concerning the spectral specific fluence correction factors pE,i at 10 cm water depth as shown in Figure 9B, the wall and central electrode correction factors stay nearly constant as a function of energy compared to 0.5 cm water depth. The energy-independent total correction factors are differing from their values at 0.5 cm water depth by only 0.8%. The deviation from unity from the stem correction factor is decreasing, resulting in a fluence-weighted mean-value of pstem with an amount of 0.998 while the decrease in the energy spectrum from 0.2 MeV to 1 MeV is less noticeable. The spectral internal fluence correction factor pE,int for a water depth of 10 cm converges to unity with increasing energy, leading to a total pint of ∼1.
The spectral specific fluence correction factors for the perturbation caused by constructive details from the SNC125c™ are shown in Figure 10. Especially in the case of the fluence disturbance due to the detector stem, spectral differences between the Semiflex 3D and the SNC125c™ are observable: While the stem perturbation correction factor pE,stem for the PTW 31021 depends on the energy, it is approximately constant as a function of energy for the SNC125c™. On the contrary, the spectral fluence perturbation caused by the wall and the central electrode looks quite similar. All resulting specific fluence correction factors pi are shown in Table 2. Note that the internal correction factor pint based on the dose conversion factors includes the Spencer-Attix restricted stopping power ratio water to air
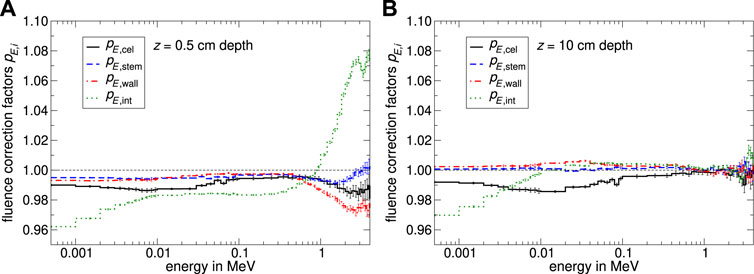
FIGURE 10. Monte Carlo calculated specific fluence correction factors pE,i for different constructive details from the SNC125c™ as a function of energy. Panel (A) shows the spectral specific fluence correction factors pE,i, whereby the shifted EPOM was positioned at 0.5 cm depth. In subfigure (B) pE,i was calculated at 10 cm depth. The uncertainty varies depending on energy in a range of 0.06%–0.9%.
All calculated values for cylindrical air-filled ionization chambers are summarized in Table 3. Note that pglf is numerically equal to pQ. The kQ value for the PTW 31021 was calculated using the cema approximation kQ = fcema(TPR = 0.671)/fcema(60Co) in 10 cm depth with fcema(60Co) = 1.127. The result amounts to 0.986 and agrees within the uncertainty of 0.3% given for the data of the consensus kQ values for MV photon beams updated in the IAEA TRS-398 [32].
In Table 3 the calculated pglf and kNR (see Eq. (14)) for air-filled cylindrical ionization chambers are shown as a function of depth. The global fluence correction factor pglf for the PTW 31021 varies within a range of 3%, the non-reference correction factor increases depending on the chamber type roughly by the same percentage. In comparison, the SNC125c™ have a slighter influence on the undisturbed charged particle fluence Φw in water at 0.5 cm depth, whereas it changes only by an amount of
In the following, it can be summarized that considerable changes in the spectral electron fluence in water occur in the low-energy spectrum due to the presence of the investigated detectors, especially in the build-up region. According to Eq. (2), the restricted medium cema CΔ,med is calculated by integrating the spectral electron and positron fluence in the medium Φmed weighted by the associated restricted stopping powers LΔ,med. Hence disturbances in the spectral electron fluence particularly in the lower energy range are more meaningful with respect to the determined cema.
4 Discussion
4.1 Influence of the internal fluence correction factor in the build-up region
Our results have shown that even small changes in depth can have major effects on the differential charged particle fluence in the ionization chamber in the build-up region, mainly due to internal effects. The internal fluence correction factor can be further reduced to the product of the density effect pE,ρ and the volume-averaging effect pE,vol. It could also be shown that the displacement effect of water is nearly compensated by the positioning of the chamber 0.5 ⋅ rcav away from the focus.
In the build-up region, the volume-averaging effect pE,vol is leading to a constant lower electron fluence
1. As shown in Figure 3, distinctive fewer electrons in water exist in the energy range above 0.5 MeV in the build-up region compared to the spectrum at 1.5 cm water depth. The interpretation of the resulting leak of high-energy electrons is not so intuitive but might be explained in a qualitative manner by the energy-dependent existence of charged particle equilibrium (CPE): Per definition, CPE exists for a volume if each charged particle of a given type and energy leaving the cavity is replaced by an identical particle with the same physical properties [2]. Thus CPE can only be achieved at a depth z equal or greater compared to the linear continuous slowing-down range RCSDA of the electron with energy E. The existence of CPE hence in fact depends on the kinetic energy E of secondary charged particles and the given medium. Considering a water-filled cavity the fluence distribution consists of electrons that are getting created inside the cavity (“starters”) and those entering the cavity from outside (“crossers”) [12]. If the bare volume is filled with air, the charged particle fluence is merely due to particles entering the cavity from outside and crossing it completely (Bragg-Gray condition). The increased CSDA-range RCSDA due to the finite size of the air-filled cavity and the assumption that no electrons are created inside might lead to a lower fluence in the high-energy spectrum in the air-filled cavity compared to the water-filled one.
2. The shift of the EPOM for cylindrical ionization chambers accounts for the displacement of the surrounding medium by the finite size of the detector. It could be defined as the point in water where the incoming particle fluence spectrum in the sensitive volume of the air-filled cavity
Next to this effect, the depth-dependent secondary charged particle fluence spectrum is leading to variations in the restricted stopping power ratios
4.2 Spectral analysis of the global fluence correction and cema conversion factors for air-filled ionization chambers
The internal fluence correction factor as discussed in Section 4.1 was calculated for a volume with approximately similar dimensions compared to the size of the sensitive volume from the PTW type 31021 Semiflex 3D. It is therefore possible to compare the course of both internal fluence correction factors as a function of energy at 0.5 cm water depth (compare pE,int for rcav = 0.25 cm shown in Figure 5A with pE,int from Figure 9A). If the volume is filled with air (Figure 9A), pE,int increases in the energy range up to 100 keV. As can be seen in Figure 5A, where the volume was filled with low-density water the increase of the internal fluence correction factor is neglected and pE,int is approximately constant. The only difference between both simulations is that the stopping-powers (on the one hand LΔ,w and on the other hand LΔ,air) differ from each other due to diverse electron densities n (∝ Z/A) and mean excitation potentials I (∝ Z) of the used media. Concerning the physical density and the size of the volume, they were quasi identical. Bouchard et al. [13] pointed out that various atomic compositions of the detector medium will cause the energy absorption to differ due to differences in the interaction cross-sections. This effect primarily influences the fluence of low-energy charged particles and was denoted by Bouchard as pfl. The influence of different stopping-powers and atomic compositions (i.e., pfl) on the fluence calculation might be a possible explanation for the increase of pE,int from Figure 9A. However, the conclusions about concerning pE,int from Section 4.1 can also be applied to air-filled ionization chambers.
With increasing complexity of the simulation geometry, it becomes difficult to derive a specific effect due to the superimposition of several influencing factors on the spectral charged particle fluence. As described in Figure 1 the decomposition into specific external effects can help to analyze the perturbation caused by different detector components on the spectral fluence in the detector. As shown in Figure 8 the spectral global fluence correction factor pE,glf is smaller than unity in the energy range from 0 to 100 keV leading to an over-response in the low-energy fluence spectrum. Figure 9, 10 showed that the presence of the central electrode is resulting in a constant higher secondary charged particle fluence in the detector cavity
Concerning the resulting total stem correction factor pstem for the PTW type 31021 calculated in this study, it is 0.998 at 10 cm which is in good agreement with findings from Wulff et al. [15, 18] for the PTW type 31010 Semiflex. Furthermore, the relatively high proportion of aluminum in the PTW 31021 stem model in comparison to the idealized stem used by Wulff et al. [15, 18] seems to have no influence on the total stem correction factor at all. At 0.5 cm depth, the stem correction factor pstem showed an amount of 0.987 and is next to the internal fluence correction factor one of the main reasons for the significantly pronounced over-response in the build-up region. The total fluence correction factor for the central electrode at 0.5 cm depth is in good agreement with simulated values from Wulff et al. [15]. In addition, the total fluence correction factor for the influence of the chamber wall on the charged particle fluence was found to be 0.2% larger.
4.3 Non-reference correction factor kNR at different depths and its influence on relative measurements
Multiple studies have been investigating the influence of non-reference conditions especially in the case of small fields [33–35]. A changed detector response for the determination of depth-dose curves or relative distributions for photon beams with ionization chambers is usually not taken into account and the correction factor kNR is assumed to be unity. There are also several studies [36, 37] that reported differences in the detector response in the build-up region depending on the choice of the EPOM. The study of Pena et al. [36] assumed that if a measurement of a percentage depth-dose curve is performed without a shift of EPOM, further depth-dependent conversion factors should be used accounting for the variations in the depth-dependent detector response. Wegener et al. [37] could reduce the influence of different detector responses on relative measurements by using detector-individually derived effective points of measurement.
This study showed that the non-reference correction factor kNR is depth-depending and varies likely by 3% for the Semiflex 3D and 2% for the SNC125c™ due to different values of the specific fluence correction factors pi from constructive details and due to the depth-depending variations in the Spencer-Attix restricted stopping power ratios in an order of approximately 0.3% (Table 3). Mainly, the spectral differences in the build-up region are due to the energy-dependent dis-equilibrium and the involved steep gradients which are responsible for the variations in the detector response under non-equilibrium conditions. Under equilibrium conditions in depths behind the dose maximum, kNR for air-filled ionization chambers varies likely by 0.2% with increasing water depth. Concerning the non-reference correction factors kNR for air-filled ionization chambers found in this study displayed good agreement with findings from Wulff et al. [15]. In further studies, the existence of δ-CPE in the build-up region and thus the validity of Eq. (14) should be investigated.
The results of this study have shown that in high-energy photon beams, the shift of EPOM is always a compromise solution and does not offer an ideal correction for all depths at the build-up region. Due to the non-linear depth-dependency of pglf or kNR shown in Table 3, it could make sense to determine the absorbed dose to water at the build-up region without the shift of EPOM and use instead detector-individually derived depth-dependent correction factors as described by Pena et al. [36]. Those depth-dependent correction factors can be obtained for individual depths and beam qualities via Monte Carlo simulations.
5 Conclusion
The cema-formalism provides the possibility to determine energy-dependent (spectral) fluence-based correction factors accounting for the detector-induced charged particle fluence disturbance and to analyze the detector response as a function of energy. In this study, spectral cema- and fluence-based correction factors for two ionization chambers were calculated with a modified version of the Monte Carlo user code egs_chamber. The step-by-step decomposition of spectral fluence-based correction factors made it possible to consider sub-factors separately from the superimposition of several influencing effects. The spectral analysis of fluence correction factors in the build-up region offered that the spectral detector response of air-filled ionization chambers is strongly affected by the depth-dependent variations in the charged particle fluence spectrum in water due to the absence of CPE. Whereas the external effects change marginally, the influence of cavity-induced effects is considerably increasing with decreasing depth. Additionally, a systematic dependency on the secondary particle’s energy could be observed for the density and displacement effect. Furthermore, a compensation of the displacement effect can not fully be achieved by the shift of the effective point of measurement 0.5 ⋅ rcav away from the focus.
Additionally, it was shown that the total fluence correction factor for a specific effect pi as tabulated in several dosimetry protocols can deviate considerably from the energy-dependent perturbation factor pE,i accounting for the same effect. It should be noticed that the total fluence correction factor pi accounts for the mean-spectral fluence disturbance weighted by the spectral fluence distribution in the detector’s sensitive volume. The characteristic fluence distribution is responsible for the fact that fluence disturbances in the low-energy spectrum are more influential regarding the resultant total perturbation factor pi than perturbations in the high-energy range. Accordingly, effects like the partially uncompensated displacement of water, which mainly affects the high-energy spectral fluence, only contribute to a small impact on the determined global fluence correction factor. Nevertheless, it should be attempted to keep the spectral fluence disturbance as low as possible no matter in which energy range of spectrum. Therefore it is necessary to further investigate the influence of different detector geometries and components on the spectral electron and positron fluence distribution in the future.
Data availability statement
The original contributions presented in the study are included in the article/Supplementary Material, further inquiries can be directed to the corresponding author.
Author contributions
The authors confirm their contribution to the paper as follows: study conception and design: JR, DC, and KZ; data collection: JR and MA; analysis and interpretation of results: JR, DC, and KZ; draft manuscript preparation: JR and DC. All authors reviewed the results and approved the final version of the manuscript.
Conflict of interest
The authors declare that the research was conducted in the absence of any commercial or financial relationships that could be construed as a potential conflict of interest.
Publisher’s note
All claims expressed in this article are solely those of the authors and do not necessarily represent those of their affiliated organizations, or those of the publisher, the editors and the reviewers. Any product that may be evaluated in this article, or claim that may be made by its manufacturer, is not guaranteed or endorsed by the publisher.
References
1.IAEA. Absorbed dose determination in external beam radiotherapy: An international code of Practice for dosimetry based on standards of absorbed dose to water. No. 398 in Technical Reports Series. Vienna: International Atomic Energy Agency (2001). updated 2006 v.12).
2. Spencer LV, Attix FH. A theory of cavity ionization. Radiat Res (1955) 3:239–54. doi:10.2307/3570326
3. Nahum AE. Water/air mass stopping power ratios for megavoltage photon and electron beams. Phys Med Biol (1978) 23:002–38. doi:10.1088/0031-9155/23/1/002
4. Almond PR, Biggs PJ, Coursey BM, Hanson WF, Huq MS, Nath R, et al. AAPM’s TG-51 protocol for clinical reference dosimetry of high-energy photon and electron beams. Med Phys (1999) 26:1847–70. doi:10.1118/1.598691
5. McEwen M, DeWerd L, Ibbott G, Followill D, Rogers DW, Seltzer S, et al. Addendum to the AAPM’s TG-51 protocol for clinical reference dosimetry of high-energy photon beams. Med Phys (2014) 41:041501. doi:10.1118/1.4866223
6.DIN6800-2. Procedures of dosimetry with probe-type detectors for photon and electron radiation - Part 2: Ionization chamber dosimetry of high energy photon and electron radiation. Technical report (Normenausschuß Radiologie (NAR) im DIN) (2020).
7.ICRU. Fundamental quantities and units for ionizing radiation. ICRU Report 60. Bethesda: International Commission on Radiation Units and Measurements (1998). 13–7. doi:10.1093/jicru/os31.1.13
8.ICRU. Key data for ionizing radiation dosimetry: Measurement standards and applications. ICRU Report 90. Bethesda: International Commission on Radiation Units (2016).
9. Kellerer AM, Hahn K, Rossi HH. Intermediate dosimetric quantities. Radiat Res (1992) 130:15–25. doi:10.2307/3578474
10. Hartmann GH, Andreo P, Kapsch R-P, Zink K. Cema-based formalism for the determination of absorbed dose for high-energy photon beams. Med Phys (2021) 48:7461–75. doi:10.1002/mp.15266
11. Bouchard H, Kamio Y, Palmans H, Seuntjens J, Duane S. Detector dose response in megavoltage small photon beams. II. Pencil beam perturbation effects. Med Phys (2015) 42:6048–61. doi:10.1118/1.4930798
12. Hartmann GH, Zink K. Decomposition of the dose conversion factor based on fluence spectra of secondary charged particles: Application to lateral dose profiles in photon fields. Med Phys (2018) 45:4246–56. doi:10.1002/mp.13081
13. Bouchard H, Seuntjens J, Carrier J-F, Kawrakow I. Ionization chamber gradient effects in nonstandard beam configurations. Med Phys (2009) 36:4654–63. doi:10.1118/1.3213518
14. Buckley L, Rogers DWO. Wall correction factors, Pwall, for thimble ionization chambers. Med Phys (2006) 33:455–64. doi:10.1118/1.2161403
15. Wulff J, Heverhagen J, Karle H, Zink K. Investigation of correction factors for non-reference conditions in ion chamber photon dosimetry with Monte-Carlo simulations. Z medizinische Physik (2010) 20:25–33. doi:10.1016/j.zemedi.2009.09.003
16. Borg J, Kawrakow I, Rogers DWO, Seuntjens JP. Monte Carlo study of correction factors for Spencer-Attix cavity theory at photon energies at or above 100 keV. Med Phys (2000) 27:1804–13. doi:10.1118/1.1287054
17. Andreo P. Monte Carlo simulations in radiotherapy dosimetry. Radiat Oncol (London, England) (2018) 13:121. doi:10.1186/s13014-018-1065-3
18. Wulff J, Heverhagen J, Zink K. Monte-Carlo-based perturbation and beam quality correction factors for thimble ionization chambers in high-energy photon beams. Phys Med Biol (2008) 53:2823–36. doi:10.1088/0031-9155/53/11/005
19. Wang LL, Rogers DWO. Calculation of the replacement correction factors for ion chambers in megavoltage beams by Monte Carlo simulation. Med Phys (2008) 35:1747–55. doi:10.1118/1.2898139
20. Wang LL, Rogers DWO. Replacement correction factors for cylindrical ion chambers in electron beams. Med Phys (2009) 36:4600–8. doi:10.1118/1.3213094
21.ICRU. Fundamental quantities and units for ionizing radiation (revised), ICRU report 85bInternational Commission on Radiation Units. Bethesda (2011) 2011:23–8. doi:10.1093/rpd/ncs077
22. Wulff J, Zink K, Kawrakow I. Efficiency improvements for ion chamber calculations in high energy photon beams. Med Phys (2008) 35:1328–36. doi:10.1118/1.2874554
23. Kawrakow I, Mainegra-Hing E, Rogers DWO, Tessier F, Walters BRB. The EGSnrc C++ class library NRCC Report PIRS-898. Ontario, Canada: National Research Council of Canada (2020).
24. Hartmann GH, Andreo P. Fluence calculation methods in Monte Carlo dosimetry simulations. Z für Medizinische Physik (2019) 29:239–48. doi:10.1016/j.zemedi.2018.08.003
25. Failing T, Hartmann G, Hensley F, Keil B, Zink K. Enhancement of the egsnrc code egs_chamber for fast fluence calculations of charged particles. Z für Medizinische Physik (2022) 32:417–27. doi:10.1016/j.zemedi.2022.04.003
26. Mohan R, Chui C, Lidofsky L. Energy and angular distributions of photons from medical linear accelerators. Med Phys (1985) 12:592–7. doi:10.1118/1.595680
27. Followill DS, Tailor RC, Tello VM, Hanson WF. An empirical relationship for determining photon beam quality in TG-21 from a ratio of percent depth doses. Med Phys (1998) 25:1202–5. doi:10.1118/1.598396
28. Rogers DWO, Bazalova-Carter M, Bolch WE, Heath EC, McNitt-Gray MF, Sempau J, et al. Records: Improved reporting of Monte Carlo RaDiation transport studies: Report of the AAPM research committee task group 268. Med Phys (2018) 45:e1–5. doi:10.1002/mp.12702
29. Kawrakow I. The EGSnrc Code System, Monte Carlo Simulation of electron and photon transport. NRCC Report PIRS-701 (2017).
30. Alissa M, Zink K, Tessier F, Schoenfeld A, Czarnecki D. Monte Carlo calculated beam quality correction factors for two cylindrical ionization chambers in photon beams. Physica Med (2022) 94:17–23. doi:10.1016/j.ejmp.2021.12.012
31. Tikkanen J, Zink K, Pimpinella M, Teles P, Borbinha J, Ojala J, et al. Calculated beam quality correction factors for ionization chambers in MV photon beams. Phys Med Biol (2020) 65:075003. doi:10.1088/1361-6560/ab7107
32. Andreo P, Burns DT, Kapsch R-P, Zink K, Vatnitsky S, Andersen CE, et al. Determination of consensus kQ values for megavoltage photon beams for the update of IAEA TRS-398. Phys Med Biol (2020) 65:095011. doi:10.1088/1361-6560/ab807b
33. Alfonso R, Andreo P, Capote R, HuqSaiful M, Kilby W, Kjäll P, et al. A new formalism for reference dosimetry of small and nonstandard fields. Med Phys (2008) 35:5179–86. doi:10.1118/1.3005481
34. Bouchard H, Seuntjens J, Duane S, Kamio Y, Palmans H. Detector dose response in megavoltage small photon beams. I. Theoretical concepts. Med Phys (2015) 42:6033–47. doi:10.1118/1.4930053
35. Kumar S, Fenwick JD, Underwood TS, Deshpande DD, Scott AJ, Nahum AE. Breakdown of Bragg–Gray behaviour for low-density detectors under electronic disequilibrium conditions in small megavoltage photon fields. Phys Med Biol (2015) 60:8187–212. doi:10.1088/0031-9155/60/20/8187
36. Pena J, Sánchez-Doblado F, Capote R, Terrón JA, Gómez F. Monte Carlo correction factors for a Farmer 0.6 cm3 ion chamber dose measurement in the build-up region of the 6 MV clinical beam. Phys Med Biol (2006) 51:1523–32. doi:10.1088/0031-9155/51/6/011
Keywords: radiation dosimetry, CEMA, charged particle fluence, detector response, perturbation factor, build-up region, Monte Carlo simulation
Citation: Roers J, Czarnecki D, Alissa M and Zink K (2023) Spectral analysis of Monte Carlo calculated fluence correction and cema conversion factors for high-energy photon beams at different depths. Front. Phys. 10:1075514. doi: 10.3389/fphy.2022.1075514
Received: 20 October 2022; Accepted: 30 December 2022;
Published: 17 January 2023.
Edited by:
Eliana Maria Vasquez Osorio, The University of Manchester, United KingdomReviewed by:
Yoichi Watanabe, University of Minnesota Twin Cities, United StatesDavide Brivio, Brigham and Women’s Hospital, Harvard Medical School, United States
Copyright © 2023 Roers, Czarnecki, Alissa and Zink. This is an open-access article distributed under the terms of the Creative Commons Attribution License (CC BY). The use, distribution or reproduction in other forums is permitted, provided the original author(s) and the copyright owner(s) are credited and that the original publication in this journal is cited, in accordance with accepted academic practice. No use, distribution or reproduction is permitted which does not comply with these terms.
*Correspondence: Julian Roers, anVsaWFuLnJvZXJzQHVuaS1tdWVuc3Rlci5kZQ==