 Wenchao Zhang
 Chenhui Su
94% of researchers rate our articles as excellent or good
Learn more about the work of our research integrity team to safeguard the quality of each article we publish.
Find out more
ORIGINAL RESEARCH article
Front. Phys., 11 November 2022
Sec. Physical Acoustics and Ultrasonics
Volume 10 - 2022 | https://doi.org/10.3389/fphy.2022.1073206
This article is part of the Research TopicNondestructive Testing, Multi-Field Information Fusion, and AI-Aided Signal ProcessingView all 7 articles
Lamb wave is widely concerned in damage detection of composite structures due to its long propagation distance and strong sensitivity to damage. In order to solve the problem of damage information extraction, high-precision imaging positioning of damage is realized. A damage location imaging method based on lamb signal spectrum is proposed. The damage location imaging of composite materials is realized by simulation and experiment respectively. Firstly, the feasibility of the algorithm is verified by simulation. The circular sensor array is arranged in the structure. Each sensor acts as an actuator and rotates clockwise to generate Lamb waves, while other sensors collect signals. The frequency spectrum of the signal is extracted to calculate the damage factor, and the probability imaging algorithm is used to realize the single damage and multiple damage location imaging. Then, the damage imaging localization is realized through experiments. Finally, the resistant noise characteristic of the proposed algorithm is analyzed. The results show that both single damage and multiple damage can be located in strong noise environment. It shows that this method can realize damage imaging directly without preprocessing the original signal. It has great potential in damage location imaging under strong noise environment.
Due to the high specific strength, high specific stiffness, excellent fatigue resistance, excellent instability resistance and post buckling performance of Carbon Fiber Reinforced Plastic (CFRP) [1–3]. So, it has a wide range of applications in the field of aerospace. At the same time, it not only improves the flight performance, but also helps to reduce the weight of the aircraft. However, in daily use, composite materials are vulnerable to the impact of birds, hail, runway debris, tool falls and other objects [4, 5]. It can cause visible external damage and invisible internal damage. Among them, invisible damage has more potential harm, and inaccurate detection may cause catastrophic events. Therefore, it is necessary to develop new detection means or methods to meet the detection requirements. If your paper is intended for a conference, please contact your conference editor concerning acceptable word processor formats for your particular conference.
With the development of sensor technology and signal processing means, nondestructive testing technology based on.
Lamb wave technology emerges as the times require [6–8]. Because of its excellent performance (such as long-distance transmission, low cost, sensitive to defects, etc.), it has become the focus of many scholars. In order to realize the damage location of CFRP, geometric location method, time of flight method, pattern recognition and other methods have been studied. Based on the combination of multi signal classification (MUSIC) and Lamb wave, Zuo Hao [9] realized the damage location of composite structures.
Due to the influence of structural anisotropy in MUSIC algorithm, there are sensor phase error and sensor position error, which leads to positioning error. Bao Q [10] proposes an anisotropic compensation MUSIC algorithm, which can jointly compensate the phase errors of different types of sensors and improve the positioning accuracy and reliability of music algorithm. The representative method of geometric location is ellipse positioning. Yang B [11] proposes a monitoring system based on Lamb wave technology to realize automatic detection and location of structural damage. The method of coordinate transformation is used to improve the ellipse positioning algorithm. It is applied to online damage location of hydrogen storage tank. In addition, the representative algorithm is time reversal focusing algorithm. Zenghua Liu [12] proposed a multi-channel time reversal focusing method based on the modified time reversal algorithm, and applied this method to the detection of various defects in large diameter and thick-walled pipes. NaokiMori [13] proposes a damage location method based on time reversal focusing of scattered Lamb waves by mode conversion. However, due to the dispersive characteristics of Lamb wave, its propagation velocity is a function of frequency and material thickness, so the wave velocity is not constant. Therefore, the method which depends on wave velocity and time difference has some limitations. In order to not rely on the characteristic parameters of the signal, scholars have developed a damage identification method based on pattern recognition. Based on Lamb wave and artificial intelligence method, A. Mardanshahi [14] proposes an intelligent model for automatic detection and classification of composite matrix cracks. Using the transmission coefficient of Lamb wave and the laser/EMAT ultrasonic signal energy, Lei Yang [15] established an artificial neural network for accurate prediction of weld penetration. The results show that the proposed method can detect the weld of structure quickly. A. De Fenza [16] combines artificial neural network and probability ellipse method to detect structural damage. Based on the wave propagation data, the damage location and damage degree of metal and composite plates are determined. Shengyuan Zhang [17] is based on one-dimensional convolution neural network and Lamb wave technology to realize structural damage identification. However, the method based on pattern recognition needs a large number of sample data, which is an important factor restricting its rapid development.
In addition, when Lamb wave is used for nondestructive testing of structures, the signal inevitably contains noise [18, 19]. Scholars have also done a lot of research on extracting effective information from the original signal. The representative methods are wavelet transform based on denoising method [20], independent component based on signal denoising method [21], empirical mode decomposition based on signal denoising method [22], principal component analysis based on signal denoising method [23]. These methods have achieved good results. However, there are few researches on damage localization without preprocessing. An ideal damage identification algorithm should only be sensitive to damage and not affected by noise. Therefore, how to extract damage features quickly and accurately in strong noise environment is an urgent problem for CFRP damage location and detection function.
In order to solve the above problems, a composite damage imaging localization method based on signal spectrum is proposed. The feasibility of this method is verified by simulation and experiment. The damage was characterized by signal spectrum and the damage factor was calculated. The damage location imaging of composite materials is realized. Finally, the resistant noise characteristic of the proposed algorithm is analyzed, and the results show that the proposed method can achieve structural damage location imaging in strong noise environment.
The current research shows that Lamb wave will produce scattering wave when it encounters damage, which leads to the change of the direct wave response signal obtained by the sensor passing through the damage path compared with the undamaged signal. Lamb wave tomography can locate and image the damage based on this change.
Lamb wave tomography [24, 25] is a kind of technology which depends on the difference between signals to realize damage localization and imaging. It does not need parameters such as wave velocity and arrival time, and does not understand the complex multimodal propagation characteristics of Lamb wave. The damage location process is divided into two parts: signal comparison and image reconstruction. When comparing the signals, the frequency spectrum of the reference signal and the damage signal is calculated, and the damage factor (
Where
According to the corresponding
The damage factor in Eq. 1 is calculated as follows.
The frequency components and frequency distribution range of dynamic signal can be obtained by spectrum analysis, and the amplitude distribution and energy distribution of each frequency component can be obtained. The frequency values of the main amplitude and energy distribution are obtained.
Frequency spectrum analysis uses Fourier transform to decompose the time domain signal and expand it according to the frequency to make it a function of frequency, and then study and process the signal in the frequency domain.
The forward Fourier transform is shown in Eq. 3 and the inverse transform is shown in Eq. 4.
Where
The above is the Fourier transform of continuous signal. Since most of the signals collected in practical engineering are discrete signals, Discrete Fourier Transform (DFT) is used in practical application. The forward transform of DFT is shown in Eq. 5 and the inverse transform is shown in Eq. 6.
Where N is the number of sampling points; n is the sequence number of discrete values in time domain; and k is the serial number of discrete values in frequency domain.
Figure 1 is a flow chart for damage location and imaging identification in composite materials. The method can be divided into seven steps as follows:
1) The Lamb wave damage detection experiment is carried out through simulation and experiment.
2) The simulation data is extracted, and the experimental data is denoised to obtain the simulation and experimental effective signals.
3) The strong noise is loaded into the effective signal respectively.
4) The frequency spectrum of the signal is obtained.
5) The damage factor is calculated according to Eq. 1.
6) The damage probability is calculated according to Eq. 2.
7) The point with the maximum damage probability is found. The damage location and imaging are realized.
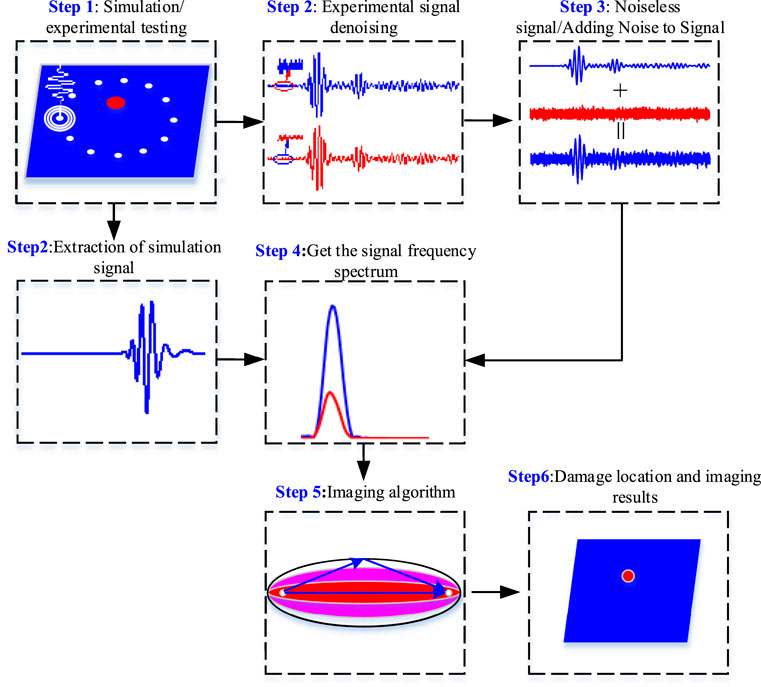
FIGURE 1. Flow chart for damage location and imaging identification of composite Manuscript Formatting.
In order to verify the feasibility of the proposed algorithm, a simulation study was first put forward. Using ABAQUS software (ABAQUS company, CA, United States), the damage of composite materials was simulated by finite element method. The geometric dimension of the composite is 600 mm × 600 mm × 2 mm, and the laying mode is [0°/90°]8. The parameters of structural materials are shown in Table 1. The actuator and sensor are responsible for sending and receiving Lamb wave signal respectively. The signal is a lamb wave signal with center frequency of 50 kHz modulated according to Eq. 7 [26]. The time domain and frequency domain waveforms are shown in Figure 2B. The location of the actuator and sensor on the CFRP is shown in Figure 2A. The grid element size is 1 mm × 1 mm, and the type is SC8R.
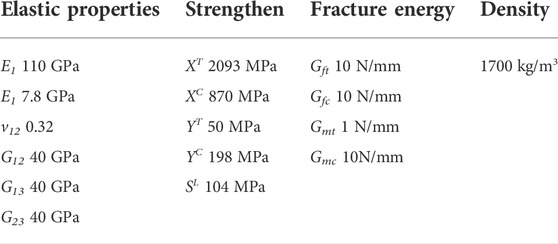
TABLE 1. Mechanical parameters of composite.
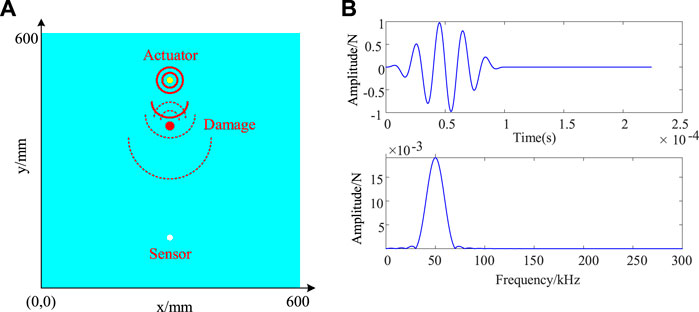
FIGURE 2. (A)Schematic diagram of actuator and sensor position. (B) High frequency excitation signal.
Fc refers to the frequency; n denotes the number of cycles in the signal window (n = 5); t represents the duration of wave propagation.
A circular array of 30 cm in diameter is formed by 12 sensors around the center point, as shown in Figure 3. The diameter of the damage is 20 mm and its coordinate position is (300.00, 375.00). In this paper, the process of Lamb wave from excitation to receiving is briefly described as follows:
1) The Lamb wave signal is excited in S1 sensor, and the Lamb wave propagates in the structure.
2) The remaining 11 sensors collect and store the structural response signal.
3) Select the sensor S2 to excite the Lamb wave signal clockwise, and other sensors collect the response signal.
4) Until the rotation until the sensor S12 is excited and other sensors complete the signal acquisition.
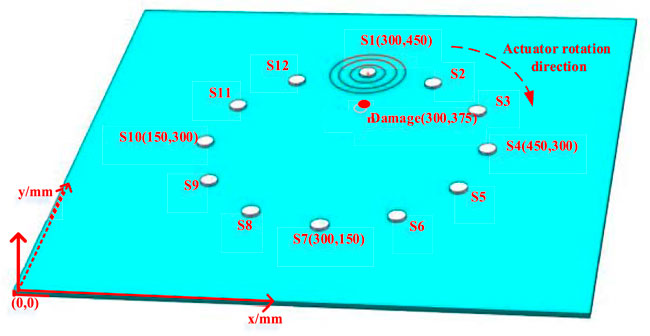
FIGURE 3. Schematic diagram of sensor and single damage location.
Figures 4A,B show that when sensors S1 and S5 generate excitation signals, sensors S7 and S9 receive signals before and after damage, respectively. As can be seen in Figure 3, the damage is located in the S1–S7 sensing channel, so the direct wave signal received by sensor S7 is weakened due to the damage scattering lamb signal. This change can be characterized by frequency spectrum. On the contrary, there is no damage in the S5–S9 sensing channel, so there is no change in the signal received by sensor S9.
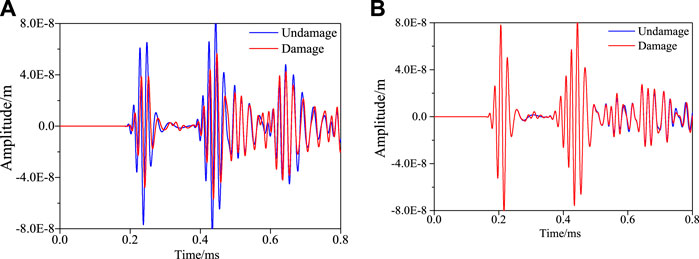
FIGURE 4. Signal comparison before and after damage.(A) S1–S7 single sensing channel. (B) S5−S9 single sensing channel.
According to Eqs 5, 6, the frequency spectra of the signals in Figures 4A,B are calculated, respectively. The calculation results are shown in Figures 5A,B.
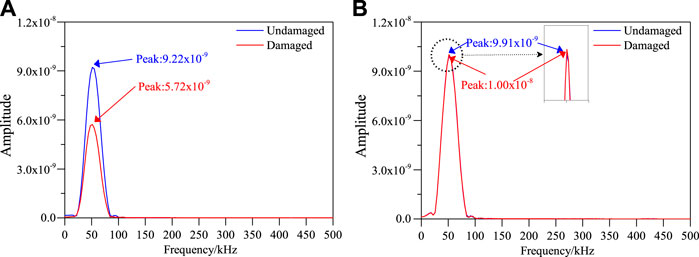
FIGURE 5. Comparison of Frequency spectrum of signals before and after damage.(A) S1–S7 single sensing channel. (B) S5–S9 single sensing channel.
As can be seen from Figure 5A, the peak values of frequency spectrum are 9.22 × 10⁻⁹ and 5.72 × 10⁻⁹, respectively, when there is no damage or damage in the structure. The frequency spectrum of the signal before and after the damage changes greatly. This is because the damage causes the signal scattering, which weakens the signal received by the sensor. As can be seen from Figure 5B, the peak values of frequency spectrum are 9.91 × 10⁻⁹ and 1.00 × 10⁻⁸, respectively, when there is no damage or damage. The frequency spectrum of the signal before and after the damage changes little. This shows that the frequency spectrum proposed in this paper can fully represent the damage information.
Then the frequency spectrum of other sensing channels is calculated in turn. The damage factor was calculated according to Eq. 1. Replace Eq. 2 to realize damage location and imaging. The results are shown in Figure 6. Among them, each pixel represents 0.1 mm, and the upper right corner of the image is the result of threshold localization.
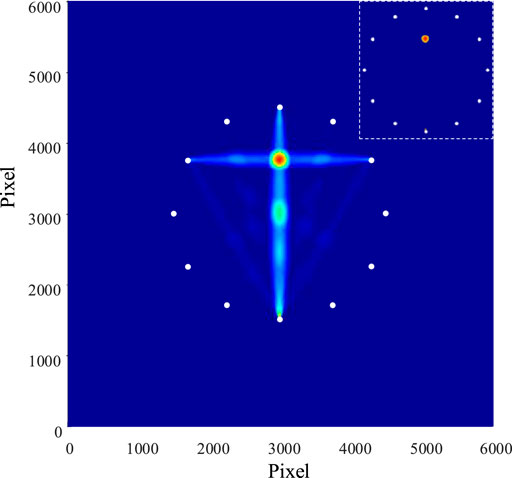
FIGURE 6. Single damage imaging result.
In Figure 6, the damage imaging coordinate position is (300.10, 376.20). The radial error is introduced to characterize the positioning effect:
Among them, (
The parameters of multi damage simulation are consistent with that of single damage simulation, but only one damage is added. The coordinates of the two damages were (300.00, 375.00) and (300.00, 245.00), respectively. The 12 sensors and two damage locations are shown in Figure 7.

FIGURE 7. Schematic diagram of sensor and multi-damage location.
Extract the signal of S1-S7 signal sensing channel and S5-S9 signal sensing channel before and after damage, as shown in Figures 8A,B. It can be seen from the figure that the amplitude of direct wave signal decreases obviously after damage.
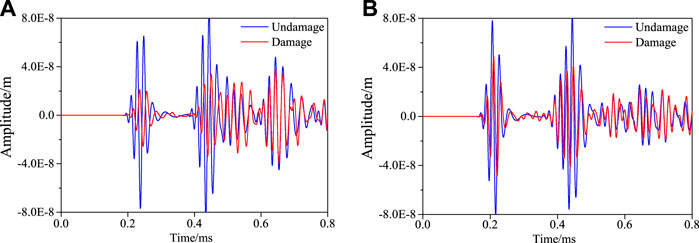
FIGURE 8. Comparison of signals before and after damage. (A) S1–S7 single sensing channel. (B) S5–S9 single sensing channel.
Calculate the frequency spectrum of the four signals in Figure 8, as shown in Figure 9. It can be seen that the frequency spectrum of the signal is obviously different due to the damage.
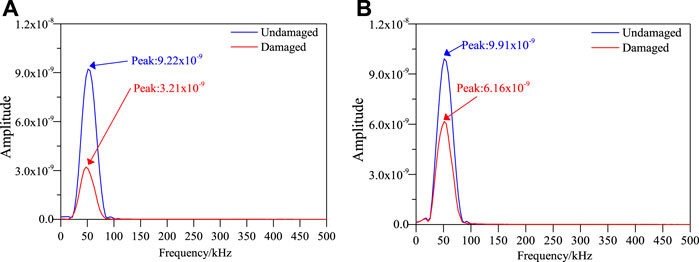
FIGURE 9. Comparison of frequency spectrum of signals before and after damage. (A) S1−S7 single sensing channel. (B) S5−S9 single sensing channel.
The damage factors of all sensing channels are calculated by Eq. 1, and the damage location imaging is carried out according to Eq. 2. The results are shown in the following figure.
In Figure 10, the results of imaging location coordinates were (301.30, 376.20) and (301.10, 243.20), According to Eq. 8, the radial errors are 1.77 mm and 2.11 mm, respectively.
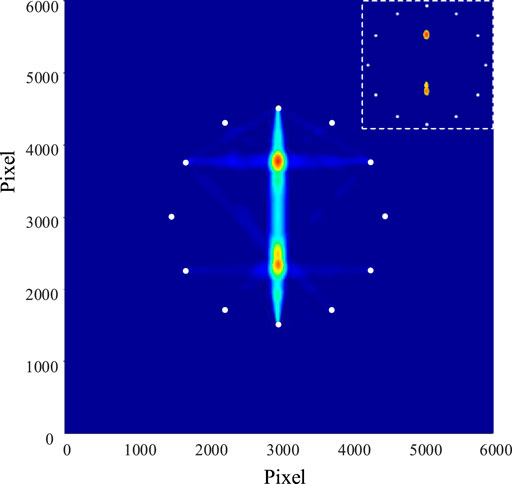
FIGURE 10. Multiple damages imaging result.
In the experimental study, the size of the composite is 600 mm × 600 mm × 2 mm, and the stacking order is [0°/90°]8. 12 sensors with a diameter of 30 cm are evenly arranged on the surface around the centre point. The sensor arrangement is consistent with the simulation, as shown in Figure 3.
The experimental system is shown in Figure 11. It consists of an arbitrary function generator (Rigoldg5252) for sending signals, a linear broadband power amplifier (Krohn-Hite 7602M) for amplifying signals, a multichannel oscilloscope (Tektronix MDO4034B-3) for signal acquisition, and a computer.
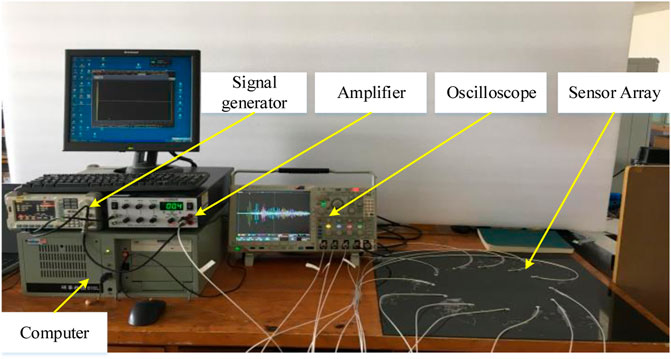
FIGURE 11. Photograph of Lamb Wave Tomography experimental system.
The damage is simulated by changing the local strain field of the structure by mass block [9, 26]. For a single damage, a mass block of 30 mm × 10 mm × 40 mm is pasted at the coordinate position (315.00, 375.00). For multiple damages, paste a 20 mm high cylinder block based on a single damage at coordinates (295.00, 220.00). The signal from the signal generator is consistent with the simulation, and the excitation frequency is also 50 k Hz. In the process of signal acquisition, the sampling frequency of oscilloscope is 10 M Hz. The lamb waves are inevitably disturbed by noise. In order to get the effective signal, the wavelet method is used to filter the signal noise.
Figures 12A,B show the signals collected by sensors on the sensing channels S1–S7 and S5–S9 before and after damage. It can be seen that the direct waves of signals on S1–S7 sensor channel have great changes before and after damage. This is because the damage located in the sensor channel scatters part of the direct wave. However, there is no damage on the S5–S9 sensor channel, so the signal changes little before and after the damage.
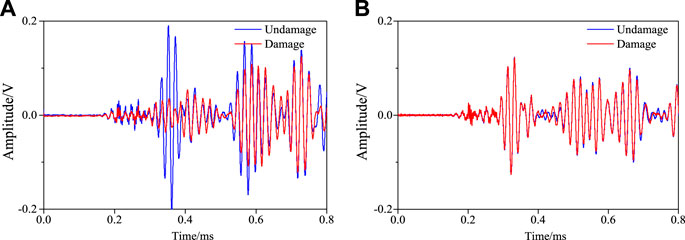
FIGURE 12. Response signals with different sensing channels in case of single damage. (A) S1–S7 single sensing channel. (B) S5–S9 single sensing channel.
The frequency spectrum of the four signals in Figure 12 was calculated, and the results in Figure 13 were obtained. It can be seen that the damage causes the frequency spectrum of the signal to change, and the damage information can be characterized by calculating the damage factor.
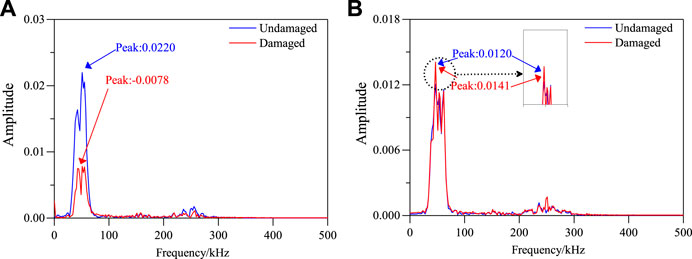
FIGURE 13. Comparison of Frequency spectrum of signals before and after damage. (A) S1–S7 single sensing channel. (B) S5–S9 single sensing channel.
The frequency spectrum of all sensor channel signals is calculated. Damage factor is calculated according to Eq. 1. Finally, the structural damage localization imaging as shown in Figure 14 is obtained.
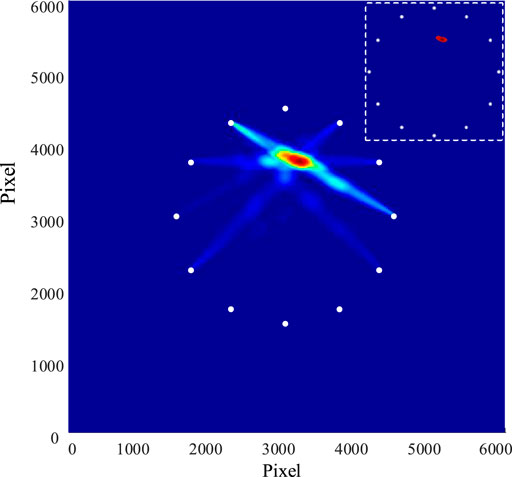
FIGURE 14. Single damage imaging result.
The result of imaging location coordinate is (321.10, 375.80), According to Eq. 8, the radial error is 6.15 mm.
In the same way, the multi damage location method is the same as that of single damage location. Figure 15 is a simultaneous interpreting sensor signal on different sensing channels. Calculate the frequency spectrum of the signal, as shown in Figure 16. It can be seen that the presence of damage leads to the change of signal and its frequency spectrum.
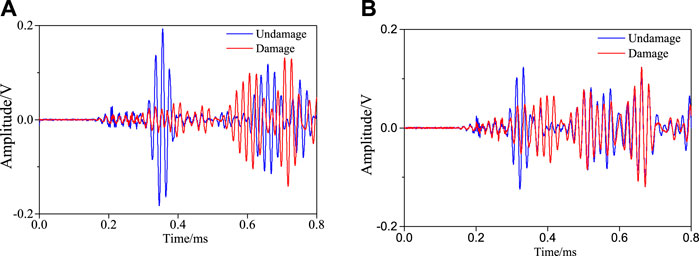
FIGURE 15. Response signals with different sensing channels in case of multiple damage. (A) S1–S7 single sensing channel. (B) S5–S9 single sensing channel.
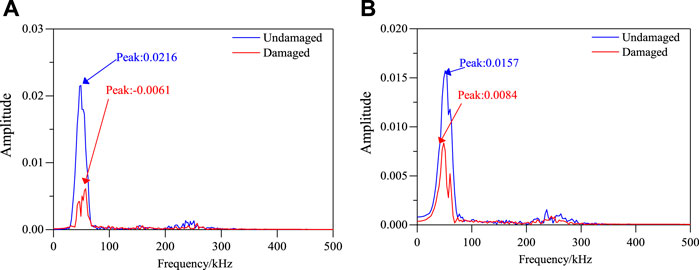
FIGURE 16. Frequency spectrum of different signal pathways before and after damage. (A) S1–S7 single sensing channel. (B) S5–S9 single sensing channel.
The damage factor of each channel is calculated and the damage location imaging is carried out. The results are shown in Figure 17.

FIGURE 17. Multiple damages imaging result.
The coordinates of the two damages are (310.30, 379.10) and (304.00, 217.20) respectively. The radial errors are 6.24 mm and 9.43 mm, respectively.
Any detection technology in nature will inevitably be affected by the environment. Noise has a certain impact on the accuracy of detection data and damage identification and location. The proposed damage factor calculation method must have a certain resistant noise characteristic analysis to have practical engineering significance.
Since it is difficult to obtain the signal under strong noise in the laboratory environment, the noise (SNR = 3 dB) is loaded into the effective signal to simulate the signal collected in the strong noise environment.
In this paper, the experimental data are analyzed. Strong noise is added to the four signals in Figure 12, and the frequency spectrum of each signal is calculated, as shown in Figures 18–21, respectively.
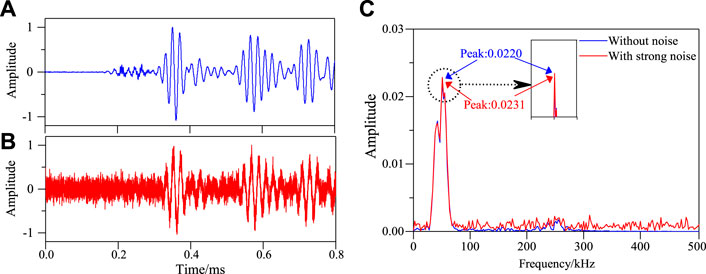
FIGURE 18. Frequency spectrum of S1–S7 sensing channel without damage in structure under strong noise environment. (A) Effective signal-undamaged.(B) After adding 3 dB with noise. (C) Frequency spectrum of S1–S7 signal sensing channel.
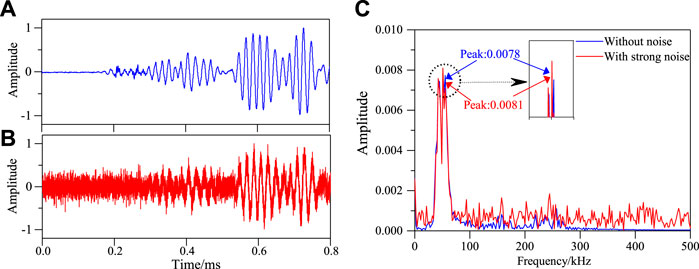
FIGURE 19. Frequency spectrum of S1–S7 sensing channel damage in structure under strong noise environment. (A) Effective signal-damaged. (B) After adding 3 dB with noise. (C) Frequency spectrum of S1–S7 signal sensing channel.
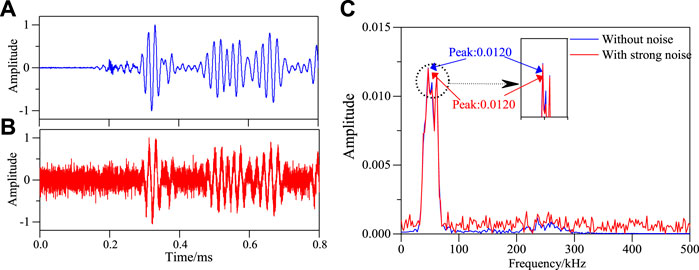
FIGURE 20. Frequency spectrum of S5–S9 sensing channel without damage in structure under strong noise environment. (A) Effective signal-undamaged. (B) After adding 3 dB with noise. (C) Frequency spectrum of S5–S9 signal sensing channel.
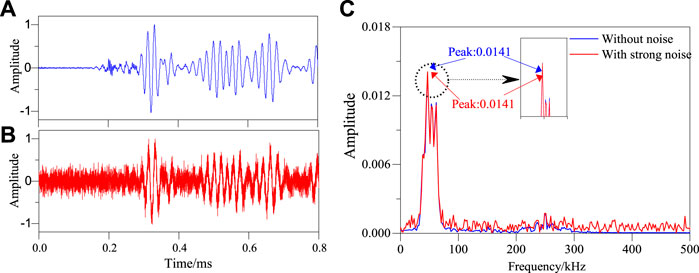
FIGURE 21. Frequency spectrum of S5–S9 sensing channel damage in structure under strong noise environment. (A) Effective signal-damaged. (B) After adding 3 dB with noise. (C) Frequency spectrum of S5–S9 signal sensing channel.
It can be seen from Figures 18–21 that the maximum value of spectrum with and without noise signal is basically the same. Then the damage factors of all channel signals are calculated. Single damage location imaging of structure in noise environment is realized, as shown in Figure 22.
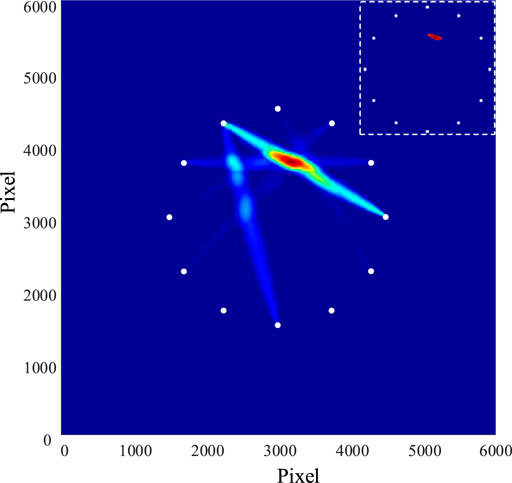
FIGURE 22. Single damage imaging results in strong noise environment.
In Figure 22, the specific location of the damage is (320.80, 376.10). According to Eq. 8, the damage location error is 5.90 mm.
It can be seen from Figures 23–26 that the noise has little effect on the maximum value of the frequency spectrum of the signal. Then the damage factor is calculated, and finally the damage location imaging is realized, as shown in Figure 27.
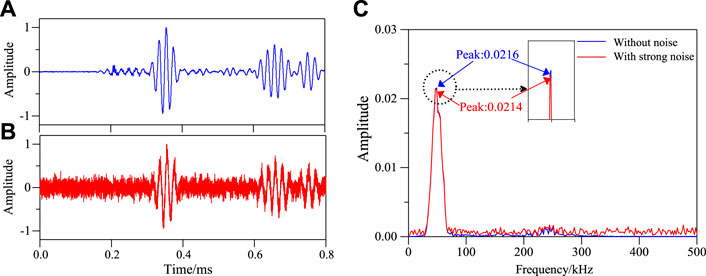
FIGURE 23. Frequency spectrum of S1–S7 sensing channel without damage in structure under strong noise environment. (A) Effective signal-undamaged. (B) After adding 3 dB with noise. (C) Frequency spectrum of S1–S7 signal sensing channel.
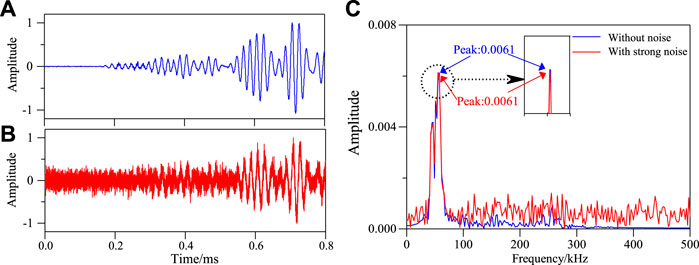
FIGURE 24. Frequency spectrum of S1–S7 sensing channel without damage in structure under strong noise environment. (A) Effective signal-undamaged. (B) After adding 3 dB with noise. (C) Frequency spectrum of S1–S7 signal sensing channel.
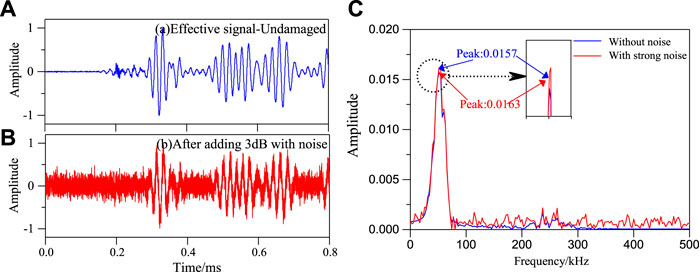
FIGURE 25. Frequency spectrum of S5–S9 sensing channel without damage in structure under strong noise environment. (A) Effective signal-undamaged. (B) After adding 3 dB with noise. (C) Frequency spectrum of S5–S9 signal sensing channel.
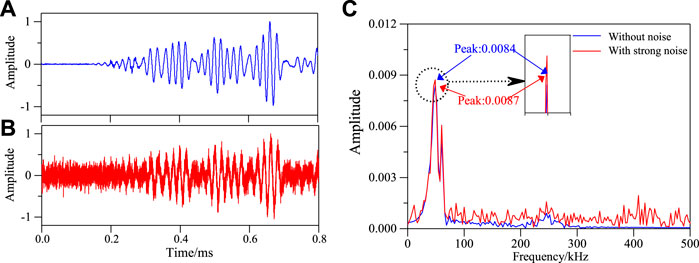
FIGURE 26. Frequency spectrum of S5–S9 sensing channel damage in structure under strong noise environment. (A) Effective signal-damaged. (B) After adding 3 dB with noise. (C) Frequency spectrum of S5–S9 signal sensing channel.

FIGURE 27. Multiple damage imaging results in strong noise environment.
In Figure 27, the exact coordinates of the two damages are (321.30, 376.10) and (308.60, 216.00). The radial positioning errors are 6.40 mm and 14.18 mm, respectively.
In this paper, a composite damage location and imaging method based on Lamb wave spectrum detection is proposed. The spectrum of signal is used to represent the damage information, and Lamb wave tomography is used to locate and image the damage. The results show that the proposed method can achieve damage location and imaging. The main conclusions are as follows:
1) The damage factor calculation method based on signal spectrum proposed in this paper is effective and feasible.
2) The simulation and experimental results show that the proposed method can achieve single damage and multiple damage location imaging.
3) The noise immunity of the proposed method is analyzed. This method can avoid noise interference. It is worth mentioning that there is no need to preprocess the signal, and the signal containing noise can be used to locate the damage.
The original contributions presented in the study are included in the article/supplementary material, further inquiries can be directed to the corresponding author.
WZ and CS: methodology; WZ and YZ: software; CS and HY: formal analysis; CS:writing, reviewing and editing.
This work was supported by the Doctoral Research Fund Project of Shandong Jianzhu University under Grant X21037Z, Shandong Province Natural Science Foundation, China, ZR2021QF118.
The authors declare that the research was conducted in the absence of any commercial or financial relationships that could be construed as a potential conflict of interest.
All claims expressed in this article are solely those of the authors and do not necessarily represent those of their affiliated organizations, or those of the publisher, the editors and the reviewers. Any product that may be evaluated in this article, or claim that may be made by its manufacturer, is not guaranteed or endorsed by the publisher.
1. Wu J, Xu X, Liu C, Deng C, Shao X. Lamb wave-based damage detection of composite structures using deep convolutional neural network and continuous wavelet transform. Compos Structures (2021) 276(3):114590. doi:10.1016/j.compstruct.2021.114590
2. Liu C, Yu J, Zhang B, Zhang X, Elmaimouni L. Analysis of Lamb wave propagation in a functionally graded piezoelectric small-scale plate based on the modified couple stress theory. Compos Structures (2021) 265(2):113733. doi:10.1016/j.compstruct.2021.113733
3. Ding X, Xu C, Deng M, Zhao Y, Bi X, Hu N. Experimental investigation of the surface corrosion damage in plates based on nonlinear lamb wave methods. Ndt E Int (2021) 121:102466. doi:10.1016/j.ndteint.2021.102466
4. James R, Giurgiutiu V. Towards the generation of controlled one-inch impact damage in thick CFRP composites for SHM and NDE validation. Composites B: Eng (2020) 203:108463. doi:10.1016/j.compositesb.2020.108463
5. Liu H, Liu J, Ding Y, Hall ZE, Kong X, Zhou J, et al. .A three-dimensional elastic-plastic damage model for predicting the impact behaviour of fibre-reinforced polymer-matrix composites. Composites Part B: Eng (2020) 201:108389. doi:10.1016/j.compositesb.2020.108389
6. Gao F, Shao Y, Hua J, Zeng L, Lin J. Enhanced wavefield imaging method for impact damage detection in composite laminates via laser-generated Lamb waves. Measurement (2020) 173:108639. doi:10.1016/j.measurement.2020.108639
7. Feng B, Ribeiro AL, Ramos HG. Interaction of Lamb waves with the edges of a delamination in CFRP composites and a reference-free localization method for delamination. Measurement (2017) 120:424–31. doi:10.1016/j.measurement.2017.10.016
8. Gorgin R, Luo Y, Wu Z. Environmental and operational conditions effects on lamb wave based structural health monitoring systems: A review. Ultrasonics (2020) 105:106114. doi:10.1016/j.ultras.2020.106114
9. Zuo H, Yang Z, Xu C, Tian S, Chen X. Damage identification for plate-like structures using ultrasonic guided wave based on improved MUSIC method. Compos Structures (2018) 203(NOV):164–71. doi:10.1016/j.compstruct.2018.06.100
10. Bao Q, Yuan S, Wang Y, Qiu L. Anisotropy compensated MUSIC algorithm based composite structure damage imaging method. Compos Structures (2019) 214(APR):293–303. doi:10.1016/j.compstruct.2019.02.036
11. Yang B, Xiang Y, Xuan FZ, Hu C, Xiao B, Zhou S, et al. .Damage localization in hydrogen storage vessel by guided waves based on a real-time monitoring system. Int J Hydrogen Energ (2019) 44(40):22740–51. doi:10.1016/j.ijhydene.2019.01.009
12. Liu Z, Xu Q, Gong Y, He C, Wu B. A new multichannel time reversal focusing method for circumferential Lamb waves and its applications for defect detection in thick-walled pipe with large-diameter. Ultrasonics (2014) 54(7):1967–76. doi:10.1016/j.ultras.2014.05.004
13. Mori N, Biwa S, Kusaka T. Damage localization method for plates based on the time reversal of the mode-converted Lamb waves. Ultrasonics (2019) 91:19–29. doi:10.1016/j.ultras.2018.07.007
14. Mardanshahi A, Nasir V, Kazemirad S, Shokrieh M. Detection and classification of matrix cracking in laminated composites using guided wave propagation and artificial neural networks. Compos Structures (2020) 246:112403. doi:10.1016/j.compstruct.2020.112403
15. Yang L, Ume IC. Measurement of weld penetration depths in thin structures using transmission coefficients of laser-generated Lamb waves and neural network. Ultrasonics (2017) 78:96–109. doi:10.1016/j.ultras.2017.02.019
16. De Fenza A, Sorrentino A, Vitiello P. Application of artificial neural networks and probability ellipse methods for damage detection using lamb waves. Compos Structures (2015) 133:390–403. doi:10.1016/j.compstruct.2015.07.089
17. Zhang S, Li C, Ye W. Damage localization in plate-like structures using time-varying feature and one-dimensional convolutional neural network. Mech Syst Signal Process (2021) 147:107107. doi:10.1016/j.ymssp.2020.107107
18. Xiao C, Chen-Long W. Noise suppression for Lamb wave signals by Tsallis mode and fractional-order differential. Acta Phys Sin (2014) 63(18):184301. doi:10.7498/aps.63.184301
19. Chen X, Wang C. Noise removing for Lamb wave signals by fractional differential. J Vibroengineering (2014) 16(6):2676–84.
20. Ranta R, Louis-Dorr V, Heinrich C, Wolf D. Iterative wavelet-based denoising methods and robust outlier detection. IEEE Signal Process Lett (2005) 12(8):557–60. doi:10.1109/lsp.2005.851267
21. Wenbo W, Xiaodong Z, Xiangli W. Chaotic signal denoising method based on independent component analysis and empirical mode decomposition. Acta Physica Sinica 62(5):050201. doi:10.7498/aps.62.050201
22. Qian L, Xu G, Tian W, Wang J. A novel hybrid EMD-based drift denoising method for a dynamically tuned gyroscope (DTG). Measurement (2009) 42(6):927–32. doi:10.1016/j.measurement.2009.01.017
23. Zvokelj M, Zupan S, Prebil I. Non-linear multivariate and multiscale monitoring and signal denoising strategy using Kernel Principal Component Analysis combined with Ensemble Empirical Mode Decomposition method. Mech Syst Signal Process (2011) 25(7):2631–53. doi:10.1016/j.ymssp.2011.03.002
24. Wang S, Wu W, Shen Y, Liu Y, Jiang S. Influence of the PZT sensor array configuration on lamb wave tomography imaging with the RAPID algorithm for hole and crack detection. Sensors (2020) 20(3):860. doi:10.3390/s20030860
25. Qiang W, Chen Z, Dongchen JI. Study on nonlinear lamb wave based structural fatigue damage tomography. J Basic ence Eng (2019) 27(3):686–94. doi:10.16058/j.issn.1005-0930.2019.03.019
Keywords: composites, damage location, frequency spectrum, lamb wave tomography, nondestructive testing
Citation: Zhang W, Su C, Zhang Y and Yang H (2022) Locating and imaging composite damage based on frequency spectrum detection of lamb waves. Front. Phys. 10:1073206. doi: 10.3389/fphy.2022.1073206
Received: 18 October 2022; Accepted: 26 October 2022;
Published: 11 November 2022.
Edited by:
Bo Feng, Huazhong University of Science and Technology, ChinaCopyright © 2022 Zhang, Su, Zhang and Yang. This is an open-access article distributed under the terms of the Creative Commons Attribution License (CC BY). The use, distribution or reproduction in other forums is permitted, provided the original author(s) and the copyright owner(s) are credited and that the original publication in this journal is cited, in accordance with accepted academic practice. No use, distribution or reproduction is permitted which does not comply with these terms.
*Correspondence: Chenhui Su, c3VjaGVuaHVpMjAxMEAxNjMuY29t
Disclaimer: All claims expressed in this article are solely those of the authors and do not necessarily represent those of their affiliated organizations, or those of the publisher, the editors and the reviewers. Any product that may be evaluated in this article or claim that may be made by its manufacturer is not guaranteed or endorsed by the publisher.
Research integrity at Frontiers
Learn more about the work of our research integrity team to safeguard the quality of each article we publish.