 Saleh A. Alhaidari1
 Sulaiman A. Alarifi
- 1Saudi Aramco, Dhahran, Saudi Arabia
- 2Department of Petroleum Engineering, King Fahd University of Petroleum and Minerals, Dhahran, Saudi Arabia
Lost circulation is one of the most significant contributors to wellbore instability and causes an increase in drilling operation costs. It is also a major contributor to the nonproductive time and must be minimized for improved economic and operational performance. The objective of this research is to provide tools and information about specific loss circulation management techniques that drillers can use to minimize lost circulation. This study involves comprehensive approaches to test the plugging efficiency of three different lost circulation materials (LCMs) from two groups of materials (flaky and fibrous). It also highlights the carrier fluids (drilling fluids) and the determination of the optimum drilling fluid properties. Different fracture sizes and the effect of the various LCM are analyzed. The impact of LCM’s shape, size, and physical and chemical properties along with the fracture sizes is discussed. Examining the particle size distribution before and after mixing with the fluids shows the capability of the materials in plugging the fracture while maintaining the minimum porosity and permeability of the plug. It also helps to strengthen the fracture gradient of the formation by knowing the actual particle sizes. The primary objective of this work is to precisely study and analyze these factors on the three LCMs along with different carrier fluids to investigate their plugging efficiency and potentially resolve or minimize the severity of the lost circulation problem.
1 Introduction
To meet the world’s energy needs, the oil and gas production industry is expected to provide the supply needed to meet this demand. Therefore, more wells with formidable challenges will be required. These wells, with extended vertical depth and extended reach laterals, make drilling operations more complex. Major obstacles contribute to the cost of the operation. Some of these obstacles are not controllable such as geological complexity and weak formations with low fracture gradients. Lost circulation events typically occur in these situations. One of the causes of lost circulation is tensile failure [1]. Aadnøy and Chenevert showed the types of borehole problems which cause lost circulation problems. When wellbore pressure exceeds the fracture pressure, the fracture occurs; on the other hand, with a lower wellbore pressure, wellbore collapse might occur.
1.1 Effects of lost circulation
Loss of drilling fluids into the formation has a tremendous impact on the drilling operation. This impact can be operational problems that can have an adverse effect on the well. In addition, another impact is the extra cost associated with this problem.
Lost circulation could cause an interruption to the well delivery or loss of the well. One of the examples that would be a result of lost circulation is a well control situation. Loss of hydrostatic pressure due to a mud level drop could cause a kick and the situation may become a blowout or result in the loss of lives [2].
The cost associated with lost circulation incidents is remarkable. It costs the industry about one billion dollars annually despite the fact that the treatment cost comes with no benefits [3]. According to Ivan et al., lost circulation treatments are causing a loss of 200 million dollars annually mainly due to the cost of materials [4]. The cost of mud lost into the formation comes with a high figure and is equivalent to 1.8 million barrels of drilling fluids lost into the formation [5]. The overall economic impact of the lost circulation problem is 20%–40% of total drilling costs [6]. Lost circulation events can occur while drilling, tripping, and during any other operational activity. Losses are classified according to the rate of losses; that is, seepage losses are in the range of 1–10 bbl/hr, partial losses are 10–500 bbl/hr, and complete losses are 500 bbl/hr or greater, as shown in Table 1 [7].
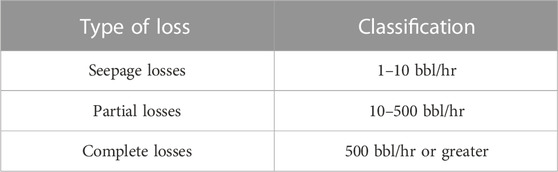
TABLE 1. Classification of losses [7].
1.2 Wellbore strengthening techniques
Wellbore strengthening is a technique used to enhance the fracture gradient by sealing and plugging the pore throat in a weak formation to avoid the induced fracture. This technique results in widening the mud weight window [8]. The main objective is to increase the formation pressure so that the formation can sustain additional drilling fluid pressure without inducing a fracture and lost circulation events will be avoided [9]. Many models are presented in the literature to address the concept of wellbore strengthening. The first model is called the “stress cage model,” which is based on the linear elastic analysis. The model was introduced by Alberty and McLean [10] and based on the LCM forming a seal in the fracture mouth with the result of increasing the hoop stress, which leads to an increase in the fracture gradient. The second model is fracture closure stress developed by Dupriest [11]. This model explains the change of the hoop stress by sealing the fracture tip. The third model uses elastic–plastic fracture analysis and was introduced by Aadnøy and Belayneh [12]. The model drives the enhancement of the fracture gradient and increases fracture resistance by two main mechanisms. The mechanisms involve the mud-cake plastic deformation that seals the fracture mouth and the type and concentration of the LCM used. This model is pivotal to improving the fracture gradient [13].
The next model, named as “fracture propagation resistance,” was built based on the Drilling Engineering Association experimental work. In their experiments, they used 30-in3 shale blocks to investigate lost circulation events [14]. The results showed rock failure analysis using Young’s modulus and Poisson’s ratio, and carrier fluids and wellbore diameter affect lost circulation event. The study also revealed that there is a relation between the mud-cake thickness and the fracture reopening pressure [15]. The fracture propagation resistance model emphasizes a new concept, which indicates that the increase in the fracture gradient is strongly related to the fracture propagation pressure at the fracture tip. The output of the fracture propagation resistance model implies that the sealing of the fracture mouth by LCM could enhance the hoop stress around the wellbore. The last model takes a different direction and uses the three-dimensional poroelastic finite-element model [16]. This work concluded that the wellbore hoop stress enhancement estimates fracture initiation, propagation, and sealing mechanism.
1.3 Lost circulation management
Proper lost circulation management considers all factors involved. Lost circulation management is not only based on how stiff and rigid the materials are but also considers other factors to cure the losses. The material selection, or the pill designed, is the last stage of lost circulation management and comes after the preventive and proactive management stages. Lost circulation management starts with the best design of the drilling parameters, which encompasses the geomechanical model to avoid the creation of induced fractures. Then the drilling fluids are selected which involve the proper rheological properties and include the effect of the fluid and material interaction. The wellbore strengthening technique is the third factor to enhance the fracture gradient and to avoid inducing fractures. This technique depends on the LCM particle size distribution. All these stages are called lost circulation preventive design. The last stage, which is the selection of the lost circulation material, is called remedial action [17].
1.4 Lost circulation material
The solid particles that are mixed and pumped to control a lost circulation problem that has occurred are called LCM. Lost circulation management focuses on selecting the right material to cure the losses as an essential part of the treatment. The industry categorizes LCM into seven different types. Due to the different formations and situations of the problem, there is no single material that can be suitable to cure all types of losses. The history of LCM started in 1951 by Howard and Scott. The initial classification was based on four categories only: dehydratable, flaky, fibrous, and granular. Then in 1956, White added a mixture of all previous materials [19]. Alsaba added more types to the list of LCMs including water-soluble and acid-soluble types [5]. The distinctions of these types of LCMs are as follows: one of the LCM classifications is by appearance, and other ways to classify the materials are by application and physical and chemical properties. The chemical properties are the reactivity of the LCMs with other chemicals in the drilling fluids, which include acid solubility and swelling reaction. The physical properties are mainly the size and shape of the LCM [5] which is also one of the main parts of our study in this work. The selection of which material to use is dependent on many factors such as geological formation description, fluid loss mechanisms (fracture types), and rate of loss. In this work, the LCMs used are classified into two groups based on the raw material properties, that is, flaky and fibrous.
The physical description of flaky materials is that the particle shape has a large flat and thin surface area with low stiffness [7,18]. This type of material can be used to mat shingles over the formation face [19]; however, due to its low stiffness and strength, the flaky material usually provides optimal coverage during the placement process, which makes it a last option in the treatment plan [5,9].
The fibrous material can form a mat-like bridge across vugular and fractured formations to form an effective seal [9]. It has a long and slender shape with low stiffness. It is an organic material with a distinctive particle size distribution. Natural cellulose fiber is one of the fibrous materials [20].
1.5 Particle size and shearing effect
As shown in the literature, the particle size distribution of the LCM is the only widely used method to design and plan the sealing or plugging mechanism to stop a lost circulation event. One of the criteria for selecting which material to use is a correlation between the particle size and the fracture width. However, this assumes that the selected size will be maintained when it reaches the thief zone or fracture [21]. Many publications addressed that most of the materials are degrading with high shearing but did not confirm or quantify the material size degradation rate and its impact on the ability of the LCM to plug the fracture. This work will answer the question of the relationship between size degradation and its quantifying effect to plug the fracture [22].
Size degradation is due to mechanical shearing or a dynamic force that acts on the particles by the mud pumps, drill string, wellbore annulus, and bit nozzles [23]. Plugging the fracture or enhancing the fracture gradient by LCM may be affected by size degradation. However, the degradation rate of the material particle size does not necessarily demonstrate a low plugging efficiency [21].
As the LCM is degraded by the mechanical shear, not only does the size change, but the shape also deteriorates and becomes more rounded [2]. Gaurina-Medjimurec and Pasic showed the proper bridging mechanism and illustrated the optimum size selection that allows the material to bridge as shown in the upper right side, while the smaller size due to size degradation forms no seal [24]. Therefore, to achieve effective bridging, the material size distribution must be small enough to enter the fracture or pore throat while being large enough to build the bridge.
The two crucial terminologies which are often incorrectly used are bridge and seal. Bridging provides the mechanical strength to the formation having a large permeability technique by using large particles; small particles will fill the void spaces between the large ones to form the seal [2]. Lavrov demonstrated the bridging and sealing mechanism in three different situations. The first situation is the fracture before adding the material, the second situation is the ineffective bridging when only large particles are used, and the third situation is the optimum conditions required for bridging and sealing using large particles to create bridging and fine particles to develop sealing [2].
1.6 Size degradation
Selecting the proper size for a fracture or a permeable formation is the primary factor in minimizing fluid invasion. It has been noted that when the materials are exposed to high shear, they might experience size degradation [25]. The type of materials, shearing rate, the fluid used, and the dry particle size distribution (PSD) will drive the severity of the degradation and lead to information on the corrective action that can be taken during the treatment to achieve the required plugging and sealing needed. Little data are published describing the LCM size degradation phenomena [25]. In this work, an industry-standard approach was followed to comprehensively measure and analyze the size degradation of the concerned materials with the designed fluids. The sieve analysis was conducted, including material behavior when exposed to the fluids, and the results revealed the size expansion or reduction of the LCMs. The minus sign represents the percentage of size reduction, and a plus sign is used to show the percentage of size expansion. A comprehensive experimental study on the LCM will add a significant value to performance of future drilling operations to eliminate lost circulation events or make the problem less severe. Controlling and curing the losses involves more than just selecting the proper size and strength of the LCM. Detailed engineering approaches and techniques are required to deeply understand available solutions, and the current lack of an encompassing methodology requires a re-examination of the related factors to implement the best solution based on a specific situation. The significance of this work lies in assisting the industry in developing the optimum lost circulation mitigation procedure and material utilization in an engineering approach.
2 Materials and methods
2.1 Materials
2.1.1 Lost circulation materials
In this work, the LCMs used are classified into two groups based on the raw material properties, flaky and fibrous, as shown in Table 2. The flake group includes a sized grade of mica and flaked calcium carbonate. The fibrous group includes a raw material of natural cellulose fiber. Each of these raw materials is sold under a variety of trade names as many companies manufacture almost similar or even identical materials but with different trade names.
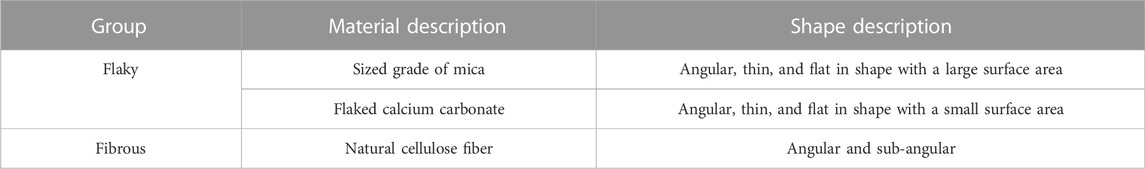
TABLE 2. LCM groups with corresponding raw materials and dry phase shape description.
2.1.2 Carrier fluids
For drilling fluids or carrier fluids, four different fluid systems are used which are the same fluids used in our previous publication [21]. The four water-based fluid systems: water–bentonite mix (clay system), water–polymer mix (polymer system), and polymer–salt systems using NaCl and CaCl2 salts. The polymer used was xanthan gum, which is a hydrocolloid polymer. For the first polymer–salt system, 15 wt% NaCl was added, while for the second polymer–salt system, 20 wt% CaCl2 was added [21]. Table 3 shows the carrier fluid formulations and their properties (i.e., pH, plastic viscosity, yield point, and API fluid loss) were measured and are shown in Table 4.
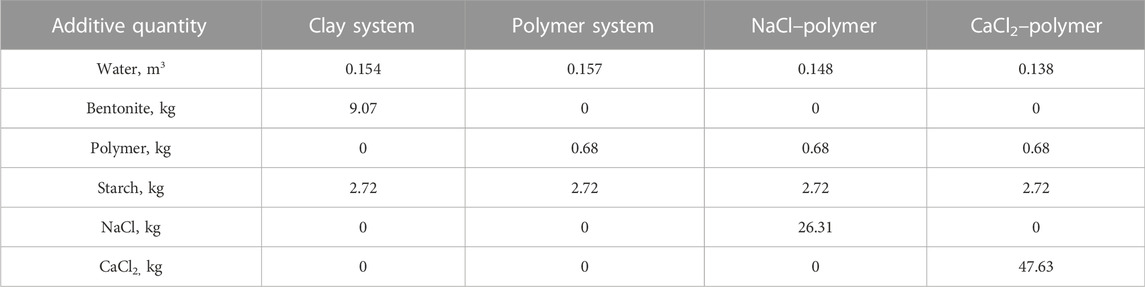
TABLE 3. Carrier fluid formulations [21].
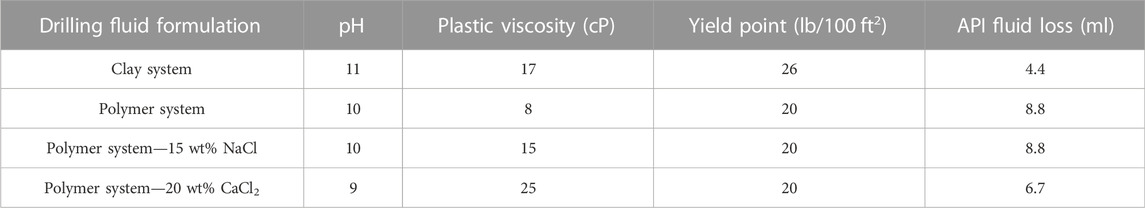
TABLE 4. Properties of the four drilling fluids [21].
2.2 Methods
2.2.1 Particle size distribution measurements
The selected LCMs (sized grade of mica, flaked calcium carbonate, and natural cellulose fiber) were mixed for two time intervals with the four selected fluids (water–bentonite mix, water–polymer mix, polymer–salt system using NaCl salt, and polymer–salt system using CaCl2 salt). All fluid systems were mixed with each LCM at 4,000 RPM for intervals of 10 and 30 min. It was mixed for 10 min which is believed to be an enough time to mix the fluids with the LCM at the high shear rate then it is mixed for longer time (30 min) to investigate the effect of longer mixing time. A Silverson advanced high shear multimixer was used to simulate the high shear that the drilling fluids and LCM would be subjected to in the field. This multimixer can simulate the mixing tank in the field and bit nozzles’ shearing effect. This multimixer used could simulate the mixing tank in the field and the bit nozzles’ shearing effects. The multimixer had six nozzles to produce the required force to shear the materials and the fluids [21]. For dry sieve testing, the material is kept in the oven for 24 h to dry the sample and extract the moisture. Then the sample is placed into a set of different sieves, or mesh-bottomed containers, with sieve sizes ranging from large to small openings. Then, the column of the screens is positioned on a mechanical shaker to allow the material to pour through the sieves and stay on the mesh that either matches the particle size or is smaller. The mixed LCM particle size distribution is almost following the same procedure as the dry PSD. The only difference is that the material was mixed first with the designed fluids and then dried to examine the size changes due to shearing, time, and fluid interaction.
2.2.2 Shape analysis after fluid interaction
The microscopy analysis in this work was carried out to investigate the shape of the particles. The particle shape of all materials in the dry phase was investigated, and the results are illustrated in Table 2. To continue the full investigation of the shape analysis, a new evaluation of the materials’ shape after the fluid’s interaction was required. Five fluids were mixed with each material for 30 min, and the shape was examined. The fluids are clay systems (7 pH and 11 pH), polymer system (7 pH), polymer–NaCl system (7 pH), and polymer–CaCl2 system (7 pH).
2.2.3 Plugging efficiency testing
LCM plugging performance analysis studied the ability of the material to plug, or bridge, the simulated fracture width. A key challenge in testing LCM plugging efficiency is the lack of industry standards for defining LCM testing methods and specifications for interpreting the results [20]. Most companies use a piece of equipment called a permeability plugging apparatus (PPA) to evaluate LCM properties and plugging efficiency. The original design of this equipment was not able to simulate a fracture size of more than 2 mm. To simulate the fractures, a circular hole was opened (drilled) in the slotted discs with the different fracture diameters [21]. All materials were tested under test conditions of 500 psi pressure and ambient temperature.
2.2.4 Specific gravity testing
Specific gravity is a ratio of the material density (mass per volume) to the water density and it is a unitless parameter. In this work, the specific gravity was measured on a dry sample and also after the material was exposed to the fluids. For wet samples, the material is kept in the oven for 16 h to dry the sample and extract the moisture. The analysis will show material’s volume expansion or reduction resulting from fluid interaction. AccuPyc 1330 is a fully automated gas displacement pycnometer used to measure the specific gravity of an irregular powder material.
2.2.5 Fluid loss
To measure the amount of fluid loss resulting from the filtration process, the API fluid loss standard test was applied (API-RP-13B). The fluid loss test was conducted at 100 psi and room temperature for the fluid loss tests on the carrier fluids (Table 4). For the plugging performance test, fluid loss was measured after applying a pressure of up to 500 psi (Tables 9—14). The loss of liquid (filtrate) from a carrier fluid with LCM due to filtration is controlled by the filter cake formed of the solid constituents in the carrier fluid [26]. A Fann filter press was used to determine the fluid loss. A filter paper was inserted at the bottom of the filter cup assembly, followed by filling a filter cup with 350 ml of carrier fluid mixture to conduct the fluid loss experiment. The filter cup was fastened in place and the filtration experiment began using compressed air at 100 psi (raised to 500 psi for the plugging efficiency testing). After 30 min of the filtration experiment, the filtrate liquid was collected and its total volume was measured [27].
3 Results and discussion
3.1 Particle size distribution measurements
3.1.1 Sized grade of mica
Mica is one of the flaky group materials. It has a wide particle size distribution and large particles up to 4,000 μm. Its dry PSD measurements showed that the material has a particle size distribution that covers a range of 4,000–149 μm. The cumulative distribution of the five Ds values is D10 (768 μm), D25 (1,131 μm), D50 (1,751 μm), D75 (2,382 μm), and D90 (2,776 μm).
3.1.1.1 Water system
The material was mixed with the water system for 10 min and 30 min time intervals, and the PSD data were recorded. The cumulative size distribution of the samples is shown in Table 5. The percent of size changing of each Ds value and the average percent of the size degradation showed that the material’s size degradation was high and lost more than 60% of its size (Table 5). The time was not a factor in size degradation in which both 10 min and 30 min results showed a similar average size reduction percentage.
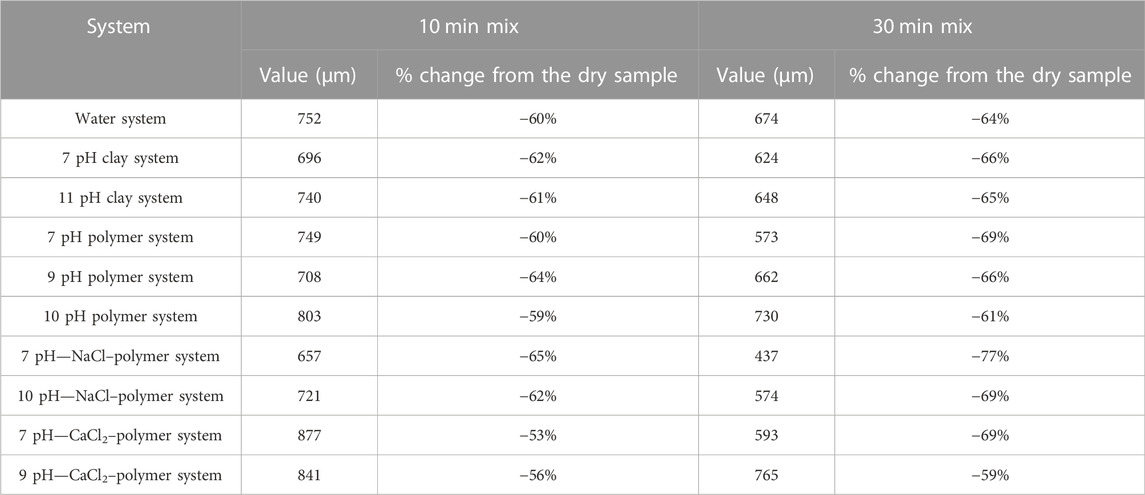
TABLE 5. Cumulative distribution of the mixed samples’ PSD (mica) (all systems) and size percent change.
3.1.1.2 Clay system
A total of five mixes were performed, and the time intervals were 10 and 30 min. The cumulative distribution (Ds) for both clay systems and a comparison analysis of the average size degradation are shown in Table 5. It was noticed that the size degradation of mica with the clay system was 56% at 5 min, 62% at 10 min, and 66% at 30 min of shearing. The change in alkalinity did not affect mica size degradation performance. Overall, the mica performed as a low-strength material because it performed poorly during mixing and was not able to withstand the size degradation. The average size degradation exceeded 66% in reduction with clay systems.
3.1.1.3 Polymer system
In the polymer system, three different alkalinity points were tested: 7, 9, and 10 pH with mica. The comparison analysis between dry and mixed PSD showed the material with polymer systems behaved almost the same as the clay and water system with a very high size reduction percentage. All in all, the alkalinity effect of the polymer systems does not influence mica size degradation performance. The size degradation percentage remained constant at around 66% size reduction (Table 5).
3.1.1.4 Polymer–salt system
Mica was mixed with two salt systems (NaCl and CaCl2) to study the material’s size degradation behavior. Two salt sources with different alkalinity environments were tested and analyzed for the size degradation study. Sodium chloride with pH values of 7 pH and 10 pH and calcium chloride at 7 pH and 9 pH were tested for size degradation.
3.1.1.4.1 NaCl–polymer system
Sodium chloride systems with two different alkalinities showed an effect on mica size degradation. The maximum particle size attrition was 77% below the dry PSD measurement, resulting from the low pH fluids (Table 5). The 10 pH was slightly better than the 7 pH, in maintaining the particle size distribution by around 8% less degradation (Table 5).
3.1.1.4.2 CaCl2–polymer–salt system
The calcium chloride system showed similar performance to another salt system. The highest size reduction was 59% in 30 min mixing with 9 pH, while the low pH showed a degradation percentage of 69% (Table 5).
3.1.2 Flaked calcium carbonate
Flaked calcium carbonate is the second material of the flaky group materials. It has a wide particle size distribution. Its dry PSD measurements showed that the material has a particle size distribution that covers a range of 4,000–149 μm. The cumulative distribution of the five Ds values is D10 (1,111 μm), D25 (1,512 μm), D50 (2,074 μm), D75 (2,805 μm), and D90 (3,420 μm).
3.1.2.1 Water system
The material was mixed with the water system for 10 min and 30 min time intervals, and the mixed LCM PSD data were recorded. The percent change of each Ds value and the average percent of the overall size degradation showed that the material’s size degradation was high and lost more than 72% of its size due to shearing (Table 6).
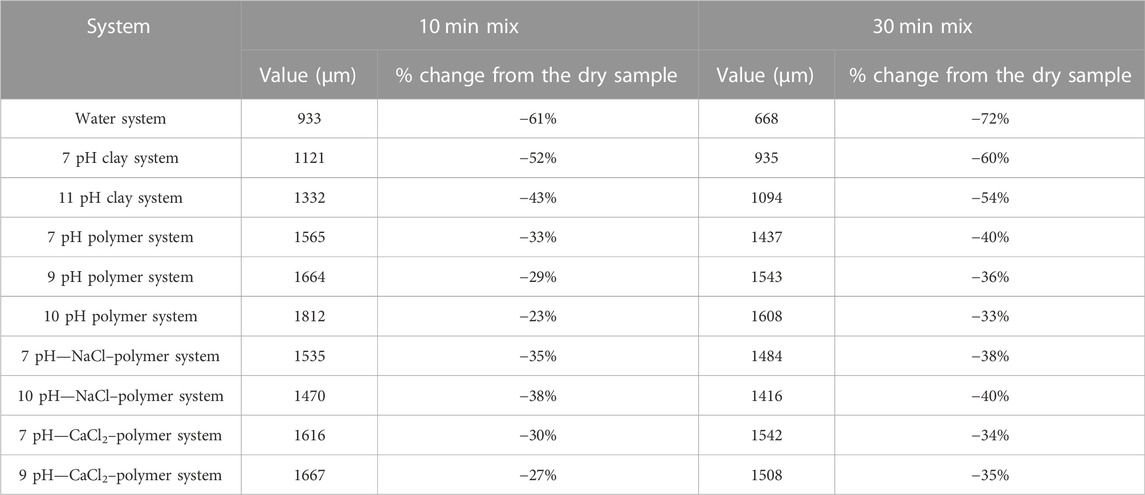
TABLE 6. Cumulative distribution of the mixed samples’ PSD (flaked calcium carbonate) (all systems) and size percent change.
3.1.2.2 Clay system
A total of five mixes were performed at the time intervals of 10 and 30 min. The data in Table 6 illustrate the results and observations of the mixed sample PSD of mica with clay systems. The cumulative distribution (Ds) for both clay systems and a comparison analysis are shown in Table 6. The results showed that the size degradation of flaked calcium carbonate with the clay system with 7 pH alkalinity was a little high, in which the size was reduced by 60% from the original at 30 min of shearing. The size degradation result of the clay system with 11 pH showed a similar performance to the 7 pH system. However, the higher pH was slightly less by 6%, which is not considered a significant difference. Thus, the alkalinity effect was negligible on the flaked calcium carbonate’s size degradation performance. Overall, the flaked calcium carbonate performed as a low-strength material, and the average size degradation exceed 60% in reduction with clay systems.
3.1.2.3 Polymer system
In the polymer system, three different alkalinity points were tested, that is, 7, 9, and 10 pH with flaked calcium carbonate. The comparison analysis between dry and mixed samples’ PSD showed the material with polymer systems behaved more efficiently than that with clay and water systems, as shown in Table 6. Overall, the alkalinity effect of the polymer systems influences flaked calcium carbonate’s size degradation performance. The size degradation percentage of the higher alkalinity was better than that of the low pH.
3.1.2.4 Polymer–salt system
Flaked calcium carbonate was mixed with two salts systems (NaCl and CaCl2) to study the material’s size degradation behavior.
3.1.2.4.1 NaCl–polymer system
The size degradation of sodium chloride systems with two different alkalinities results is recorded. The maximum particle size attrition is 40% below the dry PSD measurement, resulting from the 11 pH fluids (Table 6). Both NaCl–polymer systems showed similar results.
3.1.2.4.2 CaCl2–polymer system
The calcium chloride system showed similar performance to sodium chloride, as observed in the sieve results. The highest size reduction was 40% in 30 min of mixing with 10 pH, while the lowest degradation occurred in 30 min shearing time with 9 pH (Table 6). Therefore, the alkalinity showed no direct relation with size degradation performance of flaked calcium carbonate.
3.1.3 Natural cellulose fiber
Natural cellulose fiber is the only material in this research that falls in the fibrous group. It has a particle size distribution range from 2,830 to 105 μm. The cumulative distribution of the five Ds values is D10 (427 μm), D25 (767 μm), D50 (1,159 μm), D75 (1,584 μm), and D90 (2,007 μm). It is considered one of the large LCM that can be used in high permeable formation, due to its large D50.
3.1.3.1 Water system
The material was mixed for 10 min and 30 min time intervals, and the mixed samples’ PSD data are recorded. The percent change of each Ds value and the average percent of the size degradation are illustrated in Table 7. The results of the material with the water system showed that the fiber was able to maintain its original PSD. The size degradation only occurred at the large particle size (D75 and D90), where the small particles (D10 and D25) showed an increase in size, resulting in an overall increase in the average particle size of the material by 5% after 30 min of shearing.
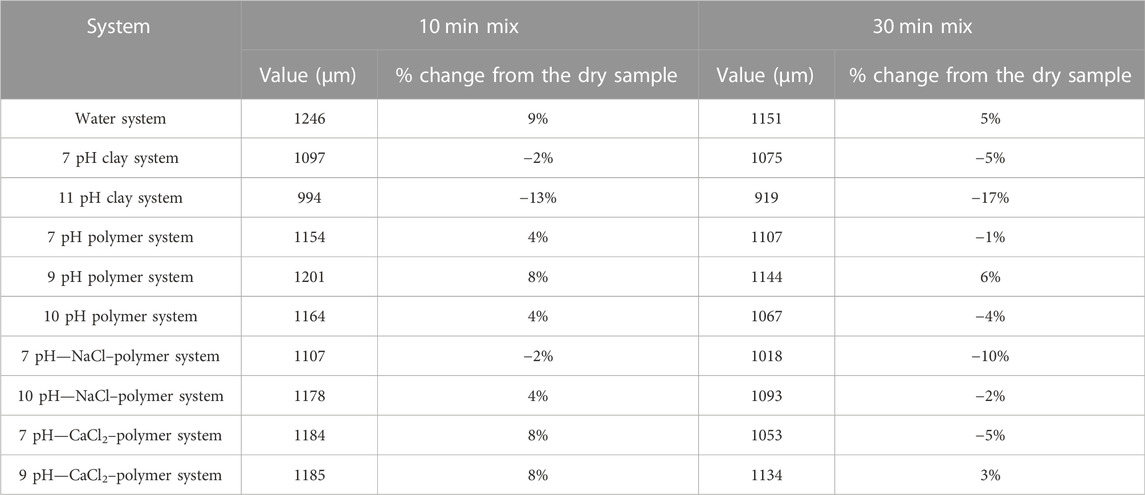
TABLE 7. Cumulative distribution of the mixed samples’ PSD (natural cellulose fiber) (all systems) and size degradation percent.
3.1.3.2 Clay system
A total of five mixes were performed, and the time intervals were 10 and 30 min. Table 7 shows the cumulative distribution (Ds) of both clay systems and comparison analysis. It was noted that the size reduction effect is minimum, and the maximum degradation was 5% at 30 min mixing. It was also observed that the low alkalinity fluid has a less size degradation percentage than 11 pH fluid. The change in alkalinity did affect the material’s size degradation performance. Overall, the natural cellulose fiber material performed as a medium-strength material, and the average size degradation did not exceed 17% size reduction with clay systems.
3.1.3.3 Polymer system
Natural cellulose fiber was tested for size degradation with the polymer system at three different alkalinity points 7, 9, and 10 pH. The PSD profile of the dry sample and three different pH fluids showed similar performance. Therefore, the polymer systems with different alkalinities have no adverse effects associated with size degradation. The size degradation performance of natural cellulose fiber with a polymer system showed that the material maintained the original particle size distribution. The material demonstrated a high reduction in the big particles (D90 and D75) and that redistributed in the small particles (D10 and D25) and maintained D50 almost constant, resulting in an overall increase in the average percent of the Ds values to be 6% (Table 7).
3.1.3.4 Polymer–salt system
Sodium chloride with pH 7 and 10 and calcium chloride with 7 and 9 pH were mixed and tested to study natural cellulose fiber size degradation.
3.1.3.4.1 NaCl–polymer system
The natural cellulose fiber size degradation results with sodium chloride systems are recorded. The average mixed samples’ PSD decreased by 10% with low pH fluids, while it was slightly better at high pH, with only 2% size reduction (Table 7).
3.1.3.4.2 CaCl2–polymer system
Calcium chloride systems showed a better performance than sodium chloride systems, in maintaining their original size. The mixed samples’ PSD was increased by 3% with high pH, while it was a 5% size reduction of the low pH. All these data were obtained at 30 min of shearing (Table 7).
3.2 Specific gravity after fluid interaction
3.2.1 Flaky group
Another material that experienced a specific gravity change after fluid interaction from the flaky group is a sized grade of mica. The mica dry phase specific gravity was 2.736, and the specific gravity increased by an average of 0.07 after mixing with the different fluid systems. This increase was due to a volume decrease from fluid interaction. Furthermore, in the size degradation study of mica, a high percentage of the mica mixed samples’ PSD was significantly decreased.
3.2.2 Fibrous group
The last material that showed a specific gravity decrease due to fluid interaction from the fibrous group is natural cellulose fiber. The average specific gravity reduction after mixing with the different fluid systems was 0.71 and that was due to the characteristic of water absorption by the cellulose to develop hydrogen bond interaction, resulting in the volume increase [28]. [29] Therefore, the specific gravity showed reduction (Table 8). Moreover, this material did not show a high size degradation which fits with the specific gravity results.
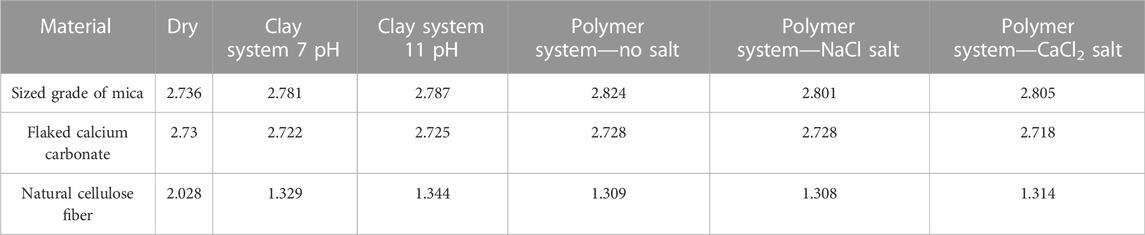
TABLE 8. Specific gravity measurements.
3.3 Shape analysis after fluid interaction
3.3.1 Flaky group
The flaky group has two materials: sized grade of mica and flaked calcium carbonate. The dry-shape analysis of the first material showed the LCM to be angular, thin, and flat in shape with a large surface area, where the shape of mixed samples is described as rounded and angular (Figure 1). The original particle shape of flaked calcium carbonate was angular, sub-angular, thin, and flat with a small surface area. The shape of mixed samples for all fluids was drastically changed to be sub-rounded and angular (Figure 2).
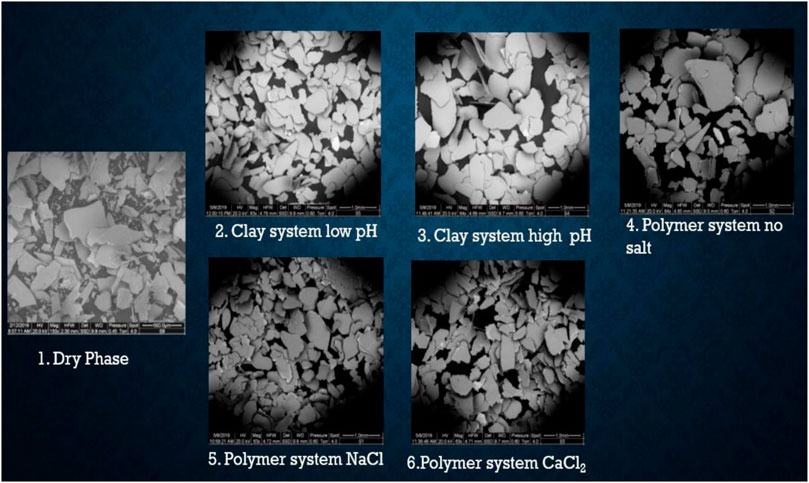
FIGURE 1. Mixed and dry mica microscopy images.
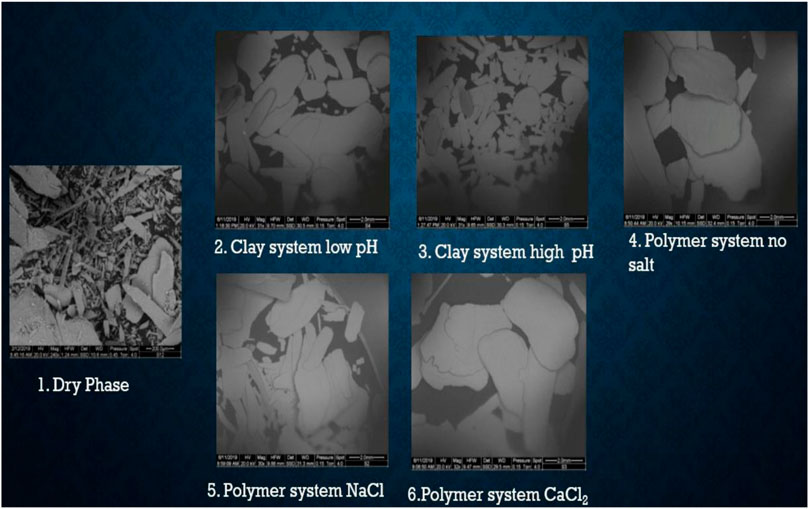
FIGURE 2. Mixed and dry flaked calcium carbonate microscopy images.
3.3.2 Fibrous group
The fibrous group has only one fiber material. Natural cellulose fiber is an organic material with dry particle shapes of angular and sub-angular; on the other hand, the mixed sample shape showed more angularity with curved corners (Figure 3).
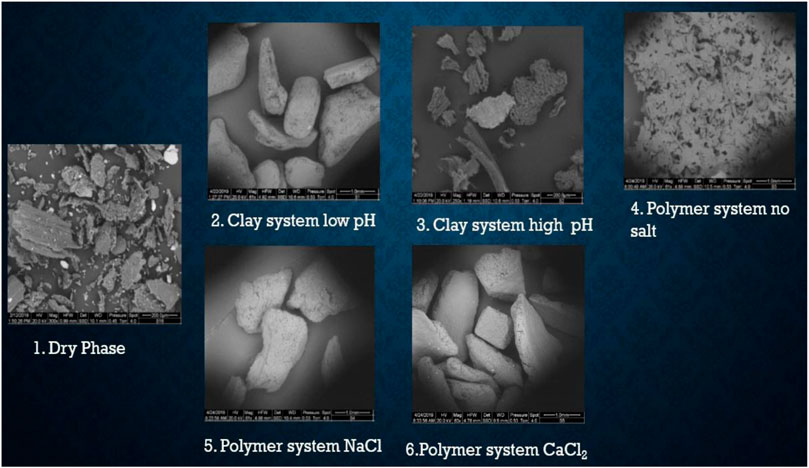
FIGURE 3. Mixed and dry natural cellulose fiber microscopy image.
3.4 Plugging performance
3.4.1 Sized grade of mica plugging performance
The first material of the flaky group, mica, showed a significant decrease in plugging efficiency. The mixture with fluid and no shearing showed excellent performance and was able to plug a 5.0-mm fracture. After the material was sheared with the fluid, the sealing capability dropped to 1.5 mm (Table 9). The D50 for the material before and after degradation was recorded at 1,751 and 566 μm, respectively. The median particle size over the fracture size must be equal to or greater than 1.2 [1.751 mm (D50 before degradation) divided by 1.5 mm (sealed fracture size)] to form effective bridging (Eq. 1). This is the highest ratio among all materials tested.
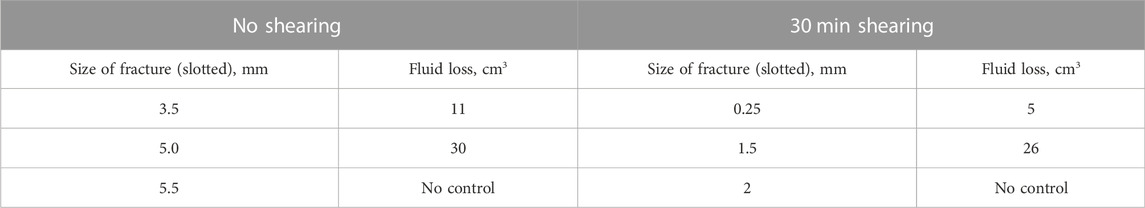
TABLE 9. Sized grade of mica plugging performance.
3.4.2 Flaked calcium carbonate plugging performance
Flaked calcium carbonate is the second material in the flaky group. It has a better performance than mica. The no-shearing mixture of the material was able to seal a fracture size of 5.0 mm. After the material was sheared with the fluid, the sealing capability dropped to 3.0 mm (Table 10). The material plugging efficiency performance was remarkable, especially with the high size degradation of the material. The median size of the dry phase was 2,074 μm; the mixed sample’s phase median size dropped to 973 μm due to size degradation. The new mathematical relationship equation for flaked calcium carbonate is developed. The median particle size over the fracture size must be equal to or greater than 0.7 to form the bridging.
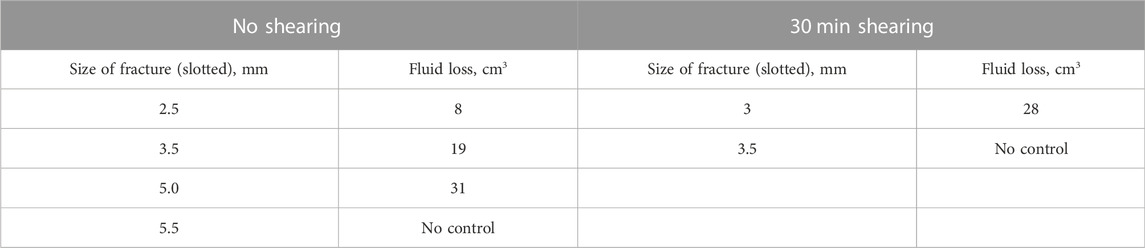
TABLE 10. Flaked calcium carbonate plugging performance.
3.4.3 Natural cellulose fiber performance
The last material in our study is the natural cellulose fiber. The overall size degradation results of the material revealed that the material had a 5% size increase when immersed in the fluid. The no-shearing mixture plugged a fracture size of 2.5 mm; likewise, the mixture sheared for 30 min. The material maintained the ability to plug the same fracture aperture with no effect caused by the shearing force (Table 11). The D50 of the dry phase was 1,159 μm, while the size degradation caused a reduction in the D50 to 1,087 μm. The developed mathematical relationship equation (Eq. 3) states that the median size of the dry phase over the fracture size has to be equal to or greater than 0.5 in order to form the rigid plug with natural cellulose fiber.
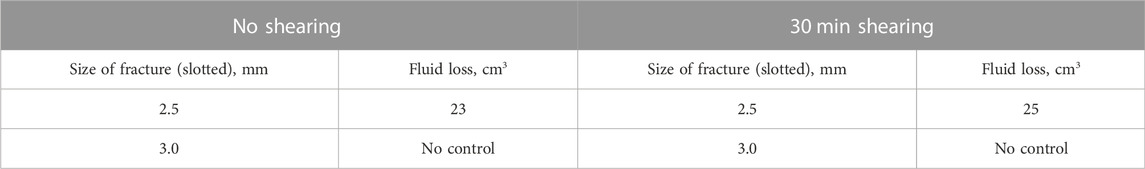
TABLE 11. Natural cellulose fiber plugging performance.
3.5 LCM overall performance
3.5.1 Sized grade of mica
The original particle size distribution of mica covers a range from 4,000 to 149 μm. The overall performance of mica with the different carrier fluid systems showed that the material performed with very high size reduction with all fluids systems (Figure 4). The size degradation of mica was extraordinarily high which reached an average of 67% loss in particle size for all fluids. The cumulative distribution showed a high reduction, as shown in Figure 5 which showed a loss in D10 at 71%, loss in D50 at 70% and finally, the D90 experienced a loss in particle size percent of 56%. This material was destroyed using this material as LCM will provide no benefits (Figure 5). The time interval analysis of mica size degradation performance showed that the material was not affected by time changing and acted as a time-independent material. The size degradation results of the 10 min and 30 min shearing times were similar and no extra size degradation was encountered, as it can be observed in the clay system example (Supplementary Figure S1). The average size degradation of 10 min with all fluids showed a 60% decrease in size, while the 30 min showed an average of 67% decrease in size. The mass of the mica showed a high loss of 30% after shearing. Most of the particles went below the minimum (<149 μm), as it is shown in Supplementary Figure S2.

FIGURE 4. Dry and mixed samples’ PSD (mica—all systems).
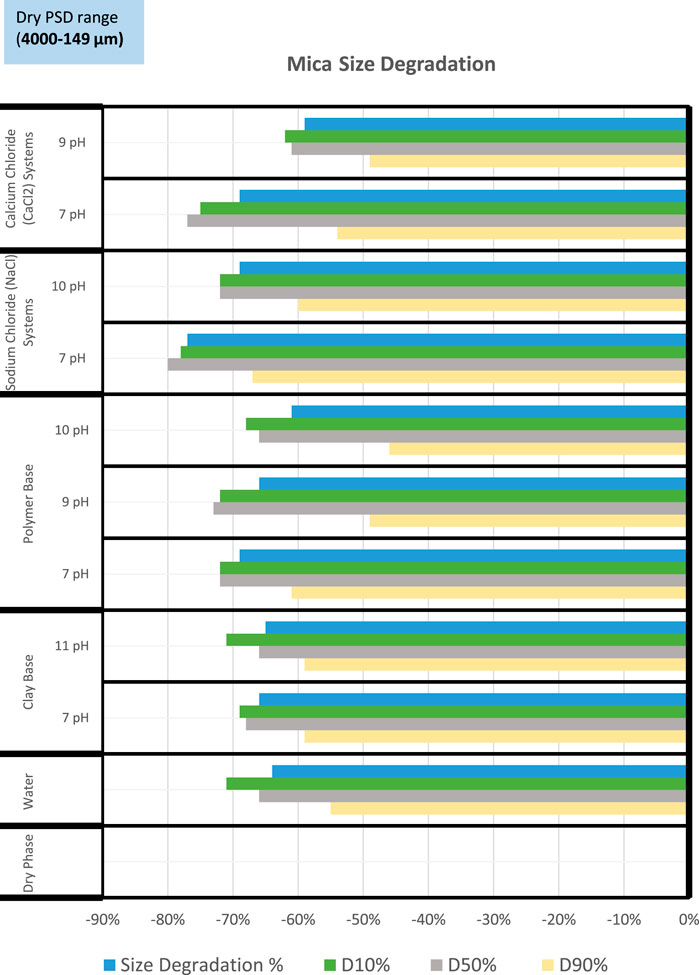
FIGURE 5. Mica—size degradation performance (30 min shearing).
The shape of mica was changed from angular, thin, and flat with a large surface to rounded and angular because of shearing and the fluid’s interaction. The specific gravity showed a slight increase, due to reduction in volume. The plugging efficiency of the no-shearing mixture was reported at 5.0-mm fracture size and then dropped significantly with the shearing effect to 1.5 mm. Moreover, a high fluid loss of 26 ml was observed. The new rounded shape was one of the reasons for the high fluid loss. The loss in plugging efficiency from 5.0 to 1.5-mm fracture size represents around 70% loss in efficiency, which is similar to the reduction in size degradation of 66%. Therefore, the relation between the plugging efficiency to the material size is a one-to-one ratio (Table 12).
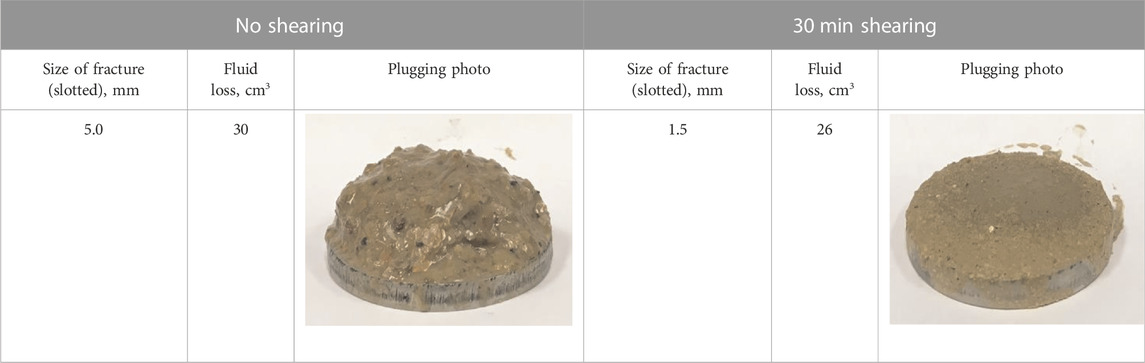
TABLE 12. Mica plugged fracture size before and after shearing force.
3.5.2 Flaked calcium carbonate
The PSD dry phase of flaked calcium carbonate has a particle size range of 4,000–149 μm. The overall performance of flaked calcium carbonate with the different carrier fluid systems showed that the material performed with a very high size reduction in water and clay systems. However, it showed better performance with all polymer systems by almost 50% less in size degradation (Figure 6). The mixed samples’ PSD data revealed that the material behaved differently based on the fluid used. The water and clay systems showed more degradation and loss of the material durability than all polymer systems showing the comprehensive analysis of all fluids with flaked calcium carbonate. Since clay and water systems have similar performance, the average percentage of their data will be combined, and the same goes for polymer systems. Clay and water systems showed a size degradation of around 54%–72%, while polymer systems (both salt and no salt) showed an average of 33%–40% size reduction (Figure 7). The overall size degradation of the clay and water systems was reported at 62% size reduction, and that is considered a high loss in particle size. This was also shown in D90, D50, and D10 with a size reduction of 51%, 58%, and 75%, respectively. On the other hand, the polymer systems only showed a loss of 37% in size reduction. The cumulative distributions showed a size reduction in D90, D50, and D10 with a size reduction of 16%, 36%, and 60%, respectively.
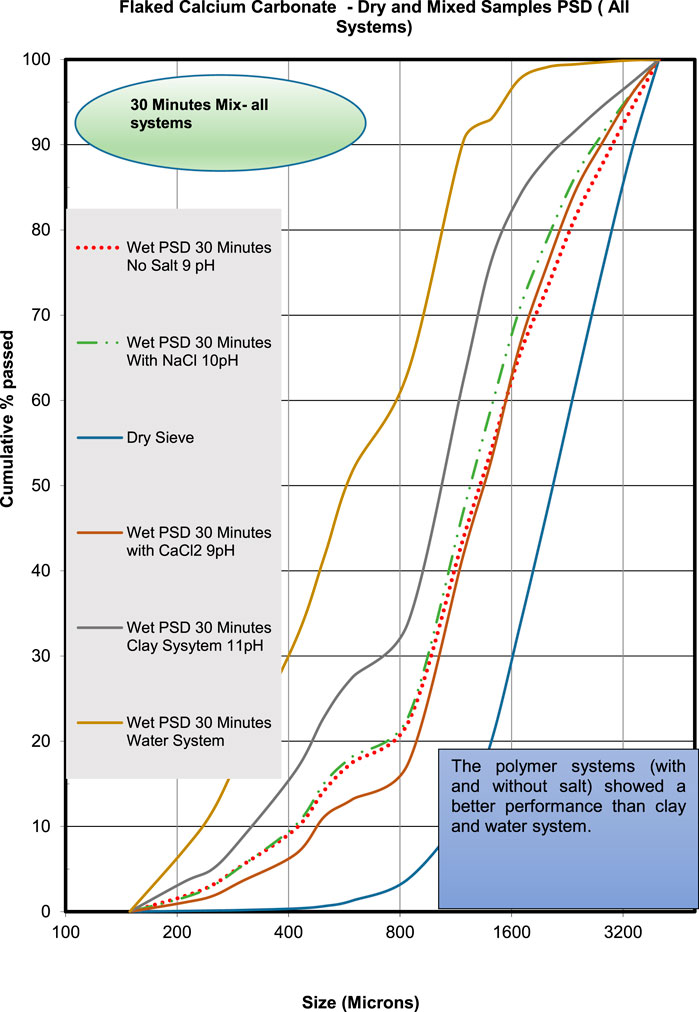
FIGURE 6. Dry and mixed samples’ PSD (flaked calcium carbonate—all systems).
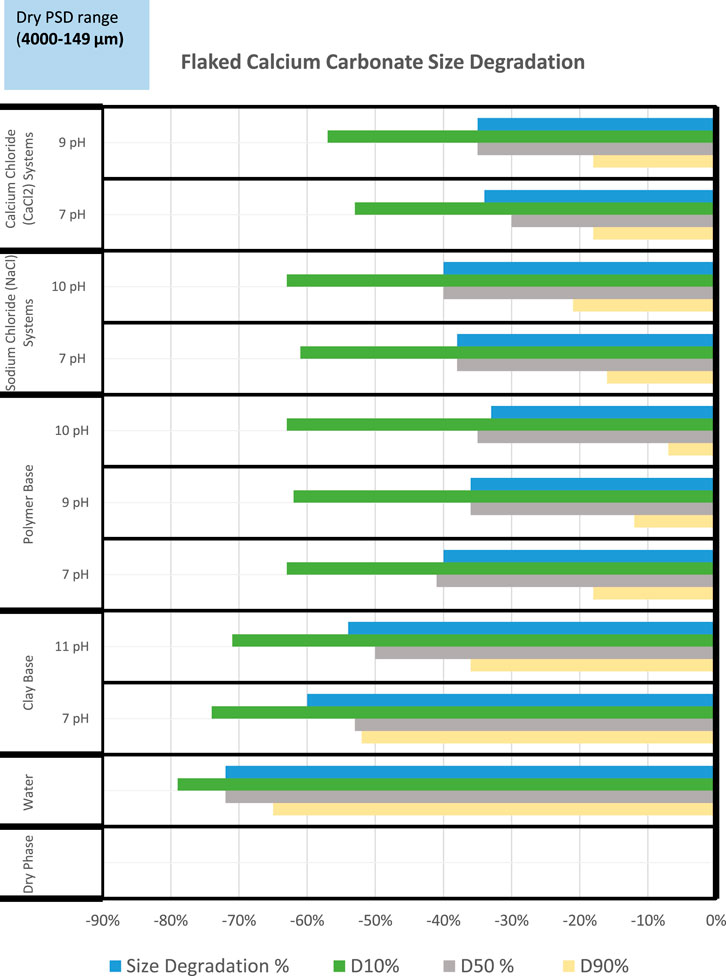
FIGURE 7. Flaked calcium carbonate—size degradation performance (30 min shearing).
The time interval analysis of flaked calcium carbonate size degradation performance showed that the material was not affected by time changing and acted as a time-independent material. The average difference of size degradation results of the 10 min and 30 min showed around 10% more degradation with shearing time changing, as it is shown in the clay system example (Supplementary Figure S3). The average size degradation of 10 min with the first group (water and clay systems) showed a 52% reduction in size, while the 30 min showed an average of 62% reduction in size. The clay and water systems lost 31% of the material mass after shearing with only 70% of the particles that are above 149 μm, while polymer systems maintained 85% of the particles above the minimum size (Supplementary Figure S4).
The original particle shape of flaked calcium carbonate was angular, sub-angular, thin, and flat with a small surface area. The mixed samples’ shape for all fluids was drastically changed to be sub-rounded and angular. The specific gravity measurements of flaked calcium carbonate did not change after the fluid’s interaction and stayed constant at 2.73. The simulated plugged fracture was obtained at 5.0 mm by using the dry PSD (no shearing) of the material, but when the shearing force occurred, the material was able to plug 3.0-mm fractures. This drop in the fracture size was quantified to be a 40% decrease, while the size degradation of the fluids used in this test was 60% (Table 13). Thus, the size degradation percent of flaked calcium carbonate to plugging efficiency ratio is 1:0.6.
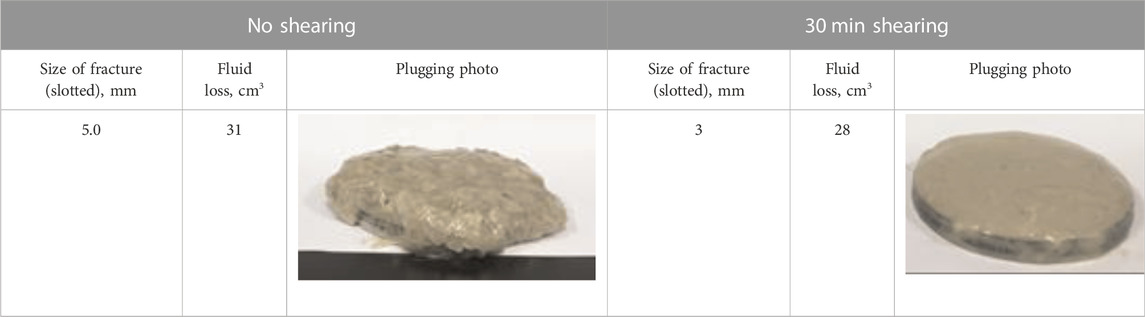
TABLE 13. Flaked calcium carbonate plugged fracture size before and after the shearing force.
3.5.3 Natural cellulose fiber
The dry size range of natural cellulose is from 2,830 to 105 μm. The overall performance of natural cellulose fiber with the different carrier fluid systems showed that the material performed a minor size reduction with all systems with a maximum degradation of 17% with a high-pH clay system (Figure 8). The average size degradation of all fluids was reported at a 3% size reduction. The small particles (D10) showed a size increase of 17%. The big particles (D90) showed a loss of only 21% only, while the median particles (D50) showed a size decrease of 3%. This material showed particle redistribution between the big and small particles (Figure 9).
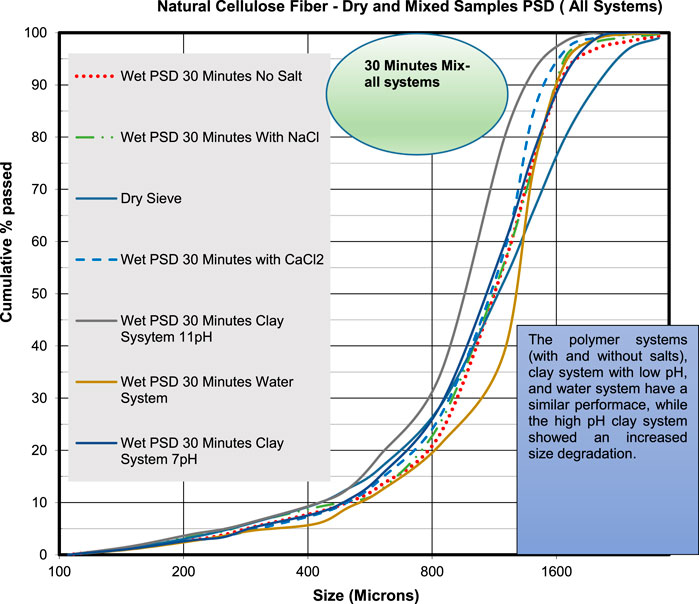
FIGURE 8. Dry and mixed samples’ PSD (natural cellulose fiber—all systems).
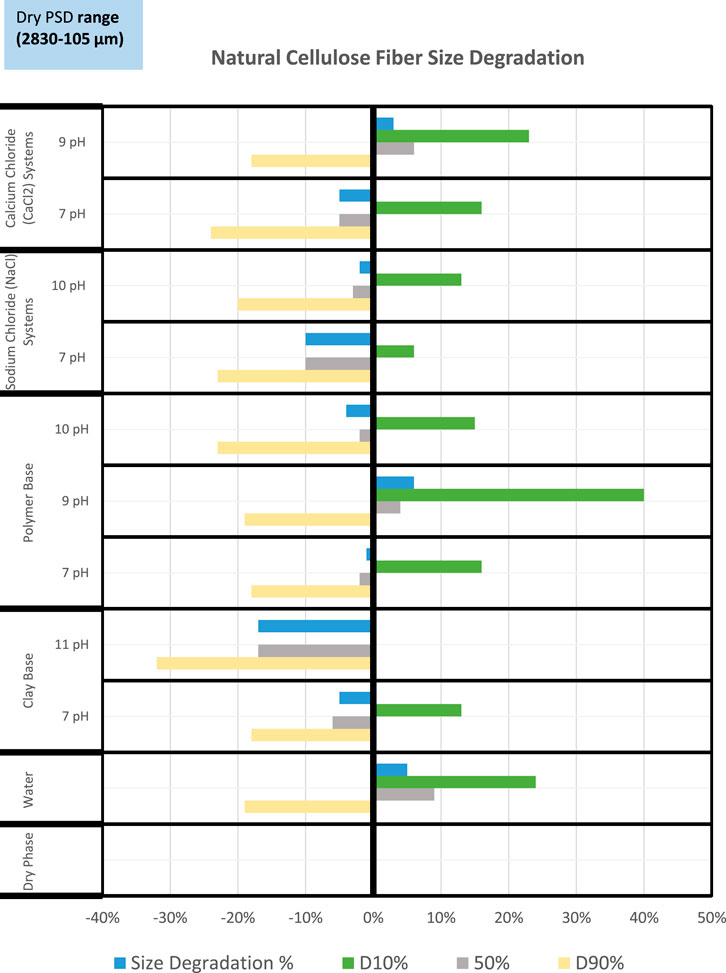
FIGURE 9. Natural cellulose fiber—size degradation performance (30 min shearing).
The time interval analysis of natural cellulose fiber size degradation performance showed that the material was not affected by time changing and acted as a time-independent material. The size degradation results of the 10 min and 30 min shearing time were similar and no extra size degradation was encountered, as it is shown in the clay system example (Supplementary Figure S5). The average size degradation of 10 min with all fluids was 1% reduction in size, while the 30 min showed an average of 3% reduction in size. The aspect of the natural cellulose fiber mass percentage loss study that went below the original PSD revealed that the material lost some of its mass and introduced new small particles that are below the minimum dry particle size (105 μm). The average percentage of the lost mass was observed to be around 17%, that means after mixing and shearing, only 83% of the initial material mass will be reaching the target zone (Supplementary Figure S6).
The material showed a decrease in specific gravity with fluid interaction. The average specific gravity reduction is 0.71 and that was due to cellulose characteristics of water absorption to develop hydrogen bond interaction, resulting in an increase in volume (Caulfield 1978). Therefore, the specific gravity reflected that drop. The material dry phase shape was angular and sub-angular. Then due to fluid interaction, the mixed samples’ shape showed more angularity with curved corners. The material’s plugging efficiency was not affected by size degradation. The material was able to plug the same fracture size with and without the shearing force effect. The material plugged a simulated fracture size of 2.5 mm with a fluid loss of 2.5 ml (Table 14).
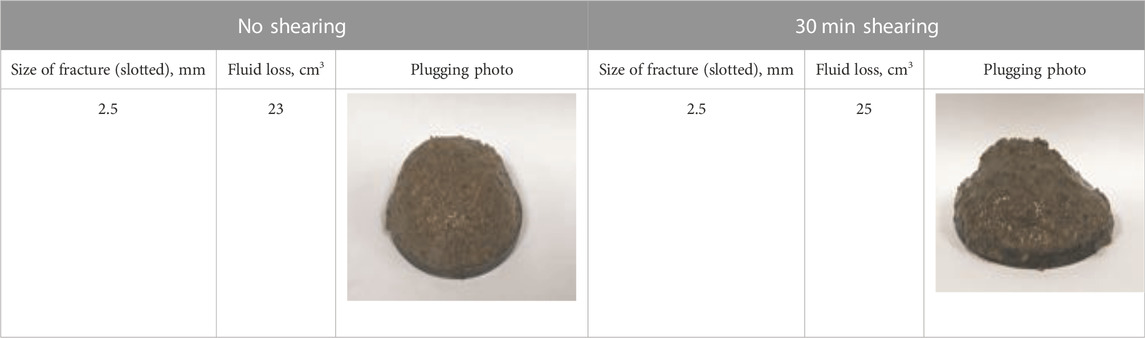
TABLE 14. Natural cellulose fiber plugged fracture size before and after shearing force.
4 Conclusion
The overall impact of this work is to prove that applying these ways of investigation to the current lost circulation management can drive the industry to resolve some lost circulation problems by effectively and efficiently applying the right LCM in the specific situation.
The important and major findings of this work are as follows:
• The effect of carrier fluids was proven to be significant on the LCM size degradation. Flaked calcium carbonate was affected by the fluid selection. It showed high size degradation with water and clay systems, whereas it was less impacted with all polymer systems and showed even a better performance with high alkalinity polymer systems.
• Each material behaved differently under high shear. The material that did not experience significant size changes was natural cellulose fiber. The other materials (mica and flaked calcium carbonate) showed a large size reduction.
• Two (natural cellulose fiber and mica) materials showed a change in their specific gravity results after mixing with fluids.
• All of the materials kept their initial shape after exposure to the fluids, except the flaky group that introduced more rounded shape particles.
• A new experimental mathematical observation was obtained for each material to enhance the plugging efficiency and can be used to simulate the fracture size.
Data availability statement
The original contributions presented in the study are included in the article/Supplementary Material; further inquiries can be directed to the corresponding author.
Author contributions
Conceptualization: SaA; formal analysis: SaA, SuA, and AB; experimental investigation: SaA and AB; writing—original draft preparation: SaA and SuA; writing—review and editing: SaA, SuA, and AB; and supervision: SaA, SuA, and AB. All authors have read and agreed to the published version of the manuscript.
Acknowledgments
The authors acknowledge and highly appreciate Saudi Aramco and King Fahd University of Petroleum & Minerals (KFUPM) for their support to publish this work. The company Saudi Aramco was not involved in the study design, collection, analysis, interpretation of data, the writing of this article or the decision to submit it for publication.
Conflict of interest
SaA and AB were employed by Saudi Aramco.
The remaining author declares that the research was conducted in the absence of any commercial or financial relationships that could be construed as a potential conflict of interest.
Publisher’s note
All claims expressed in this article are solely those of the authors and do not necessarily represent those of their affiliated organizations, or those of the publisher, the editors, and the reviewers. Any product that may be evaluated in this article, or claim that may be made by its manufacturer, is not guaranteed or endorsed by the publisher.
Supplementary Material
The Supplementary Material for this article can be found online at: https://www.frontiersin.org/articles/10.3389/fphy.2022.1065526/full#supplementary-material
Abbreviations
Ds, maximum particle size of a percentage of the particles, µm; D10, maximum particle size of 10% of the particles, µm; D25, maximum particle size of 25% of the particles, µm; D50, median particle size, µm; D75, maximum particle size of 75% of the particles, µm; D90, maximum particle size of 90% of the particles, µm; LCM, lost circulation material; PSD, particle size distribution.
References
1. Aadnøy BS, Chenevert ME 1987. Stability of highly inclined boreholes SPE Drilling Eng 2 (4): 364–74. SPE-16052-PA. doi:10.2118/16052-PA
2. Lavrov A. Lost circulation: Mechanisms and solutions. Cambridge, MA: Gulf Professional Publishing, Elsevier (2016). doi:10.1016/C2015-0-00926-1
3. Al Menhali S, Abdul Halim AO, A, Al Menhali S. Curing losses while drilling & cementing Proceedings of the Paper presented at the Abu Dhabi International Petroleum Exhibition and Conference, Abu Dhabi,UAE, 10-13 November. SPE-171910-MS. doi:10.2118/171910-MS
4. Ivan C, Bruton J, Bloys B 2003. How can we best manage lost circulation? Proceedings of the Paper presented at the AADE Technical Conference and Exhibition, Houston,Texas,USA, 1-3 April 2003.
5. Alsaba M, Nygaard R, Hareland G. Review of lost circulation materials and treatments with an updated classification. Proceedings of the Paper presented at the AADE Fluids Technical Conference and Exhibition, Houston,Texas,USA, April 15-16. AADE-14-FTCE-24.
6. Lecolier E, Herzhaft B, Rousseau L, Neau L, Quillien B, Kieffer J. Development of a nanocomposite gel for lost circulation treatment. Proceedings of the Paper presented at the SPE European Formation Damage Conference, Sheveningen, Netherlands, 25-27 May 2005, 2387. SPE-94686-MS. doi:10.2118/94686-MS
7. Nayberg TM, Petty BR 1986. Laboratory study of lost circulation materials for use in oil-base drilling muds. Proceedings of the Paper presented at the SPE Deep Drilling and Production Symposium, Amarillo, Texas,USA, 6-8 April 1986. SPE-14995-MS. doi:10.2118/14995-MS
8. Salehi S, Nygaard R 2012. Numerical modeling of induced fracture propagation: A novel approach for lost circulation materials (LCM) design in borehole strengthening applications of deep offshore drilling. Proceedings of the Paper presented at the SPE Annual Technical Conference and Exhibition, San Antonio, Texas,USA, 8-10 October 2012. SPE-135155-MS. doi:10.2118/135155-MS
9. Feng Y, Gray KE. Lost circulation and wellbore strengthening. Cham, Switzerland: Springer (2018). doi:10.1007/978-3-319-89435-5
10. Alberty M, McLean M. A physical model for stress cages. Houston,Texas,USA: Paper presented at the SPE Annual Technical Conference (2004). p. 26–9. SPE-90493-MS. doi:10.2523/90493-MS September.
11. Dupriest FE. Fracture closure stress (FCS) and lost returns practices. Proceedings of the Paper presented at the SPE/IADC Drilling Conference, Amsterdam, Netherlands, 23-25 February 2005. doi:10.2523/92192-MS
12. Aadnøy BS, Belayneh M. Elasto-plastic fracturing model for wellbore stability using non-penetrating fluids. J Pet Sci Eng (2004) 45(3–4):179–92. doi:10.1016/j.petrol.2004.07.006
13. Van Oort E, Friedheim JE, Pierce T, Lee J. Avoiding losses in depleted and weak zones by constantly strengthening wellbores. SPE Drilling & Completion (2011) 26(04):519–30. doi:10.2118/125093-PA
14. Morita N, Black AD, Guh G-F. Theory of lost circulation pressure. Proceedings of the Paper presented at the SPE Annual Technical Conference and Exhibition, New Orleans,Louisiana,USA, 23-26 September 1990. SPE-20409-MS. doi:10.2118/20409-MS
15. Onyia EC. Experimental data analysis of lost-circulation problems during drilling with oil-based mud. SPE Drilling & Completion (1994) 9(1):25–31. SPE-22581-PA. doi:10.2118/22581-PA
16. Salehi S. PhD dissertation. Rolla, Missouri: Missouri University of Science and Technology (2012).Numerical simulations of fracture propagation and sealing: Implications for wellbore strengthening.
17. Cook J, Growcock F, Guo Q, Hodder M, Van Oort E. Stabilizing the wellbore to prevent lost circulation. Oilfield Rev (2011) 23(4):26–35. https://www.slb.com/-/media/files/oilfield-review/1-sealing-english.
18. Howard GC, Scott PP. An analysis and the control of lost circulation. J Pet Tech (1951) 3(06):171–82. SPE-951171-G. doi:10.2118/951171-g
19. White RJ. Lost-circulation materials and their evaluation. API Drilling Prod Pract (1956) 56–352.
20. Amer A, Hale A, Al Haidari S. Addressing the challenges of lost circulation using novel chemistries, test equipment and data science tools. Proceedings of the Paper presented at the AADE National Technical Conference and Exhibition, Denver,Colorado, USA, April 9-10 2019.
21. Alhaidari SA, Alarifi SA. Experimental investigation of particle size degradation and plugging efficiency of three granular lost circulation materials. Appl Sci (Basel) (2021) 2021:119061. doi:10.3390/app11199061
22. Alhaidari SA, Eustes AW. PhD dissertation. Golden, Colorado: Colorado School of Mines (2020).Lost circulation management: New engineering approaches and techniques for better bridging and sealing the fracture.
23. Valsecchi P. On the shear degradation of lost circulation materials. Proceedings of the Paper presented at the SPE/IADC Drilling Conference and Exhibition, Amsterdam, Netherlands, March 8-22 2013, 5–7. doi:10.2118/163512-MS
24. Gaurina-Medjimurec N, Pasic B. Lost circulation. In: Risk analysis for prevention of hazardous situations in Petroleum and natural gas engineering. PA: IGI Global (2014). p. 73–95. doi:10.4018/978-1-4666-4777-0.ch004
25. Scott PD, Beardmore DH, Wade ZL, Evans E, Franks KD 2012. Size degradation of granular lost circulation materials. Procedings of the Paper presnted at the IADC/SPE Drilling Conference and Exhibition, San Diego, California ,USA, 6-8 March 2012. doi:10.2118/151227-MS
26. Murtaza M, Alarifi SA, Abozuhairah A, Mahmoud M, Onaizi SA, Al-Ajmi M. Optimum selection of H2S scavenger in light-weight and heavy-weight water-based drilling fluids. ACS Omega (2021) 6(38):24919–30. doi:10.1021/acsomega.1c03792
27. Murtaza M, Alarifi SA, Kamal MS, Onaizi SA, Al-Ajmi M, Mahmoud M. Experimental investigation of the rheological behavior of an oil-based drilling fluid with rheology modifier and oil wetter additives. Molecules (2021) 26(16):4877. doi:10.3390/molecules26164877
28. Caulfield DF. Interactions at the cellulose-water interface. Paper Sci Technol Cutting Edge. Appleton, WI: Inst Paper Chem (1980) 70–88.
Keywords: lost circulation materials, particle size degradation, plugging efficiency, flaky material, fibrous material
Citation: Alhaidari SA, Alarifi SA and Bahamdan A (2022) Plugging efficiency of flaky and fibrous lost circulation materials in different carrier fluid systems. Front. Phys. 10:1065526. doi: 10.3389/fphy.2022.1065526
Received: 09 October 2022; Accepted: 16 November 2022;
Published: 13 December 2022.
Edited by:
Zhenjiang You, Edith Cowan University, AustraliaReviewed by:
Vishnu Chandrasekharan Nair, Indian Institute of Technology Kharagpur, IndiaMesfin Belayneh, University of Stavanger, Norway
Copyright © 2022 Alhaidari, Alarifi and Bahamdan. This is an open-access article distributed under the terms of the Creative Commons Attribution License (CC BY). The use, distribution or reproduction in other forums is permitted, provided the original author(s) and the copyright owner(s) are credited and that the original publication in this journal is cited, in accordance with accepted academic practice. No use, distribution or reproduction is permitted which does not comply with these terms.
*Correspondence: Sulaiman A. Alarifi, c2FsYXJpZmlAa2Z1cG0uZWR1LnNh