 Mabroor Ahmed1,2,3†
 Sandra Bicher1,2†Robert D. Stewart4Stefan Bartzsch1,2Thomas E. Schmid1,2Stephanie E. Combs1,2
 Juergen Meyer4*
- 1Department of Radiation Oncology, School of Medicine, Klinikum rechts der Isar, Technical University of Munich, Munich, Germany
- 2Helmholtz Zentrum München GmbH, German Research Center for Environmental Health, Institute of Radiation Medicine, Neuherberg, Germany
- 3Physics Department, Technical University of Munich, Garching, Germany
- 4Fred Hutchinson Cancer Center, Department of Radiation Oncology, University of Washington, Seattle, WA, United States
Purpose: Spatially Fractionated Radiation Therapy (SFRT) is characterized by large differences in peak and valley doses. Preclinical and clinical studies suggest that differences in biological mechanisms lead to differential normal tissue and tumor response compared to uniform irradiation. We hypothesize that to evaluate clinical effectiveness and understand fundamental biological mechanisms, radiobiological rather than physical dose quantities should be utilized for comparisons. The aim of this work is to determine whether Equivalent Uniform Dose (EUD) is a superior predictor of cell survival than absorbed dose.
Methods: Absorbed dose parameters were compared to the Equivalent Uniform Dose to assess their predictive value for the relative effectiveness of uniform and SFRT with X-rays. A Bayesian bootstrap technique was utilized to model uncertainties in the biological fit parameters for a human fibroblast (MRC5) and two human tumor cell lines (LN18 and A549). Dose uncertainties were evaluated through measurements and error modeling of SFRT profiles. A dimensionless Relative Effectiveness Factor (REF) is proposed to quantify differences between uniform and SFRT irradiation.
Results: For all cell lines, cell survival after SFRT matched uniform irradiation within the estimated uncertainties at equal values of the EUD. Average and peak dose showed poor correlation with in vitro cell survival. The proposed REF factor is dose dependent and suggests enhanced cell killing for both tumor cell lines (1.14 ± .08 for LN18, 1.32 ± .13 for A549 at 8 Gy EUD) for SFRT. Normal human fibroblasts showed reduced cell killing relative to uniform irradiation (.58 ± .06 for MRC5). Synthetically generated SFRT dose profiles revealed that EUD uncertainties are dominated by valley dose uncertainties, especially at high doses.
Discussion: EUD is more predictive of cell survival than average or valley dose. Valley dose is close to equal to the EUD for values
Conclusion: EUD is recommended for comparisons of SFRT and uniform irradiation. The results suggest an increase in survival of normal-human fibroblast cells and reduced survival for both tumor cell lines after SFRT relative to uniform irradiation.
1 Introduction
Spatially fractionated radiation therapy (SFRT) is an innovative treatment concept, which seeks to exploit dose-volume effects in normal tissues without compromising tumor control. The dose-volume effect refers to the dependency of normal tissue response on the volume that is being irradiated. SFRT has been pursued using various approaches, such as microbeams, minibeams and grid therapy. With grid therapy hundreds of patients have been successfully treated and several clinical trials are underway [1–4], the development of mini- and Microbeam Radiation Therapy (MRT) is still in a preclinical phase. SFRT uses highly modulated beams with dose gradients delivered to millimeter or sub-millimeter spatial regions of tissue. Different domains and applications of SFRT exist with various radiation types, e.g. photons [5, 6] and protons [7, 8], geometry as well as arrangement and delivery of the beams, e.g., GRID [4] (2D pattern) and Lattice [3, 9] (3D pattern) therapy. For each of the approaches reports exist in the literature. Increased normal tissue tolerance to SFRT beams compared to uniform irradiation is usually reported [10–13]. However, the exact biological mechanism for these differences are not yet understood. Similarly, published reports indicate that SFRT can potentially overcome the inherent radiation resistance of conventional low Linear Energy Transfer (LET) radiation treatments [14], presumably through dose escalation to the tumor but possibly also through enhanced tumor-cell killing mediated by inter-cellular signaling or other mechanisms.
Many laboratory studies utilize physical (absorbed) dose metrics, such as the average (or mean), peak and/or valley dose, to design studies and compare SFRT to uniform irradiation [10, 12, 13, 15]. More recently, the shortcomings of using absorbed dose metrics for comparative pre-clinical studies of uniform irradiation and SFRT irradiation have been highlighted, and it was proposed that the Equivalent Uniform Dose (EUD) [16, 17] may be useful for the design and analysis of SFRT studies with corrections for different beam parameters and the effects of relative biological effectiveness (RBE) for different particle types and energies. The most widely used formulas to compute the EUD are derived from the well-established Linear Quadratic (LQ) model for reproductive cell survival. Although the EUD may not account for all biological responses, such as systemic and bystander effects [18], it remains a useful way to compare uniform irradiation and SFRT in pre-clinical studies and ongoing efforts to document the potential benefits of SFRT compared to conventional radiation therapy approaches and to compare different types of beam modulations and low and high LET irradiation scenarios among institutions. Computing the EUD requires input of 1) the physical dose distribution and 2) fitting the LQ model parameters α and β, which describe the radiation-response of a cell-line, tissue or tumor as a function of absorbed dose (or RBE-weighted dose) in a specific tissue region or cell culture. Another factor contributing to uncertainty in the dosimetry of highly modulated SFRT beams arises because of the challenges associated with measuring dose in small, highly modulated radiation fields, which in turn requires the ability to measure dose with high spacial resolution and high dynamic range to accurately characterize peak and valley doses. Measurement uncertainties are not commonly reported [19, 20] and the effects of this dosimetric uncertainty on estimates of the EUD are not well established. Similarly, the non-linear regression analysis of fits to cell survival data have large uncertainties because of uncertainties in plating efficiency, the number of replicate measurements per dose point and the limited range of doses used to characterize in vitro and in vivo radiation sensitivity. Most laboratory studies of cell survival involve a small number of dose points (
For the experimental design of our comparative experiments between uniform irradiation (one arm) and SFRT (alternate arm), we propose the conceptual schema illustrated in Figure 1. In the first step, cells are uniformly irradiated with a range of doses, D = D1, D2, D3, …, to determine the survival fraction of cells. In the next step, we conduct a non-linear regression analysis to determine LQ parameters αU and βU. A bootstrap sampling method is used to estimate the confidence interval on pairs of LQ parameters that fit the measured data about equally well. Bootstrapping is typically used to generate a large number of samples from a single original sample when only a small number of measurements is available and the distribution is unknown. Bootstrapped samples are generated from this mini-population to approximate the population distribution. For the second arm of the study, estimates of fit parameters are used in combination with the measured SFRT beam profiles to calculate the corresponding EUD for the non-uniform beams, EUD1, EUD2, EUD3, …, that presumably results in the same number of surviving cells for an SFRT irradiation scheme as the corresponding uniform dose. This assumes that the mechanisms of cell killing and recovery in SFRT irradiations are the same as for uniform irradiation and the cellular response only depends on the locally absorbed dose, i.e., cell cultures that receive the same EUD exhibit the same overall survival response. Should the mechanisms of cell killing underlying uniform and SFRT irradiation be the same, the parameters αU, βU should be identical to αSFRT, βSFRT within the uncertainties. Should the in vitro mechanisms of cell survival differ for SFRT and uniform irradiation, we expect differences in cell survival as a function of EUD, i.e., different values of αU, βU and αSFRT, βSFRT result in different estimates of the EUD.
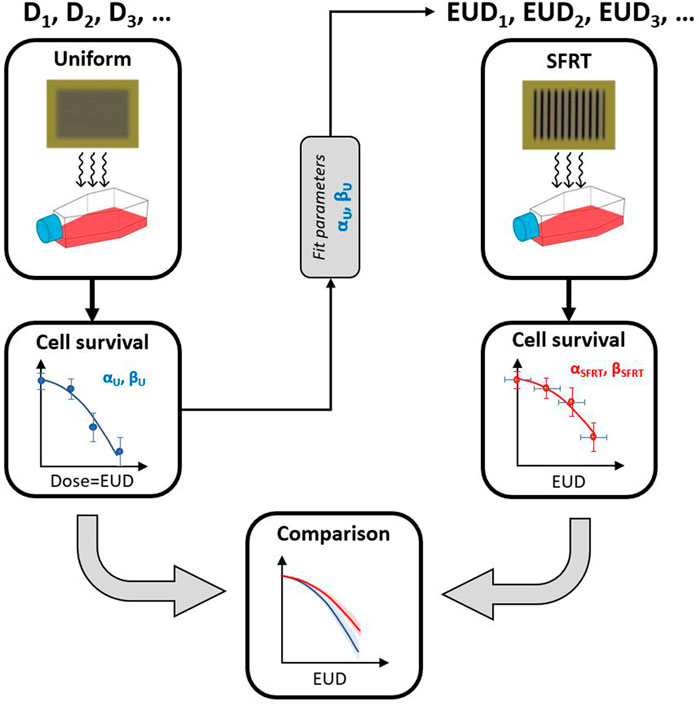
FIGURE 1. Schema to test the hypothesis that uniform and SFRT irradiation are biologically equivalent for in vitro cell survival. First, cells are uniformly irradiated at different dose levels to determine αU and βU. The LQ fit parameters are then used in combination with the SFRT profile to determine the corresponding EUD. Biological equivalence is achieved if cell survival at a certain EUD leads to the same level of cell survival, given the uncertainties in dose delivery and uncertainties associated with the non-linear regression analysis of the measured plating efficiencies over a finite dose rate. This hypothesis is equivalent to testing whether or not αU ≈ αSFRT and βU ≈ βSFRT.
For the approach illustrated in Figure 1, a difference in the cell survival between the two arms would indicate some effects that cannot be explained with our current radiobiological understanding of conventional (uniform) irradiation. In order to draw such a conclusion, a careful analysis of the uncertainties in the observed cell survival and the physical dosimetry is indispensable. In this manuscript we present such an analysis of cell survival after MRT and uniform x-ray exposure of two cancer and a normal tissue (non-cancer) cell line. The approach is generally applicable to other types of beams with different spatial modulation.
The ultimate aim of this work is to determine the dosimetric quantity that best correlates with cell survival. We also aim to test the hypothesis that uniform irradiation and SFRT irradiation of several cell lines in vitro provide evidence for differences in the biological mechanisms of cell survival. We aim to highlight the potential impact of uncertainties of SFRT dose delivery as well as the uncertainties associated with fitting the LQ model to uniform and SFRT irradiation conditions, especially as it relates to the calculation of the EUD for SFRT. In analogy with the concept of particle RBE, we propose a similar relative effectiveness factor (REF) to quantify the impact of SFRT on tumor and normal tissue cell lines relative to the uniform irradiation of the same.
2 Materials and methods
Multiple approaches to deliver SFRT [23] exist. MRT is one specialized form of SFRT. Throughout the methods, results, discussion and conclusions, the abbreviations MRT and SFRT are used as most appropriate. MRT is used for points and discussion specific to the presented in vitro experiments and the abbreviation SFRT as it relates to the larger implications for spatially fractionated radiation therapy.
2.1 Clonogenic cell survival experiments
The human tumor cell lines LN18 (human glioblastoma) and A549 (human lung adenocarcinoma) were cultured in Dulbecco’s Modified Eagle Medium (DMEM) high glucose (Sigma, Germany) and the normal tissue cell line MRC5 (human lung fibroblasts) was cultured in DMEM/F12 (ATCC, United States). Cells were seeded and incubated at 37°C, 5% CO2 24 h before irradiation. Uniform irradiation was conducted at the RS225 (X-Strahl, UK) with 220 kVp photons filtered with .15 mm of copper having a dose-rate of .89 Gy/min (approximate RBE relative to Co-60 gamma-rays of 1.2 [24]). MRT irradiation of cell cultures was performed with a XenX irradiator (X-Strahl, United Kingdom) using a 225 kVp photon spectrum filtered with .15 mm copper. The photon field was collimated to an MRT field with slit widths of 50 µm separated by a ctc (center-to-center) distance of 400 µm resulting in a total field size of 20 mm × 20 mm. The peak dose-rate was 4.6 Gy/min and the valley dose-rate .112 Gy/min [25]. The dose rates were measured using Gafchromic EBT3 films. A peak-to-valley-dose-ratio (PVDR) of 20 was achieved by combining MRT with uniform irradiation. To circumvent the limited dynamic range of the films, separate films were used to evaluate the dose and dose rate in peak and valley regions. Subsequently, the profiles were stitched together, only including parts of the films within the calibration range to end up with one valid dose profile for the entire microbeam field [26]. After irradiation, the cells were incubated for another 30 min at 37°C and 5% CO2 before single cell suspensions were obtained and cell numbers for each sample were counted three times using a hemocytometer. The cells were seeded in 6-well plates and after an incubation period of 2 weeks, each 6-well plate was washed with phosphate-buffered saline (PBS), fixed with methanol, and stained with crystal violet. For all 6-well plates, the number of colonies (at least 50 cells) was counted manually by means of the digital images and ultimately, both plating efficiency and survival fraction were determined. Plating efficiencies for three replicate measurements at each dose point were used for the non-linear regression analysis of LQ cell survival parameters.
2.2 LQ model and bootstrap analysis of uncertainty
The primary LQ model parameters of interest are α and β (or α and α/β). A standard approach to parameter estimation involves minimizing a positively weighted sum of errors with weights wi. This weighted sum of errors, sometimes termed a loss function or figure of merit (FOM), can be formulated in several different ways, depending on varying assumptions about the underlying probability model. The mathematical form of the loss function [27] impacts on the estimation of parameters, on confidence intervals, and on model inference. In our analyses, we used the following FOM to estimate LQ parameters, similar to [28]:
Here, N is the number of data points (absorbed dose values at which survival is evaluated), Si is the ith measurement of the surviving fraction, S is the model-predicted surviving fraction (Eq. 1) for the same exposure conditions, and α and β are the parameters in the model that are adjusted to minimize the loss function (or α and α/β). The weights are sampled for the ith dose point and replicate from an exponential distribution.
For all of the analyzed in vitro data sets, the loss function is minimized using a quasi-Newton optimization algorithm. To estimate the correlated distribution of α and β values that fit the measured data, we use a paired bootstrap method [29] with random weights [30], which is often referred to as the Bayesian bootstrap [31, 32]. Estimates of the mean value of α and β are based on 10,000 individual fits to the survival data. We use random weighting for each experiment and each dose, since standard bootstrap re-sampling [29] gives, with a large probability for small data sets, a degenerate answer when data with only one or a few points are used. In effect, the estimated values of α and β (and therefore α/β) from an LQ analysis of the measurements are highly correlated for most practical dose-response experiments, including ours.
2.3 EUD and cell survival
The EUD concept as formulated by Niemierko [33] is premised on the idea that any two dose distributions may be considered equivalent if they produce the same cell survival level. The EUD concept is easily generalized to equate uniform and non-uniform dose distributions to other endpoints, such as the amount of DNA damage, cell survival, tumor control or an early or late organ-at-risk (OAR) clinical endpoint of interest. The EUD for one endpoint may differ from the EUD for another endpoint because of dose, dose rate, dose-fractionation, and particle LET effects. Per definition in Niemierko [33], the EUD of a dose distribution, {D}, is the uniform dose that leads to an equal clonogenic survival in a cell culture (or presumably a region of tissue in vivo), i.e., SU(D = EUD) = SSFRT({D}). With the LQ cell survival model, EUD is therefore defined by the iso-survival relationship [34].
Here, vi is the fraction of cells receiving a dose Di. Taking the logarithm of both sides of Eq. 2 and solving for EUD yields
Two methods are used to estimate the parameters of interest from the in vitro data. In the first method, αU and αU/βU are estimated from survival data for uniform irradiation of the cell lines (Figure 1). Then they are applied to the calculation of cell survival and EUD for SFRT conditions. In the second method, estimates α and α/β are obtained from a fit to cell survival as a function of the EUD. The estimates of the EUD are based on values of α and α/β for uniform irradiation conditions (left-most panels in Figure 2).
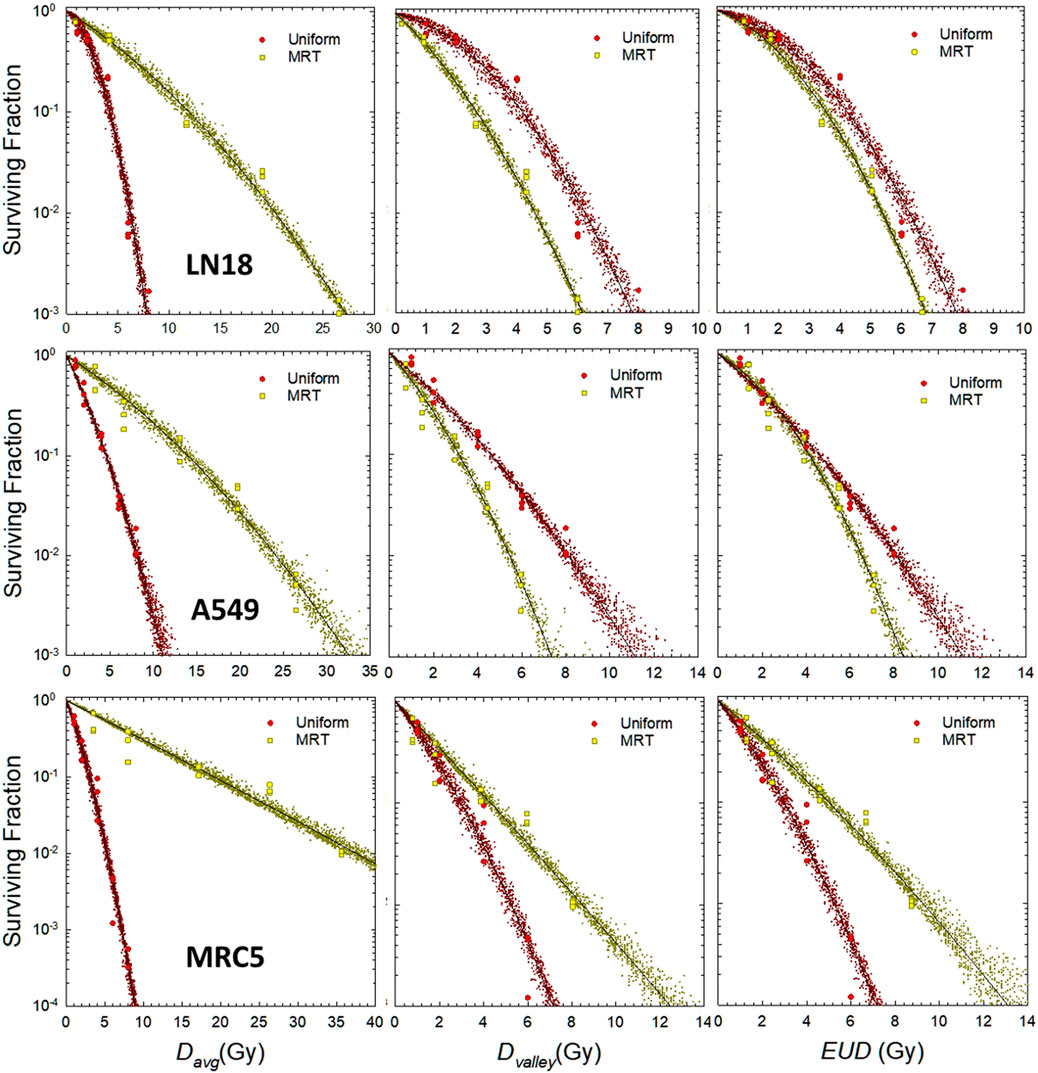
FIGURE 2. LQ analysis of in vitro cell survival for uniform and MRT irradiation for different cell lines. Top row: LN18, middle row: A549, bottom row: MRC5. Left column: SF vs. average dose, middle column: SF vs. valley dose, right column: SF vs. EUD. Yellow filled squares denote individual replicates of the measured surviving fraction for MRT irradiation. Red filled circles denote individual replicates of the measured surviving fraction for MRT irradiation. Small yellow and red crosses represent the prediction interval from the bootstrap sampling of individual pairs of α and β (see Figure 3). LQ fit parameters on EUD scale: LN18: α = .147 Gy−1, α/β = 1.55 Gy for uniform irradiation; α = .260 Gy−1, α/β = 2.33 Gy for SFRT. A549: α = .419 Gy−1, α/β = 23.2 Gy for uniform irradiation; α = .293 Gy−1, α/β = 4.62 Gy for SFRT. MCR5: α = .637 Gy−1, α/β = 13.9 Gy for uniform irradiation; α = 422 Gy−1, α/β = 52.7 Gy for SFRT.
2.4 Relative effectiveness factor
In analogy with particle RBE [22, 35], we propose a Relative Effectiveness Factor defined as the ratio of the uniform dose DU of radiation that achieves the same level of cell survival as the EUD for an SFRT treatment, i.e., REF ≡ DU/EUD. The EUD metric is widely used for clinical comparisons of uniform and non-uniform irradiation of tumor targets and OARs [36–38]. In terms of the LQ cell survival model, the REF can be computed as
Here, REFLD ≡ (αSFRT/αU) and
2.5 Simulations of dosimetric uncertainties
To investigate the impact of dosimetric uncertainties on the EUD a sensitivity analysis was carried out. MRT dose profiles were synthetically generated and parameterized to match the experimentally measured parameters: peak dose, valley dose, PVDR and beam penumbra, which is the transition area between the peak and valley and defined as the distance between 80% and 20% of the peak dose. Dosimetric uncertainties were systematically introduced to these parameters to investigate their effects on the resulting EUD. To isolate the effects of one specific parameter, all other parameters in the dose profile were kept constant and the parameter of interest was changed incrementally by ±5%, ±10% and ±20%. The effect on the EUD was analyzed for valley doses between 2 and 20 Gy while keeping the PVDR at 20.
The modeled MRT dose profiles matched the actual microbeams used for the clonogenic survival experiment described in Section 2.1 with a beam width of 50 μm, a ctc of 400 µm and a penumbra of 30 µm. For completeness, we also modeled a minibeam field consisting of 250 µm wide beams separated by a ctc of 1 mm and a penumbra of 140 µm and analyzed its effects on the EUD.
3 Results
3.1 Correlation of dosimetric quantities with cell survival
The results of the LQ analysis of in vitro cell survival data for the LN18 and A549 tumor cell lines, and the MRC5 normal tissue cell line are shown in Figure 2. The left most panels show LQ fits of cell survival against average dose (Davg), the middle panels show cell survival plotted against the valley dose (Dvalley), and the right-most panel shows cell survival as a function of the EUD. The EUD values shown in Figure 2 are based on estimates of α and β from the non-linear regression analysis of measured data for uniform irradiation conditions, i.e., αU and βU.
Figure 3 shows the distribution of pairs of α and β values that fit the in vitro data shown in Figure 2 about equally well, as determined by the bootstrap analysis outlined in Section 2.2. It is important to note that slightly smaller values of α can be offset by a slight increase in the value of β, and vice versa, without sacrificing the fit to the experimental observations over a finite dose range. The prediction interval for cell survival that corresponds to the pairs of LQ parameters shown in Figure 3 are illustrated by the small yellow and red circles in Figure 2. There is a clear separation between uniform irradiation and MRT in the cloud of α and β parameters for the MRC5 cell line (right panel of Figure 3), as expected from the lower panels of Figure 2. There is less separation in the cloud of α and β parameters for the LN18 and A549 cell lines, which is consistent with the data shown in the upper and middle panels of Figure 2. A large separation in the parameter clouds (Figure 3) and the plots of cell survival against EUD (right panel of Figure 3) are an indication that the biological mechanisms underlying in vitro reproductive cell survival are different for MRT and uniform irradiation.
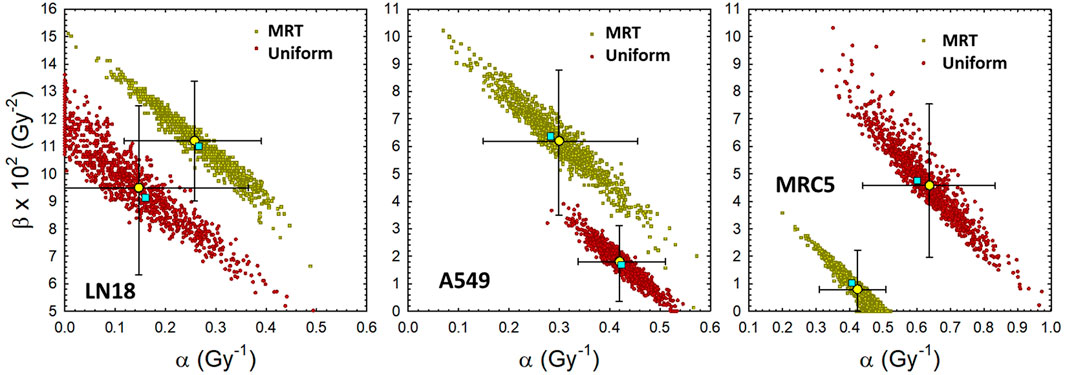
FIGURE 3. Distribution of LQ model parameters that fit the uniform and MRT cell survival data about equally well. Yellow filled circles denote mean of bootstrap analysis +95% CI. Other filled symbols denote individual pairs of α and β that fit the individual measurements of the surviving fraction (3 replicates per dose level). Cyan filled squares denote least-squares regression analysis based on average dose and average surviving fraction. Left: LN18 cells uniformly irradiated (αavg = .147 Gy−1, (α/β)avg = 1.55 Gy). Middle: A549 cells uniformly irradiated (αavg = .419 Gy−1, (α/β)avg = 23.2 Gy). Right: MRC5 cells uniformly irradiated (αavg = .637 Gy−1, (α/β)avg = 13.9 Gy).
The differences in the biological effectiveness of MRT irradiation relative to uniform irradiation for the three cell lines shown in Figures 2, 3 are depicted over a range of doses in Figure 4. The uncertainties at low doses are relatively large, especially for the LN18 cell line and therefore the results at low doses below approximately 2 Gy should be considered with a grain of salt. At 8 Gy the REF values are 1.14 ± .08, 1.32 ± .13 and .58 ± .06 for LN18, A549 and MRC5, respectively. A REF greater than unity (A549 and LN18 cells) indicates that in vitro MRT irradiation is more effective at killing these two tumor cell lines than uniform irradiation. A REF less than unity for the MRC5 cell line indicates that MRT is less effective at killing this cell line than uniform irradiation. Hence a REF
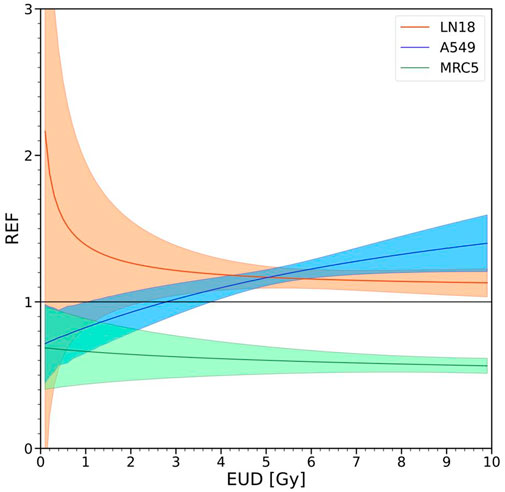
FIGURE 4. Effectiveness of SFRT relative to uniform irradiation. A value of the REF equal to unity indicates that αU = αSFRT and βU = βSFRT, i.e., evidence supporting the hypothesis that SFRT and uniform irradiation initiate equivalent cell killing mechanisms. Values of the REF smaller or larger than unity provide evidence against the equivalence of mechanisms of reproductive cell survival for SFRT and uniform irradiation. Values of the REF
3.2 Physical dose variation
The effects of simulated variations in certain physical dosimetric quantities in SFRT on the EUD, as described in Section 2.5, are shown in Figure 5. The upper left figure shows the relative difference in EUD as a function of relative changes in the valley dose, while keeping the PVDR constant at 20. A clear trend can be seen for both micro- and minibeam, with the relative error in the EUD approaching the equivalent error in the valley dose with increasing valley doses. The relative error rises faster for the microbeam geometry compared to the minibeams. The upper right figure illustrates the relative EUD deviations for differences in the valley dose while keeping the peak dose constant, resulting in different PVDRs. The impact on the EUD is essentially the same as if the PVDR was kept constant. The lower left figure shows the relative change in the EUD when introducing changes to the peak dose. The impact of deviations in the peak dose on the EUD decreases with increasing valley dose and drops below 1% for valley doses above 10 Gy for all cases. The relative error in the EUD is generally higher for the minibeam field. The effect of changes in the penumbra on the EUD are shown in the lower right figure. The impact on the EUD decreases with increasing dose in the valley again showing a higher impact for the minibeam geometry.
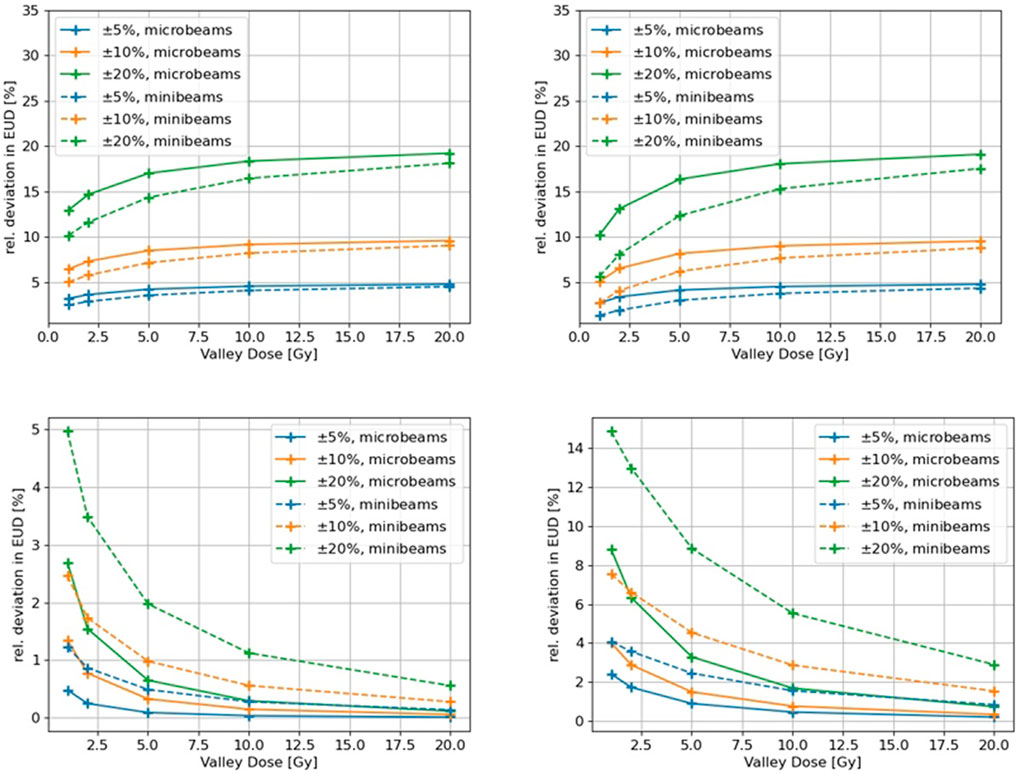
FIGURE 5. Effect of simulated dosimetric variations in characteristic SFRT parameters on the EUD for a micro- and a minibeam field. Upper left: Variation in the valley dose for a constant PVDR. Upper right: variation in the valley dose for a varying PVDR. Lower left: variation in the peak dose for varying PVDR. Lower right: Variation in the penumbra for a constant PVDR.
4 Discussion
The clinically relevant parameters for the assessment and comparison of SFRT and uniform radiation therapy treatments are a matter of ongoing debate [39]. Authors frequently report physical dose quantities, such as the peak, valley and average dose, in pre-clinical and clinical studies. Of these three dose metrics, valley dose has been experimentally found most predictive of normal tissue sparing [39–41]. For uniform irradiation and conventional fractionation schedules (e.g., daily target doses up to 10 to possibly 20 Gy, the LQ model often suffices as a reasonable dose-response model for the endpoints of in vitro cell survival, local tumor control and OAR toxicity. Clinically applied concepts, such as the equivalent dose in 2 Gy fractions (EQD2) and EUD, are derived from the LQ model and are useful concepts for the comparison of alternate treatment modalities and fractionation schedules. In this work, we investigated the potential usefulness of the LQ model and EUD concept in the analysis of in vitro cell survival for SFRT compared to uniform irradiation. While an identical EQD2 entails equal cell survival in temporally fractionated radiation therapy (e.g., different daily doses), identical EUD values imply equal levels of overall cell survival in a cell culture or tissue region of interest irradiated by spatially fractionated vs. uniform irradiation.
In Figure 2, we investigated the apparent differences in the in vitro biology of MRT and uniform irradiation for three cell lines. There are seemingly dramatic differences in the survival when average dose is used as the predictive metric for MRT relative to uniform irradiation (see left panels in Figure 2). This observation reflects the fundamental idea that cells in the peak-dose region of an SFRT field are all effectively sterilized whereas the cells in the valley region are the predominantly ones that survive. Average dose is therefore a poor predictor of SFRT outcomes because it is a simple average of the peak and valley dose, weighted for the width (area) of the peak and valley regions of an SFRT field. Average dose neglects the dramatic spatial differences in cell survival and sterilization across a SFRT field compared to uniform irradiation. In line with this observation, the middle panels in Figure 2 demonstrate that the differences in cell survival after SFRT and uniform irradiation are much more closely aligned in terms of valley dose, as expected since it is the cells in the valley region of a SFRT field are the ones most likely to survive. EUD is largely more predictive of SFRT than any physical dose parameters (right-most panels in Figure 2) because the EUD concept accounts for all cell survival, even in the penumbra region of an SFRT field, rather than the more simplistic approach that assumes only two dose levels (peak and valley dose).
As illustrated in Figure 5, the impact of the beam width and penumbra on EUD increases with decreasing valley dose and as the ctc distance changes. The impact of beam penumbra and the ctc on EUD increases as the ratio R
An uncertainty in beam width or beam penumbra ΔR will lead to a relative survival uncertainty
which is small for large R. Therefore it can be concluded that the dominating quantity for the biological outcome of an SFRT exposure is the valley dose. This is in line with the recent findings in a review of preclinical studies [39], where it was found that “the valley dose (rather than the peak dose) correlates best with treatment outcome.” At large fraction sizes the EUD becomes approximately equal to the valley dose.
Of note, the accuracy of the LQ model is often challenged for doses much larger than α/β—often on the order of 8–10 Gy for uniform irradiation. This observation implies that the LQ model might be less useful (accurate) for the analysis of SFRT irradiation than for equivalent uniform doses of radiation beyond 10–20 Gy. As illustrated in the left panels in Figure 2 the LQ model fits in vitro cell survival for average doses up to 30–40 Gy, and valley dose and EUD up to 10–14 Gy. This observation provides evidence that the LQ model is useful and suffices for the analysis of SFRT studies in the range shown here. The reason the LQ model is useful for the analysis of SFRT irradiations arises because it is cells in the valley and adjacent, lower dose penumbra regions of an SFRT field that dominate the overall survival response. For the range of PVDR values and dose ranges considered in the reported in vitro experiments, the inaccurate behavior of LQ model for large doses compared to α/β are largely irrelevant.
It is intriguing to consider the possibility that tumor cell lines may respond differently to SFRT irradiation than normal cells, although additional studies comparing tumor and normal cell lines are warranted. If the mechanisms of action for cell survival were the same for SFRT and uniform irradiation, the data for cell survival vs. EUD (Figure 2) and LQ parameter clouds (Figure 3) would overlap with each other. The deviations seen in Figures 2, 3 are consistent with the hypothesis that SFRT and uniform cell irradiation initiate mechanisms or modes of reproductive cell survival that differ to some extent. To the authors knowledge this is the first time that this difference has been quantified by using the newly introduced REF.
Accounting for the variability in plating efficiency seen in Figures 2, 3, it is reasonable to conclude that the tumor cell lines (LN18 and A549) exhibit small differences in cell survival when plotted against EUD. For human lung fibroblasts (MRC5 cell line), there seems to be considerable differences in survival for SFRT and uniform irradiation, as also reflected in the REF factor shown in Figure 4. The estimated uncertainties in the absorbed dose for the SFRT cell culture irradiations are on the order of 5%–10%. Hence, differences in survival between SFRT and conventional treatments with X-rays are smaller than the dosimetric uncertainties for the A549 and LN18 cell lines but may not be so for the MRC5 cell lines. The survival mechanisms of tumour cell lines (A549 and LN18) differ significantly from that of the MRC5 human lung fibroblast cell line after SFRT. However, it remains unclear whether there is an enhanced sparing of MRC5 or a reduced survival of the tumour cell lines.
Figure 4 defines a new, proposed metric to compare the effectiveness of SFRT relative to the uniform irradiation of cell cultures, or potentially in vivo regions of tissue. In vitro, the trends in the REF are cell-line and dose-dependent, especially at lower doses and plateauing towards higher doses. For small doses (
Repeat experiments are needed under the same settings to further quantity the joint experimental uncertainties associated with the SFRT dosimetry and the uncertainty in in vitro plating efficiencies. It would also be useful to extend the range of the uniform irradiation to better mimic the range of doses used in the SFRT experiments and to further map out the dose dependence of the REF. To further test and probe the concepts and results for X-ray irradiations, the experiments should be repeated with different beam types, such as protons, with consideration of the different RBE. Similar in vitro experiments for additional tumor- and normal-cell lines are needed to confirm or refute some of the reported results.
Are the biological mechanisms underlying cell survival in SFRT different from those in more uniform dose irradiation? By applying the EUD, we assume the classical mechanisms of radiation biology suffice, i.e., the survival response of one cells is independent of the survival response of other cells. Therefore, we can attribute deviations between the biological reactions towards SFRT and conventional treatments at identical EUD to differences in SFRT and uniform irradiation cell survival mechanisms that are not fully captured in the LQ model. Examples of such in vivo mechanisms include immune system responses and the effects of the tissue microenvironment, including the effects of reactive oxygen species and inflammatory signaling. However, in in vitro experiments the aforementioned factors do not, or are unlikely to, play a role. Bystander effects (inter cellular communication) or physiochemical changes in the cell culture medium are the most likely explanations for the observed differences in survival for conventional and SFRT exposures (Figures 2–4).
5 Conclusion
New in vitro data for three cell lines irradiated by SFRT and uniform irradiation schemes are reported for a dose range applicable to radiation therapy. The use of Bayesian bootstrap sampling to more accurately quantify the impact of uncertainties in LQ and EUD modeling of comparative studies of SFRT and uniform irradiation is useful and applicable to pre-clinical and to clinical studies of SFRT biological endpoints and outcomes. The simulation of SFRT irradiations illustrates the impact of dosimetric uncertainties, especially in the field penumbra and valley dose, which are specific to the design of the SFRT irradiation scheme.
The reported studies provide clear evidence that EUD is more predictive of in vitro cell survival for SFRT irradiations than physical dose quantities such as average or valley dose. Since EUD more fully and directly accounts for spatial variations in dose and cell survival across millimeter and sub-millimeter regions of an irradiated cell culture, it appears more predictive of SFRT cell survival than average or peak dose. As such, spatial variations in biological damage are also relevant in vivo, we recommend the use of EUD as the dosimetric metric for the comparative analysis of SFRT and uniform irradiation and discourage the use of the physical dose quantities peak dose and average dose as they can potentially be misleading and should not be used for comparisons of different types of spatial modulations and different doses. The valley dose is the most useful physical dose quantity as at higher doses the EUD approaches the valley dose. Additional in vitro and in vivo studies are needed to further test and quantify the similarities and differences in biological mechanisms arising from SFRT and uniform irradiation. The proposed concept of a relative effectiveness factor for SFRT relative to uniform irradiation is useful for inter-institutional comparisons in the same way that the concept of particle RBE is useful for comparing the effectiveness of x-rays to higher LET radiations and enables the quantification of the biological response relative to known biology.
Data availability statement
The original contributions presented in the study are available from the corresponding author.
Author contributions
SBi and TS planned and performed the irradiation experiments with MA and SBa. MA and SBa were responsible for the dosimetry. MA conducted the simulations of dosimetric uncertainties and contributed to the data analysis and figures. RS performed the Bayesian bootstrap analysis and contributed to the data analysis and figures. JM conceptualized the manuscript and the relative effectiveness factor, wrote the first draft, and contributed to the data analysis and figures. MA, SBi, RS, SBa, TS, and JM wrote sections of the manuscript. SC initiated and enabled this collaboration and provided feedback and guidance. All authors contributed to manuscript revision, read, and approved the submitted version.
Funding
Part of this work was supported by Helmholtz AI (ARTERY) the DAAD (Deutsche Akademische Austauschdienst) and the DFG (Deutsche Forschungsgesellschaft) grant number: 416790481.
Conflict of interest
The authors declare that the research was conducted in the absence of any commercial or financial relationships that could be construed as a potential conflict of interest.
Publisher’s note
All claims expressed in this article are solely those of the authors and do not necessarily represent those of their affiliated organizations, or those of the publisher, the editors and the reviewers. Any product that may be evaluated in this article, or claim that may be made by its manufacturer, is not guaranteed or endorsed by the publisher.
References
1. Billena C, Khan AJ. A current review of spatial fractionation: Back to the future? Br J Radiol (2019) 104:177–87. doi:10.1016/j.ijrobp.2019.01.073
2. Mayr NA, Snider JW, Regine WF, Mohiuddin M, Hippe DS, Peñagarícano J, et al. An international consensus on the design of prospective clinical-translational trials in spatially fractionated radiation therapy. Adv Radiat Oncol (2021) 7:100866. doi:10.1016/j.adro.2021.100866
3. Duriseti S, Kavanaugh J, Goddu S, Price A, Knutson N, Reynoso F, et al. Spatially fractionated stereotactic body radiation therapy (lattice) for large tumors. Adv Radiat Oncol (2021) 6:100639. doi:10.1016/j.adro.2020.100639
4. Mohiuddin M, Lynch C, Gao M, Hartsell W. Early clinical results of proton spatially fractionated grid radiation therapy (sfgrt). Br J Radiol (2020) 93:20190572. doi:10.1259/bjr.20190572
5. Slatkin DN, Spanne P, Dilmanian FA, Gebbers J-O, Laissue JA. Subacute neuropathological effects of microplanar beams of x-rays from a synchrotron wiggler. Proc Natl Acad Sci USA (1995) 92:8783–7. doi:10.1073/pnas.92.19.8783
6. Bartzsch S, Corde S, Crosbie JC, Day L, Donzelli M, Krisch M, et al. Technical advances in x-ray microbeam radiation therapy. Phys Med Biol (2020) 65:02TR01. doi:10.1088/1361-6560/ab5507
7. Prezado Y, Fois GR. Proton-minibeam radiation therapy: A proof of concept. Med Phys (2013) 40:031712. doi:10.1118/1.4791648
8. Zlobinskaya O, Girst S, Greubel C, Hable V, Siebenwirth C, Walsh DW, et al. Reduced side effects by proton microchannel radiotherapy: Study in a human skin model. Radiat Environ Biophys (2013) 52:123–33. doi:10.1007/s00411-012-0450-9
9. Wu X, Ahmed MM, Wright J, Gupta S, Pollack A. On modern technical approaches of three-dimensional high-dose lattice radiotherapy (lrt). Cureus (2010) 2:e9. doi:10.7759/cureus.9
10. Bräuer-Krisch E, Serduc R, Siegbahn EA, Le Duc G, Prezado Y, Bravin A, et al. Effects of pulsed, spatially fractionated, microscopic synchrotron X-ray beams on normal and tumoral brain tissue. Mutat Res (2010) 704:160–6. doi:10.1016/j.mrrev.2009.12.003
11. Bouchet A, Serduc R, Laissue JA, Djonov V. Effects of microbeam radiation therapy on normal and tumoral blood vessels. Physica Med (2015) 31:634–41. doi:10.1016/j.ejmp.2015.04.014
12. Prezado Y, Deman P, Varlet P, Jouvion G, Gil S, Le Clec’H C, et al. Tolerance to dose escalation in minibeam radiation therapy applied to normal rat brain: Long-term clinical, radiological and histopathological analysis. Radiat Res (2015) 184:314–21. doi:10.1667/rr14018.1
13. Girst S, Greubel C, Reindl J, Siebenwirth C, Zlobinskaya O, Walsh DW, et al. Proton minibeam radiation therapy reduces side effects in an in vivo mouse ear model. Int J Radiat Oncol Biol Phys (2016) 95:234–41. doi:10.1016/j.ijrobp.2015.10.020
14. Trappetti V, Fazzari JM, Fernandez-Palomo C, Scheidegger M, Volarevic V, Martin OA, et al. Microbeam radiotherapy-a novel therapeutic approach to overcome radioresistance and enhance anti-tumour response in melanoma. Int J Mol Sci (2021) 22:7755. doi:10.3390/ijms22147755
15. Prezado Y, Jouvion G, Hardy D, Patriarca A, Nauraye C, Bergs J, et al. Proton minibeam radiation therapy spares normal rat brain: Long-term clinical, radiological and histopathological analysis. Scientific Rep (2017) 7:14403. doi:10.1038/s41598-017-14786-y
16. Meyer J, Stewart R, Smith D, Eagle J, Lee E, Cao N, et al. Biological and dosimetric characterisation of spatially fractionated proton minibeams. Phys Med Biol (2017) 62:9260–81. doi:10.1088/1361-6560/aa950c
17. Kraus KM, Winter J, Zhang Y, Ahmed M, Combs SE, Wilkens JJ, et al. Treatment planning study for microbeam radiotherapy using clinical patient data. Cancers (2022) 14:685. doi:10.3390/cancers14030685
18. Balderson MJ, Kirkby C. Potential implications of the bystander effect on TCP and EUD when considering target volume dose heterogeneity. Int J Radiat Biol (2015) 91:54–61. doi:10.3109/09553002.2014.942014
19. Pellicioli P, Bartzsch S, Donzelli M, Krisch M, Bräuer-Krisch E. High resolution radiochromic film dosimetry: Comparison of a microdensitometer and an optical microscope. Physica Med (2019) 65:106–13. doi:10.1016/j.ejmp.2019.08.012
20. Peucelle C, Nauraye C, Patriarca A, Hierso E, Fournier-Bidoz N, Martínez-Rovira I, et al. Proton minibeam radiation therapy: Experimental dosimetry evaluation. Med Phys (2015) 42:7108–13. doi:10.1118/1.4935868
21. Paganetti H, Blakely E, Carabe-Fernandez A, Carlson DJ, Das IJ, Dong L, et al. Report of the aapm tg-256 on the relative biological effectiveness of proton beams in radiation therapy. Med Phys (2019) 46:e53–e78. doi:10.1002/mp.13390
22. Stewart R, Carlson D, Butkus M, Hawkins R, Friedrich T, Scholz M. A comparison of mechanism-inspired models for particle relative biological effectiveness (rbe). Med Phys (2018) 45:e925–52. doi:10.1002/mp.13207
23.Zhang H, and Mayr N, editors. Spatially fractionated, microbeam and flash radiation therapy. A Physics and multi-disciplinary approach. Temple Circus Temple Way, Bristol BS1 6HG, UK: IOP Publishing (2022).
24. Stewart RD, Streitmatter SW, Argento DC, Kirkby C, Goorley JT, Moffitt G, et al. Rapid mcnp simulation of dna double strand break (dsb) relative biological effectiveness (rbe) for photons, neutrons, and light ions. Int J Radiat Biol (2015) 7:8249–74. doi:10.1088/0031-9155/60/21/8249
25. Treibel F, Nguyen M, Ahmed M, Dombrowsky A, Wilkens JJ, Combs SE, et al. Establishment of microbeam radiation therapy at a small-animal irradiator. Int J Radiat Oncol Biol Phys (2021) 109:626–36. doi:10.1016/j.ijrobp.2020.09.039
26. Bartzsch S, Lott J, Welsch K, Bräuer-Krisch E, Oelfke U. Micrometer-resolved film dosimetry using a microscope in microbeam radiation therapy. Med Phys (2015) 42:4069–79. doi:10.1118/1.4922001
27. Carlson D, Stewart R, Xa L, Jennings K, Wang J, Guerrero M. Comparison ofin vitroandin vivo/ ratios for prostate cancer. Phys Med Biol (2004) 49:4477–91. doi:10.1088/0031-9155/49/19/003
28. Carlson D, Stewart R, Va S. Effects of oxygen on intrinsic radiation sensitivity: A test of the relationship between aerobic and hypoxic linear-quadratic (LQ) model parametersa). Med Phys (2006) 33:3105–15. doi:10.1118/1.2229427
29. Efron B. Bootstrap methods: Another look at the jackknife. Ann Stat (1979) 7:1–26. doi:10.1214/aos/1176344552
32. Wu C. Jackknife, bootstrap and other resampling methods in regression analysis (with discussions). Ann Stat (1986) 14:1261–350. doi:10.1214/aos/1176350142
33. Niemierko A. Reporting and analyzing dose distributions: A concept of equivalent uniform dose. Med Phys (1997) 24:103–10. doi:10.1118/1.598063
34. Bartzsch S, Stewart R, Meyer J. Chapter 14: Radiobiology modelling and equivalent uniform dose for spatially fractionated radiation therapy. Temple Circus Temple Way, Bristol BS1 6HG, UK: IOP Publishing (2022).
35. Jäkel O, Bert C, Fossati P, Kamada T, Karger C, Matsufuji N, et al. ICRU report 93: Prescribing, recording and reporting light ion beam therapy. J ICRU (2016) 16. doi:10.1093/jicru/ndy025
36. Emami B, Lyman J, Brown A, Coia L, Goitein M, Munzenrider JE, et al. Tolerance of normal tissue to therapeutic irradiation. Int J Radiat Oncol Biol Phys (1991) 21:109–22. doi:10.1016/0360-3016(91)90171-y
37. Mohan R, Wang X, Jackson A, Bortfeld T, Boyer AL, Kutcher GJ, et al. The potential and limitations of the inverse radiotherapy technique. Radiother Oncol (1994) 32:232–48. doi:10.1016/0167-8140(94)90023-x
38. Wu Q, Djajaputra D, Wu Y, Zhou J, Liu HH, Mohan R. Intensity-modulated radiotherapy optimization with gEUD-guided dose-volume objectives. Phys Med Biol (2003) 48:279–91. doi:10.1088/0031-9155/48/3/301
39. Fernandez-Palomo C, Chang S, Prezado Y. Should peak dose be used to prescribe spatially fractionated radiation therapy?—a review of preclinical studies. Cancers (2022) 14:3625. doi:10.3390/cancers14153625
40. Serduc R, Bouchet A, Bräuer-Krisch E, Laissue JA, Spiga J, Sarun S, et al. Synchrotron microbeam radiation therapy for rat brain tumor palliation–influence of the microbeam width at constant valley dose. Phys Med Biol (2009) 54:6711–24. doi:10.1088/0031-9155/54/21/017
Keywords: microbeam, minibeam, Equivalent Uniform Dose (EUD), biological dose, Relative Effectiveness Factor (REF), Spatially Fractionated Radiation Therapy (SFRT), Microbeam Radiation Therapy (MRT), relative biological effectiveness (RBE)
Citation: Ahmed M, Bicher S, Stewart RD, Bartzsch S, Schmid TE, Combs SE and Meyer J (2023) Dosimetric quantities and cell survival for spatially fractionated radiation therapy. Front. Phys. 10:1064860. doi: 10.3389/fphy.2022.1064860
Received: 08 October 2022; Accepted: 14 December 2022;
Published: 04 January 2023.
Edited by:
Marie Vanstalle, Université de Strasbourg, FranceReviewed by:
Thomas Friedrich, Helmholtz Association of German Research Centres (HZ), GermanyChristian Finck, UMR7178 Institut pluridisciplinaire Hubert Curien (IPHC), France
Copyright © 2023 Ahmed, Bicher, Stewart, Bartzsch, Schmid, Combs and Meyer. This is an open-access article distributed under the terms of the Creative Commons Attribution License (CC BY). The use, distribution or reproduction in other forums is permitted, provided the original author(s) and the copyright owner(s) are credited and that the original publication in this journal is cited, in accordance with accepted academic practice. No use, distribution or reproduction is permitted which does not comply with these terms.
*Correspondence: Juergen Meyer, anVlcmdlbkB1dy5lZHU=
†These authors have contributed equally to this work and share first authorship