 Rui Guo
 Lei Zhang
 Yaohui Zheng
 Hui Yao1
- 1Department of Physics, Shanxi Agricultural University, Jinzhong, China
- 2State Key Laboratory of Quantum Optics and Quantum Optics Devices, Institute of Laser Spectroscopy, Shanxi University, Taiyuan, China
- 3State Key Laboratory of Quantum Optics and Quantum Optics Devices, Institute of Opto-Electronics, Shanxi University, Shanxi University, Taiyuan, China
Coal resources play a very important role in the energy structure, especially in the field of thermal power generation. However, in thermal power generation, coal resources can’t be used efficiently for various reasons, resulting in a waste of energy. Due to the advantages of many kinds of elements and rapid measurement, X-fluorescence spectroscopy (XRF) can rapid measurement a variety of metal elements in coal. Combined with partial least squares (PLS), the relationship between a variety of elements and ash in coal can be established, and the ash value in the measured coal can be quickly obtained, which can effectively guide the coal combustion process of power plant, so as to improve the utilization rate of coal. The experimental results show that under the PLS model, XRF technology has good measurement results for the ash content of 45 calibration set coal samples, in which the determination coefficient of the fitting curve (R2) reaches 0.946, and the root mean square error (RMSE) is only 1.177%. The accuracy of the model is further predicted under a cross validation. 15 validation set coal samples are brought into the model for prediction. According to the prediction results, the R2 reaches 0.982, and RMSE is only 0.726%. Finally, four of the 60 samples are randomly selected for stability test, and the relative standard deviation (RSD) is less than 1%. Therefore, the quantitative analysis method of XRF method based on PLS model has high accuracy and stability, which can provide guidance for rapid online measurement of coal ash and coal blending.
1 Introduction
According to the statistical bulletin of the people’s Republic of China on national economic and social development in 2020, the output of raw coal is 3.9 billion tons, an increase of 1.4% month on month. China is still a large coal producing country, in which thermal power generation is the main purpose. According to statistics, China’s thermal power installed capacity in 2020 is 1.245 billion kW, a year-on-year increase of 4.7%. Therefore, the structure of coal energy as the main energy will not change in a short period of time. And as a non-renewable resource, its usage is increasing year by year. In the environment of advocating clean energy and developing sustainable renewable economy, the efficient and clean utilization of coal resources is very important [1].
The main indicators of coal include calorific value, ash and volatile content. Ash is the residue of coal sample after complete combustion under specified conditions. It is an important indicator to study the characteristics and utilization of coal. This indicator has a significant relationship with the problems of corrosion, contamination and slagging in the coking industry and coal power generation applications. The higher the ash content of the coal, the lower the effective carbon yield. Based on this, the furnace type selection and coal ash utilization research can be carried out. Commercially, the price can be determined according to the coal ash content [2, 3]. The ash content in coal comes from minerals, mainly including calcium oxide, magnesium oxide, silicon oxide and other metal oxides. All these elements are positively correlated with ash content. The ash content in coal can be detected by the measurement of these metal elements.
For ash content detection, coal-fired power plants now generally apply the fast ash method specified in “GB/T 212–2008 Industrial Analysis Method for Coal”. This method takes 2–3 h, and the program is redundant, which seriously lags behind industrial production, so it is difficult to provide on-site real-time guidance on boiler combustion. Recently, laser induced breakdown spectroscopy (LIBS) [4], neutron activation technology (PGNAA) [5], γ-ray backscattering method [6] can be used for rapid and real-time detection of ash in coal. For example, Liu et al. determined 14 elements (Si, Al, Ca and other metal elements) in ash of coal by laser-induced breakdown spectrum (LIBS). They digested the coal ash with nitric acid and hydrofluoric acid, and then added boric acid solution to decompose fluoride deposits. The results show that the RSD of the determined elements is less than 5% [7]. Yao et al. extracted the coal ash content from the LIBS through multivariate analysis. The results showed that a good consistency was observed between the ash content provided by the thermogravimetric analyzer and the PLS regression model coupling of the LIBS measured value with the unknown sample [8]. However, the measurement stability of LIBS is poor. Liang et al. designed an online ash detection system for coal quality based on PGNAA technology and the test results showed that the dynamic standard deviation of ash measurement in the system was 0.105%, which realized the intelligent control of heavy medium block cleaned coal ash [9]. Although this method has high measurement accuracy, it has high cost and safety problems such as radiation. Cheng et al. made accurate measurement of coal ash composition by γ-ray backscattering and established a correction model for γ-ray measurement. The test results show that the correction model improves the measurement accuracy and overcomes the shortcomings of frequent instrument calibration [10]. The principle of this method is simple and the operation cost is low. However, the analysis results are greatly affected by the change of coal composition, and needs constant calibration and correction to stabilize the measurement.
In recent years, X-ray fluorescence spectrometry as a mature technology has been widely used in many fields because of its advantages of fast analysis speed, wide measurement range, low anti-interference, analysis of most elements, and analysis of solid, powder, molten beads, liquid and other samples [11–13]. The principle is that the X-ray tube excites the measured sample by generating incident X-rays. Each element in the excited sample will emit specific X-fluorescence of the element. The detection system measures the energy or wavelength of the emitted X-fluorescence and can convert it into the types of corresponding elements in the sample [14, 15]. In addition, the intensity of fluorescent X-rays has a certain relationship with the content of corresponding elements, based on which, quantitative analysis of elements can be carried out. The analysis of ash in coal by X-ray fluorescence spectrometry has been studied by many researchers. For example, Song et al. established a melt preparation method for the determination of SiO2, Al2O3, Fe2O3 and other metal compounds in fly ash, which improved the determination accuracy. The accuracy and precision of the final results were acceptable [16]. Wang et al. prepared samples by melting method and determined the contents of SiO2, MgO, Al2O3 and TiO2 in coal gangue with clay and slag national standard samples. The results show that this method had good measurement accuracy for coal gangues from different producing areas and can completely replace wet chemical analysis as a conventional analysis method of coal gangue [17]. Bao et al. described an X-ray fluorescence method for direct determination of 23 elements in coal. The ash content in actual coal was simulated, and the sample was prepared from a mixture of reference materials such as graphite and cellulose. The internal standard method, two-step correction method or scattered radiation empirical coefficient method were used to obtain low detection limit, good precision and accuracy [18]. In order to improve the accuracy of online XRF analysis of granular coal, Jia et al. established a distance correction method through iteration based on the relationship between XRF strength and distance. By comparing the results before and after the application of distance correction method, it showed that the measurement accuracy of online XRF analysis of granular coal was improved [19]. Pearce et al. directly carried out multi-element analysis of coal powder by X-ray fluorescence spectrometry. The relative standard deviation of chlorine, sulfur and phosphorus in coal and the calculated slagging index and scaling coefficient were less than 7% [20]. Feng et al. applied the partial least squares (PLS) model to the concentration measurement of coal elements. The non-linear self-absorption and inter element interference were described effectively and accurately. The PLS model obtains the same calibration quality and reduces the predicted root mean square error (RMSEP) from 4.47% to 3.77% [21].
Partial Least Squares (PLS) has become one of the most important modeling methods in quantitative analysis because of its high prediction accuracy [22]. This method overcomes the collinearity problem and solves the problems of insufficient samples and multiple dependent variables to a certain extent. It belongs to a small sample modeling method. It combines the advantages of principal component analysis (PCA) and multiple linear regression (MLR) analysis, and it can quickly and accurately find out the relationship between independent variables and dependent variables. The ash value in coal is positively correlated with the content of the metal elements (Al, Fe, Ca, etc.) contained therein. Therefore, the strong correlation between the various elements in coal and ash can be established through the PLS model.
Therefore, X-ray fluorescence spectroscopy has become more and more widely used in coal measurement methods, which can quickly and accurately analyze ash in coal. In the analysis algorithm, partial least squares (PLS) combine the advantages of PCA and MLR to accurately predict the ash value in coal. In this paper, the advantages of rapid analysis of various elements in coal ash by X-ray fluorescence and modeling by PLS algorithm can predict the ash content in coal with high accuracy and high stability. Leave-one-out cross validation was added to the PLS model to further verify the accuracy of the model, and the prediction results were also very accurate. This method is expected to provide a theoretical basis for coal burning detection in power plants.
2 Materials and methods
2.1 Coal sample
In the experiment, 60 coal samples used for combustion and power generation in a power plant were collected. These samples were all from different regions or cities in Shanxi Province. These coal samples were dried and tested by chemical methods to obtain the standard value of ash. As shown in Table 1, the standard value of ash of 60 coal samples is listed. 60 samples are divided into calibration set (45 coal samples, recorded as C1-C45) and validation set (15 coal samples, recorded as V1-V15). Among them, the spectral data of calibration set coal samples are used to establish the ash prediction model, and the validation set coal samples are used to verify the quantitative analysis performance of the model. Here, the ash standard value range of 15 coal samples in the validation set is included in the calibration set to ensure the accuracy of the validation results. Four of the 60 coal samples were selected for repeatability test to verify the stability of XRF for ash detection.
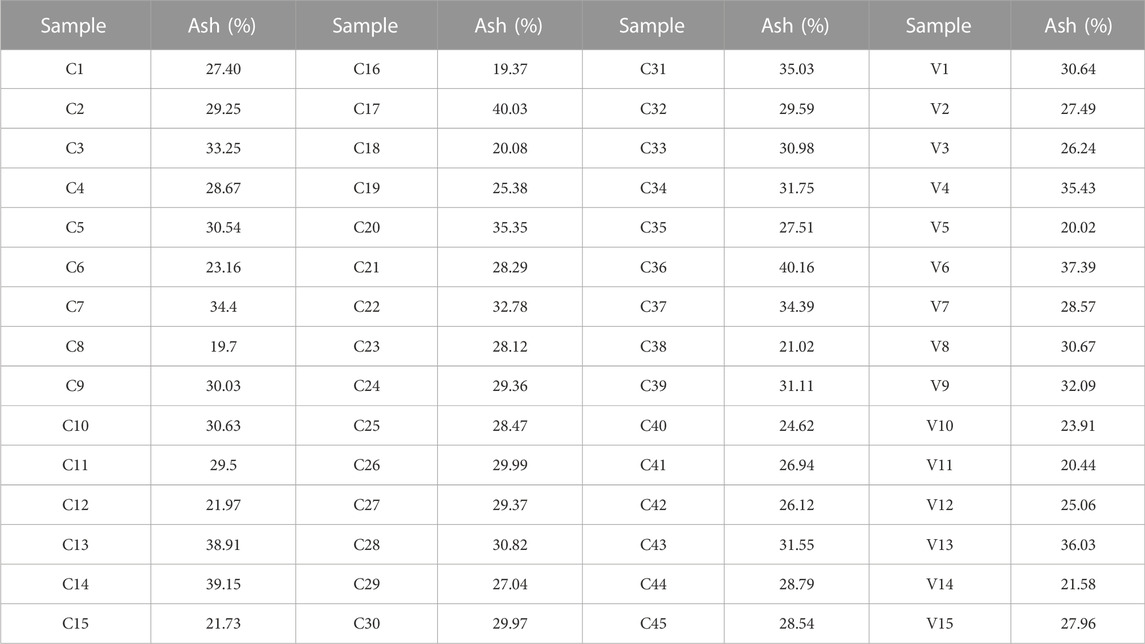
TABLE 1. Standard ash value of 60 coal samples.
2.2 XRF setup
As shown in Figure 1, XRF experimental device is mainly composed of X-ray tube (rhodium target), Ultra-high performance silicon drift detector (SDD), vacuum chamber, high-voltage power supply, vacuum pump and PC, which belongs to energy dispersion type. After the high-voltage power supply supplies power to the X-ray tube, the X-ray is generated and acts on the sample of the sample table in the vacuum chamber. The signal light generated by the interaction between the X-ray and the sample is detected by SDD and finally input to the PC terminal to obtain the spectrum. During measurement, the vacuum chamber always maintains a vacuum of 150 Pa, which is controlled by the vacuum pump. Here, the current and voltage of the X-ray tube are 0.3 mA and 10 kV respectively, and the measurement time of each sample is 30 s. Because X-ray is sensitive to temperature change, which will affect the accuracy of the final spectral line, the whole experiment is kept under constant temperature control at 25 an.
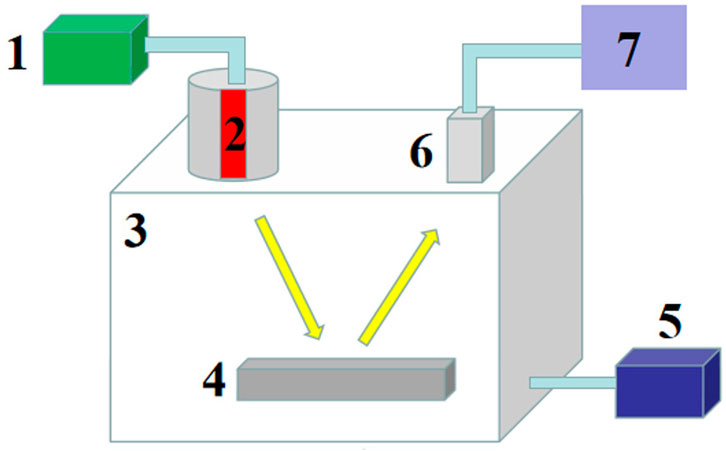
FIGURE 1. XRF experimental setup, here, 1, high-voltage power supply; 2, X-ray tube; 3, vacuum chamber; 4, sample table; 5, vacuum pump; 6, SDD; 7, PC.
2.3 Validation algorithm and model
In PLS modeling, in the given modeling samples, take out most of the samples to build the model, and leave a small part of the samples to predict with the newly established model. This process is repeated until all samples are predicted once and only once. Only one in the original sample is used as the validation set, while the rest is left as the calibration set. This step continues until each sample is treated as a validation data. In addition, the over fitting problem is avoided by leaving one method for cross validation. The robustness of the current PLS model is proved by different calibration, segmentation and prediction samples. The principle is to establish a linear regression model between independent variables and dependent variables, as shown in the following equation:
where Y is the response matrix with m variables and n sample points, X is the input matrix with p variables and n sample points, A is the regression coefficient matrix, and B is the correction coefficient.
Here, the determination coefficient (R2) and root mean square error (RMSE) of the fitting curve are used to illustrate the accuracy of the model, and the relative standard deviation (RSD) is used to illustrate the stability of the repeated measurement of coal samples by XRF method. R2, RMSE and RSD are formulated as follows:
where Yi is the predicted mean of the ith sample, Yj is the true value of the ith sample, and Y is the mean of all the samples.
where yi is the ith predicted value of the sample, yj is its corresponding true value, and n is the number of samples.
where yk is the kth predicted value of a sample, ya is the predicted mean of a sample, and m is the number of samples. The closer R2 is to 1, the better the curve fitting is, and the closer the predicted value is to the standard value. The closer the RMSE is to 0, the more accurate the prediction is. The smaller the RSD, the more stable the coal ash value measured by this method.
3 Results and discussion
3.1 Spectrum
As shown in Figure 2, the XRF spectrum of coal sample is shown. The abscissa represents the track number, which corresponds to the energy of each element, and the ordinate represents the intensity. The metal elements related to ash in the coal sample are marked in the figure. Because S also affects the ash value, the strength of element S is also used as an input variable to establish the model. The spectral data are integrated and normalized for subsequent model.
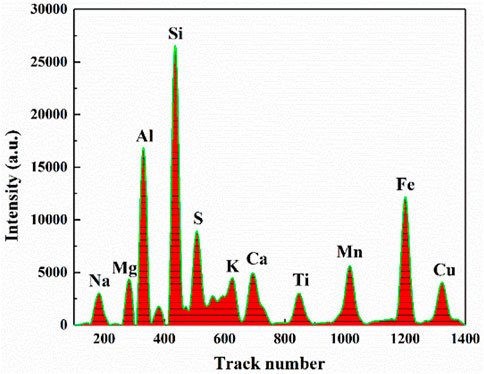
FIGURE 2. XRF spectrum of coal sample.
3.2 Model analysis
3.2.1 Calibration set modelling
The spectra of 45 samples in the calibration set are preprocessed. Here, the full spectrum area normalization is used to calculate the detection intensity of each element. The intensity value of each element of each coal sample is recorded as an independent variable and its ash value is recorded as a dependent variable, which is brought into the partial least squares model for ash value calculation. Each element strength of 45 coal samples after data processing is brought into PLS model for model and analysis with its standard ash, and then each element strength is brought into the model to predict its ash value. The predicted ash value of 45 coal samples is fitted with its standard value for analysis, and the prediction curve shown in Figure 3 is obtained. The results show that the fitting degree between the predicted ash content and the standard ash content of 45 coal samples under PLS model is 0.946 (R2 = 0.946), and the RMSE is 1.177%. It can be seen that the fitting curve has a good fitting degree, and the error of the prediction result is only 1.177%.
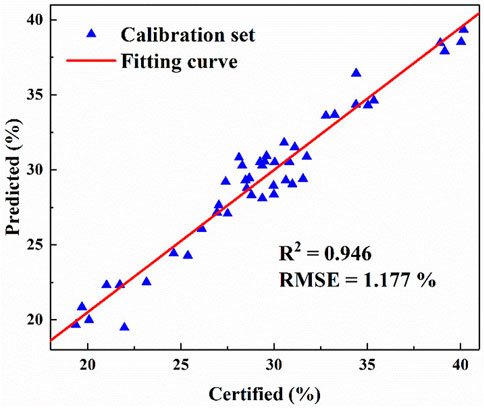
FIGURE 3. The fitting curve of calibration set.
In order to further verify the accuracy of the PLS model in predicting the ash content, we use the leave-one-out cross-validation. One coal sample was extracted from 45 coal samples as the predicted coal sample, which was not included in the calibration set, and the other 44 samples were used for modeling. In this way, we repeated 45 times to predict the 45 coal samples respectively. The fitting curve as shown in Figure 4 was obtained. It can be seen from the figure that the R2 reaches 0.938, and the RMSE can reach 1.273%. Therefore, XRF method has good prediction effect on ash value in coal.
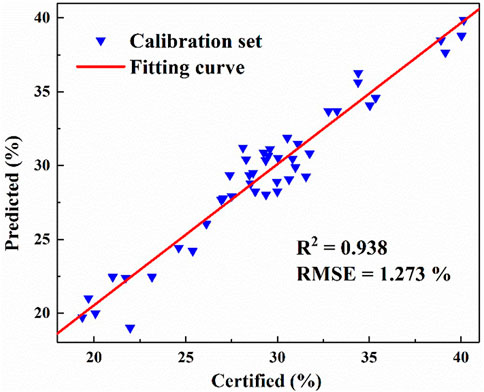
FIGURE 4. The fitting curve of leave-one-out cross-validation.
3.2.2 Prediction analysis
After modeling the ash contents of 45 coal samples in the calibration set by using PLS, the performance of the prediction model was verified with the 15 coal samples in the validation set. It is worth noting here that since the ash values of the 15 validation set coal samples are included in the ash value of the modeling samples, and none of the 15 samples participate in the modeling. Therefore, bringing 15 samples into the established ash PLS model can better reflect the ability of the model to predict unknown samples. Figure 5 shows the prediction results of the 15 validation coal samples under this model. It can be seen from the figure that the correlation coefficient R2 of linear fitting reaches 0.983, and the RMSE of prediction reaches 0.726%. Therefore, X-ray fluorescence spectrometry based on PLS model has high accuracy in the prediction of ash contents in coal.
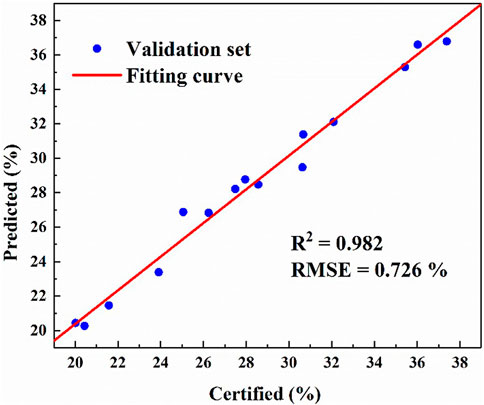
FIGURE 5. The fitting curve of validation set.
3.2.3 Stability analysis
In the process of industrial production, the detection stability of ash in coal is very important for XRF method, which can reflect the stability of continuous measurement of the same coal sample by XRF method. Here, four samples (R1, R2, R3 and R4) from three coal samples (C6, C7 and C22) in the calibration set and one coal sample (V12) in the validation set were randomly selected for stability test. The four samples are indicated in bold and underlined in Table 1. Each sample was measured for five times, and the above data processing was carried out respectively. The processed data was brought into the established PLS model to predict the ash value of coal sample. After each sample was measured for five times, five ash values could be obtained, and the corresponding RSD value of these ash values of each coal sample could be calculated. Figure 6 shows the ash content predicted by R1-R4 each time. The RSD value measured for each sample for five times is marked in the figure. The maximum is only 1.53% of R1 sample, the minimum is 0.64% of R3 sample, and the average of RSDs value of the four samples is only 0.97%. Therefore, XRF has high stability for coal ash detection.
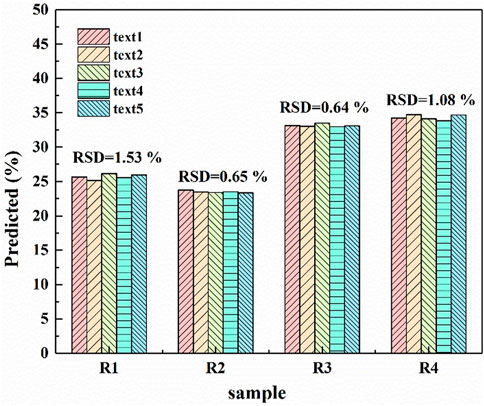
FIGURE 6. Repeatable measurement results of four coal samples.
In conclusion, under PLS model, XRF method not only has high accuracy, but also has high stability.
4 Conclusion
In this paper, XRF is used for quantitative analysis of ash content in coal. The measured spectrum is normalized by the full spectrum area. The relationship between the intensity of each elemental spectral line and the ash content in coal obtained after data processing is modeled by PLS algorithm. The R2 of PLS model established by 45 samples in calibration set reaches 0.946 and RMSE reaches 1.177%. Leave-one-out cross-validation is used to verify the accuracy of the prediction model accuracy. The results show that the linear correlation coefficientl R2 of the model built by PLS also reaches 0.938. The evaluation results of the prediction performance of the model using 15 coal samples from the validation set show that its R2 and RMSE are 0.982 and 0.726%, respectively. The results show that XRF method has good accuracy in the measurement of ash in coal under PLS model. The test results of four out of 60 samples randomly selected show that the RSD value of ash measured by XRF is less than 1%, indicating that XRF has ash measured by stability for coal ash prediction. In conclusion, XRF method based on PLS model has high accuracy and stability for coal ash measurement. It provides a strong theoretical basis for the on-line detection of coal ash. Due to the complexity of coal types, building coal samples into a model will also affect the final detection accuracy. Therefore, in subsequent research, we will further explore the influence of application environment on XRF measurement of coal quality and adopt classification modeling methods to improve the model, such as such as dust, vibration, principal component analysis (PCA), in order to obtain more accurate detection results and provide theoretical support for online equipment.
Data availability statement
The original contributions presented in the study are included in the article/supplementary material, further inquiries can be directed to the corresponding authors.
Author contributions
RG, LZ, and YZ conceived the idea. RG and LZ performed the experiments. YZ and HY conducted the data processing. RG, LZ, and YZ contributed to writing and editing the paper. All authors have approved the final version of the manuscript.
Funding
National Natural Science Foundation of China (NSFC) (61975103, 61875108, 61775125, 11434007).
Acknowledgments
RUI GUO thanks the National Science Foundation of China for help identifying collaborators for this work.
Conflict of interest
The authors declare that the research was conducted in the absence of any commercial or financial relationships that could be construed as a potential conflict of interest.
Publisher’s note
All claims expressed in this article are solely those of the authors and do not necessarily represent those of their affiliated organizations, or those of the publisher, the editors and the reviewers. Any product that may be evaluated in this article, or claim that may be made by its manufacturer, is not guaranteed or endorsed by the publisher.
References
1. Zhang B, Peng SP, Wang T, Song M. Strategic paths and countermeasures for constructing a “great power of coal resources”. Chin J Eng Sci (2019) 021:88. doi:10.15302/j-sscae-2019.01.013
2. Benson SA, Sondreal EA, Hurley JP. Status of coal ash behavior research. Fuel Process Tech (1995) 44:1–12. doi:10.1016/0378-3820(95)00020-8
3. Tsuchiai H, Ishizuka T, Nakamura H, Ueno T, Hattori H. Removal of sulfur dioxide from flue gas by the absorbent prepared from coal ash: Effects of nitrogen oxide and water vapor. Ind Eng Chem Res (1996) 35:851–5. doi:10.1021/ie950322p
4. Galbács G, Jedlinszki N, Cseh G, Galbács Z, Túri L. Accurate quantitative analysis of gold alloys using multi-pulse laser induced breakdown spectroscopy and a correlation-based calibration method. Spectrochimica Acta B: At Spectrosc (2008) 63:591–7. doi:10.1016/j.sab.2008.03.001
5. Lim CS, Abernethy DA. On-line coal analysis using fast neutron-induced gamma-rays. Appl Radiat Isot (2005) 63:697–704. doi:10.1016/j.apradiso.2005.05.021
6. Šeda J, Musílek L. Two-channel comparative method of energy spectrum evaluation in measurements using gamma-ray backscattering. Nucl Instr Methods (1974) 114:183–5. doi:10.1016/0029-554x(74)90360-7
7. Liu J, Zheng CG, Jia XH, Xu JY. Determination of 14 elements in coal ash by microwave digestion and inductively coupled plasma atomic emission spectrometry. Chin J Anal Chem (2003) 31:1360. doi:10.13140/2.1.3312.7047
8. Yao SC, Lu JD, Dong MR, Kai C, Li JY, Li J. Extracting coal ash content from laser-induced breakdown spectroscopy (LIBS) spectra by multivariate analysis. Appl Spectrosc (2011) 65:1197–201. doi:10.1366/10-06190
9. Zhu LP. Study of heavy medium suspension density fuzzy adaptive PID control. Xuzhou, China: Coal Technology (2012).
10. Chen D, Tang XD, Li FH, Yang D. Research on method to optimize accuracy of γ-ray backscatter ash analyzer. J Hunan Univ (2019) 46:2.
11. Agency EP. Method 6200: Field portable x-ray fluorescence spectrometry for the determination of elemental concentrations in soil and sediment. Available at: http://bases.bireme.br/cgi-bin/wxislind.exe/iah/online/?IsisScript=iah/iah.xisandsrc=googleandbase=REPIDISCAandlang=pandnextAction=lnkandexprSearch=50029andindexSearch=ID (1996).
12. Marguí E, Queralt I, Hidalgo M. Application of X-ray fluorescence spectrometry to determination and quantitation of metals in vegetal material. Trac Trends Anal Chem (2009) 28:362–72. doi:10.1016/j.trac.2008.11.011
13. Wang SF, Han P, Wang JH, Lu AX, Li F. Application of X-ray fluorescence spectrometry on the detection of heavy metals in soil. J Food Saf Qual (2016) 7 (11):7.
14. Beattie HJ, Brissey RM. Calibration method for X-ray fluorescence spectrometry. Anal Chem (1954) 26:980–3. doi:10.1021/ac60090a009
15. Reinhardt F., Osán J., Török S., Pap A. E., Beckhoff B.. Reference-free quantification of particle-like surface contaminations by grazing incidence X-ray fluorescence analysis. J Anal Atom Spectrom (2012) 27 2:248–255. doi:10.1039/c2ja10286
16. Song Y, Guo F, Gu SH. Determination of 12 elements in coal ash by x-ray fluorescence spectrometry. Spectrosc Spectral Anal (2008) 28:1430–4. doi:10.1080/10286600801908949
17. Wang BG, Kong DS. Determination of primary and secondary elements in coal gangue by XRF method. Handan, China: Energy Technology and Management (2010).
18. Bao SX. Direct determination of 23 elements in coal by XRF. Lanzhou, China: Rock and Mineral Analysis (1988).
19. Jia WB, Zhang Y, Chen GU, Hei DQ, Ling YS, Shan Q. A new distance correction method for sulfur analysis in coal using online XRF measurement system. Chin Sci Technol Sci (2014) 1:5. doi:10.1007/s11431-013-5435-7
20. Pearce BC, Hill J, Kerry I. Use of X-ray fluorescence spectrometry for the direct multi-element analysis of coal powders. Analyst (1990) 115:1397. doi:10.1039/an9901501397
21. Feng J, Wang Z, Li L, Li Z, Ni W. A nonlinearized multivariate dominant factor-based partial least squares (PLS) model for coal analysis by using laser-induced breakdown spectroscopy. Appl Spectrosc (2013) 67:291–300. doi:10.1366/11-06393
Keywords: x-fluorescence spectroscopy, laser-induced breakdown spectroscopy (LIBS), measurement of ash in coal, coal quality comprehensive index analysis, partial least squares model (PLS)
Citation: Guo R, Zhang L, Zheng Y and Yao H (2022) Accurate and stable measurement of ash in coal by X-ray fluorescence spectrometry based on partial least squares. Front. Phys. 10:1054796. doi: 10.3389/fphy.2022.1054796
Received: 27 September 2022; Accepted: 28 November 2022;
Published: 14 December 2022.
Edited by:
Ruifeng Kan, Hefei Institutes of Physical Science (CAS), ChinaReviewed by:
Shunchun Yao, South China University of Technology, ChinaChuanliang Li, Taiyuan University of Science and Technology, China
Copyright © 2022 Guo, Zhang, Zheng and Yao. This is an open-access article distributed under the terms of the Creative Commons Attribution License (CC BY). The use, distribution or reproduction in other forums is permitted, provided the original author(s) and the copyright owner(s) are credited and that the original publication in this journal is cited, in accordance with accepted academic practice. No use, distribution or reproduction is permitted which does not comply with these terms.
*Correspondence: Rui Guo, c3huZGdyQDE2My5jb20=; Yaohui Zheng, eWh6aGVuZ0BzeHUuZWR1LmNu