
94% of researchers rate our articles as excellent or good
Learn more about the work of our research integrity team to safeguard the quality of each article we publish.
Find out more
ORIGINAL RESEARCH article
Front. Phys., 09 December 2022
Sec. Biophysics
Volume 10 - 2022 | https://doi.org/10.3389/fphy.2022.1052106
This article is part of the Research TopicSpatial Ecology of Cells Living in Micro-Structured EnvironmentsView all 7 articles
 Esther Kimmle1Zahra Hajian Foroushani1Stephan Keppler2Judith Thoma1
 Kentaro Hayashi3
 Akihisa Yamamoto3
 Martin Bastmeyer2,3,4
 Motomu Tanaka1,3*
The self-renewal and lineage-specific differentiation of stem cells are regulated by interactions with their microenvironments, called stem cell niche. Stem cells receive both biochemical and biophysical cues from their niche, which leads to the activation of signaling pathways, resulting in the modulation of gene expressions to guide their fate. Most of previous studies are focused on the effect of substrate stiffness using hydrogels with different Young’s moduli, and information is lacking on the effect of the discreteness of cell–substrate contacts on stem cells. Using mouse pluripotent, embryonic stem cells (mESCs) as the model system for early development, we quantitatively investigated the migration, dynamic deformation, and adhesion of mESCs on sparse and dense gelatin nanofibers deposited on glass surfaces, with a continuous layer of gelatin coated on glass substrates as the control. After confirming the maintenance of pluripotency on all the surfaces throughout the experiments, the centroid trajectories were monitored using timelapse imaging. The mean square displacement analysis indicated that both the diffusion coefficient and exponent were largest on sparse nanofibers, while the diffusion coefficient of mESCs on dense nanofibers was comparable to that on the control. Moreover, power spectral analysis of the shape deformation in the Fourier mode indicated that mESCs predominantly underwent elliptic deformation (mode 2), with the largest energy dissipation on sparse nanofibers. These data suggest that mESCs can deform and move on sparse nanofibers owing to the discrete cell–surface contact points. Intriguingly, using a self-developed technique based on laser-induced shock waves, a distinctly larger critical pressure was required to detach cells from nanofibers than from continuous gelatin. This finding suggests that the continuous but weak cell-substrate contacts suppress the deformation-driven mESC migration. As one of the key biological functions of stem cells, the proliferation rate of mESCs on these surfaces was determined. Although the observed difference was not statistically significant, the highest proliferation rate was observed on nanofibers, suggesting that the discreteness of cell–surface contacts can be used to regulate not only spatio-temporal dynamics but also the biological function of pluripotent stem cells.
The self-renewal and differentiation of stem cells are tightly controlled by both biochemical and biophysical cues from the extracellular matrix (ECM) [1, 2]. For example, a mechanical stimulus, such as substrate stiffness detected by integrin, is transduced via various pathways, including Rho GTPase, FAK-Src, and YAP/Taz, resulting in the epigenetic and/or transcriptional modulation of gene expression [3]. Using fibrous fibrin-coated gels, Winer et al. reported that cells can sense the non-linear viscoelasticity of fiber-coated substrates, inducing long-range patterning [4]. To understand the interplay of the different cues affecting stem cell proliferation and differentiation, mouse embryonic stem cells (mESCs) have been used during the past 40 years as an excellent model for early development [5, 6]. Chowdhury et al. showed that a culture of mESCs on soft substrates down-regulates traction forces, which maintains mESCs in a non-differentiated state [7]. More recently, it has been shown that mESCs seeded on a feeder cell-derived ECM with a Young’s modulus of ∼1 kPa maintain pluripotency over a long time, while those on gelatin-coated plastic surface with a Young’s modulus of 1 GPa do not [8]. In contrast, strong traction forces promote definitive ectoderm differentiation of mESCs via TGF-β activation [9], demonstrating the significance of mechanical interactions between mESCs and ECM models.
One of the physical cues that has not been studied intensively is the discreteness of cell–ECM contacts. It is notable that many of the naturally occurring ECMs are not continuous, like sheets or gels, but discrete. One prominent example of discrete ECMs is fibrillar collagen type I, which is one of the most abundant ECM proteins. Several studies have demonstrated that discrete cell–ECM contacts affect pluripotent stem cells. For example, Okeyo et al. seeded human induced pluripotent stem cells (hiPSCs) on free-standing polymer meshes comprising cells of 5 µm in thickness and 100 µm in length, and they found that hiPSCs on the mesh showed a higher pluripotency over several days than those cultured on plastic dishes [10]. Although these two conditions are different not only in discreteness but also in stiffness, these data suggest that less discrete cell–substrate contacts promote the maintenance of pluripotency. Using a different type of pluripotent stem cells (human iPSCs), Yu et al. compared the adhesion of pluripotent stem cells on continuous Matrigel and gelatin nanofibers (GNFs) as well as the critical pressure required to detach cells from the cell–ECM adhesion model. Intriguingly, they reported that the adhesion of human iPSCs on continuous Matrigel was stronger than that on discrete nanofibers [11]. On nanofiber-coated substrates, hiPSCs are categorized into two sub-groups according to the difference in cell adhesion strength. Cells that adhere weakly on nanofiber-coated substrates show high pluripotency. However, cells seeded on a thin layer of nanofibers (almost a monolayer) are affected by the underlying glass substrate because the strain fields exerted by the traction force may not be non-zero on the glass surface [12]. In contrast, cells seeded on Matrigel are partially immersed in the gel. Matrigel contains other ECM proteins and hence differ from pure collagen or gelatin, but these data suggested that the discreteness and strength of adhesion affect cell behaviors.
In this study, we investigated the effect of the discreteness of cell–surface contacts on the migration, active deformation, and adhesion of mESCs by functionalizing the glass surface with 1) a continuous layer of gelatin, 2) GNFs with a high surface density, and 2) GNFs with a low surface density. We selected mESCs as the model to focus on single cell-level behaviors because single hiPSCs cannot survive without an additional ROCK inhibitor, which may affect the cell dynamics via the myosin light chain [7, 13]. It is notable that cells detect the underlying glass substrates in all three cases because all three gelatin layers are thinner than 1 µm [12]. This eliminates the potential thickness-dependent effect, and thus the analysis can be focused on assessing the sensitivity of mESCs to the continuous and discontinuous gelatin. Finally, we evaluated the effect of surface functionalization on the biological function of mESCs by comparing the rate of self-renewal using the classical bromodeoxyuridine (BrdU) assay.
Gelatin (11 wt%, type A, from porcine skin; Merck) solutions were prepared by dissolving gelatin in a mixture of acetic acid, ethyl acetate, and distilled water at a ratio of 21:14:10 overnight prior to electrospinning [14]. Dense and sparse GNFs were prepared by electrospinning for 40 and 10 s, respectively. The gelatin solution was pumped through a stainless-steel 22 G blunt needle (12 μL/min), and the bias voltage of 13 kV versus the electrically grounded collector plate was applied over 10 cm. Throughout the experiments, the relative humidity was regulated at less than 25% by spinning the fibers in a sealed chamber filled with nitrogen gas [15]. After electrospinning, the fibers were vacuum dried overnight to evaporate the remaining solvent. On the next day, the fibers were crosslinked by soaking in 200 mM 1-ethyl-3-(3-dimethylaminopropyl)carbodiimide hydrochloride (EDC, Merck) and 200 mM N-hydroxysuccinimide (NHS, Merck) in ethanol for 4 h. Before use, GNFs were rinsed with 70% ethanol three times and dried in vacuum overnight. To use under cell culture conditions, the fibers were sterilized under ultraviolet (UV) light for 60 min without damaging GNFs, then washed three times with 70% ethanol, and finally rinsed two times with phosphate-buffered saline (PBS).
AFM measurements were performed using a NanoWizard 3 AFM (JPK, Berlin, Germany). Silicon nitride quadratic pyramidal tips (MLCT, Bruker, United_States) and borosilicate spherical tips (CP-qp-CONT-BSG A, NanoAndMore, Wetzlar, Germany) had nominal vertical spring constants of 0.03 N/m and 0.1 N/m, respectively. Tips were used in the contact mode in the medium at 37°C. We used the thermal noise method to determine the spring constant of the cantilevers. Crosslinked fibers on glass substrates were subjected to measurements in the medium. The surface was scanned over a region 10 × 10 μm2 at a line rate of 0.1 Hz. The mechanical properties of the nanofibers were characterized by AFM nanoindentation over regions of 30 μm2 × 30 μm2. The measured force–distance curves were analyzed using the Hertz model for spherical indenters [16]. The effective elastic moduli presented were obtained from N > 100 force–indentation curves.
The mESC line OCT4-eGFP, expressing eGFP under the OCT4-promoter, was kindly provided by Prof. Rolf Kemler (MPI, Freiburg). These experiments were performed in accordance with European (Council Directive 86/609/EEC) and German (Tierschutzgesetz) guidelines for the welfare of experimental animals.
mESCs were cultivated at 37°C, 5% CO2, and 95% humidity. Cells were maintained in gelatin-coated flasks (from porcine skin, 0.1%, Merck, G1890 in PBS). The medium contained Dulbecco’s modified Eagle’s medium (DMEM) (Merck, #D5796), 15% Pansera ES (PAN-Biotech, #P30-2602), 1% non-essential amino acids (Merck, #M7145), 0.1 mM β-mercaptoethanol (Merck, #M3148), and 1% penicillin/streptomycin (Gibco, #15140122). Additionally, Leukemia inhibitory factor (LIF, Merck, #ESG1107) was applied, as well as two inhibitors, MEK inhibitor PD0325901 (Merck, #PZ0162) and Gsk-3 inhibitor Chir99021 (Merck, # SML1046). The cells were harvested using 0.05% Trypsin (Gibco, #25300054) and passaged every 2 or 3 days [17–19].
For experiments, 2 × 10⁵ cells (timelapse) or 1 × 10⁵ cells (laser, counting) were seeded in a 35-mm Petri dish with a 25-mm glass plate covered with the respective substrate (dense GNFs, sparse GNFs, or 0.1% gelatin coating). The nanofibers were directly electrospun onto the surface of glass substrates. After chemical crosslinking, we found no sign of fiber detachment throughout the experiments, as reported previously [11, 14]. Prior to the experiments, we confirmed that the non-specific adhesion of mESCs to the bare glass surface is small compared to the specific adhesion the gelatin-coated glass surface (Supplementary Figure S1). Therefore, we did not perform any additional treatment to prevent the non-specific adhesion of mESCs on glass.
Cells were stained after 2 days of timelapse imaging. Cells were fixed with 4 wt% buffered paraformaldehyde (Riedel de Haen) in PBS (Merck) for 20 min, then permeabilized with 0.1 wt% Tween (Merck) in PBS (PBST), and finally blocked with 1 wt% bovine serum albumin (BSA) (Carl Roth) in PBST. Cells were rinsed between each step, and after 20 min, cells and the first antibody (Nanog AB (Abcam, ab80892) or Sox2 AB (Abcam, ab97959)) were incubated overnight. On the next day, cells were rinsed and then mixed with the secondary antibody coupled to Alexa Fluor 594 (Abcam, ab150080). Cells were left in the dark for 1 h and then mixed with 4’,6-diamidino-2-phenylindole (DAPI). After 30 min, cells were washed and stored in PBS at 4°C in the dark until further use. Images were taken using a Nikon C2 Plus confocal microscope equipped with a ×20 objective (0.75 NA) (Nikon Imaging Center, Heidelberg University). Images were assessed using Fiji software. The immunofluorescence microscopy experiments were performed after 48 h in order to ensure that the cells sustain the pluripotency.
To quantify the proliferation, 10 µM 5-bromo-2′-deoxyuridine (BrdU) (Abcam, ab142567) was added to cells on the respective substrate 2 h after seeding. After incubation overnight, cells were fixed, DNA was hydrolyzed with 2 M HCl following the Abcam protocol [20], and cells were stained with Alexa Fluor 594 linked to anti-BrdU antibody (Abcam, ab220076), with washing between each step. Images were taken using a Nikon C2 Plus confocal microscope equipped with a ×20 objective (0.75 NA) (Nikon Imaging Center, Heidelberg University). Images were assessed using Fiji software.
Cells were also counted to assess the proliferation of mESCs. Cells were seeded on each substrate, then harvested after a certain time using trypsin, and finally counted with a Neubauer counting chamber. The cell number was calculated using the doubling time formula:
The migration of mESCs on nanofiber-coated substrates was monitored by live-cell imaging on a Zeiss Axiovert 200 microscope (Oberkochen, Germany) equipped with a ×40 objective lens (0.6 NA). Prior to the timelapse imaging, the cells were allowed to adhere to the surface for 1 h under the culture condition, and the sample was transferred to an ibidi tabletop incubator (Martinsried, Germany) at 5% CO2, 80% humidity, and 37°C. After equilibration for 1 h, the brightfield images were recorded over 2.5 h at a time interval of 5 min. The drift of the images was corrected with the Fiji plugin “Correct 3D Drift” [21]. The rim of each cell was extracted by binarization with Fiji software and analyzed for migration trajectories and active deformation. All data sets were analyzed using self-written routines in Igor Pro 6.30.
To analyze the dynamic deformation of cells, we defined the peripheral edge of the cell in each single frame and created plots in polar coordinates, with the center of mass as the origin and r as the radial distance to the edge of the cell. As the first step to analyze dynamic cell deformation, we recorded the radial distance
The adhesion strength of mECS was determined using a self-developed instrument [31]. A picosecond laser pulse (λ = 1064 nm, τL ≈ 30 ps) from a Nd:YAG laser (EKSLPLA, Vilnius, Lithuania) was focused through a microscope objective (×10) into a heating chamber mounted on an inverted microscope (Eclipse TE2000-U, Nikon Europe). Multiphoton absorption of the infrared (IR) laser leads to the generation and collapse of a cavitation bubble, followed by a shock wave traveling beyond the sound velocity [32]. Because the pressure exerted on cells located at a distance of approximately 1 mm is p > 10 MPa, the critical pressure required for cell detachment p* has been used as a non-invasive, quantitative measure to compare the adhesion strength of stable cell lines [33, 34], malaria-infected human erythrocytes [35, 36], and human hematopoietic stem cells [26]. This approach enables measurement of approximately 500–2000 cells/h because the pressure exerted on cells can be calibrated using the pulse energy and distance from the focus [31]. Cells were seeded 4 h before starting the measurement to ensure complete adhesion. During the measurement, cells were kept in a 37°C heating chamber. First, the laser power was reduced to 10% to exclude dead or non-adherent cells. Then, the laser power was set to 100% for the actual experiment. Before and after exposure to pressure waves (shock waves), we took brightfield microscopy images and counted cells that remained adherent and detached after exposure to the pressure wave using Fiji software. Cells within 0.5 mm of the laser impact point were neglected because of the size of the cavitation bubble (diameter of 1 mm) [37]. Plots of the fraction of adherent cells χ versus pressure p were fitted with an error function [36],
Figures 1A,B show the topographic profiles of glass substrates coated with sparse and dense GNFs. In this study, the orientation of nanofibers was random, because we did not control the orientation of nanofibers during electrospining. First, the fibers were crosslinked with 200 mM EDC/NHS, and contact mode AFM was performed in the buffer using a pyramidal tip. After wet chemical crosslinking in ethanol, washing with 70% ethanol and drying, the fibers remained stable over time, indicating that the glass substrates were coated with fibers of different surface densities. The thickness and width of the fibers in the aqueous medium were 400–900 nm (thickness) and 300–800 nm (width), suggesting that electrospinning and successive crosslinking reproducibly resulted in uniform fibers that were stable in the aqueous buffer. Note that the width of GNFs, W, was determined from the full width at half maximum (FWHM) of the AFM image by taking the radius of the AFM cantilever, r = 20 nm, into account [38, 39],
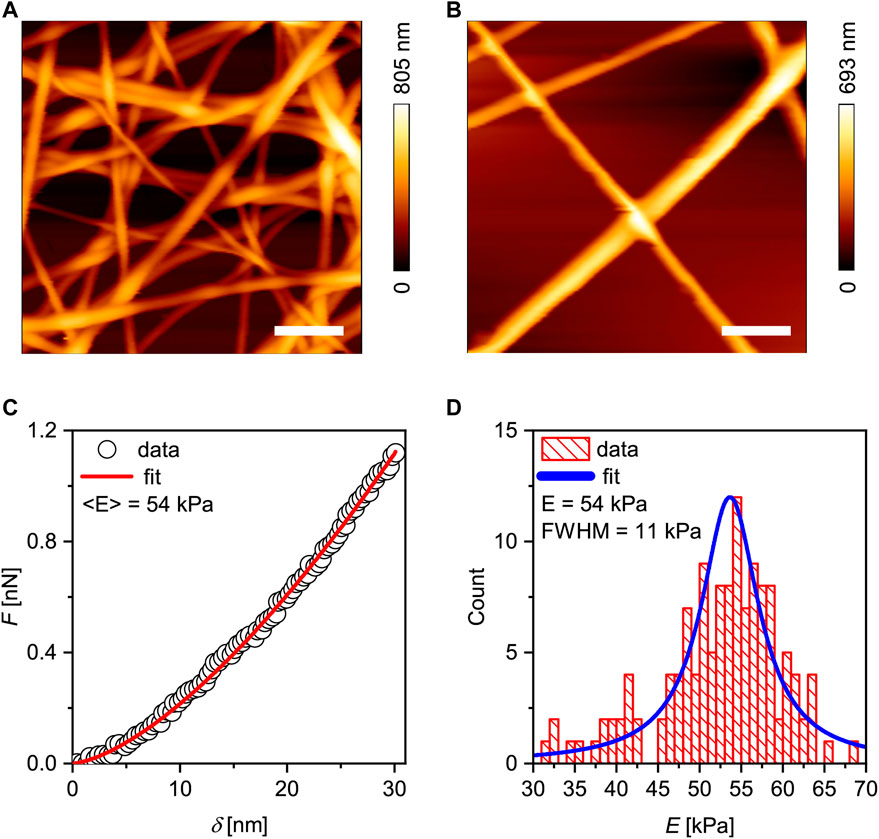
FIGURE 1. Characterization of gelatin nanofibers (GNFs). Height profiles of (A) dense GNFs (surface coverage ≈ 46%) and (B) sparse GNFs (surface coverage ≈10%). Scale bars: 2 µm. (C) A representative force curve and the fit (red line) using the Hertz model for a spherical indentor. (D) Distribution of the measured Young’s moduli fitted with a Lorentzian function (blue line), yielding <E> = 54 kPa.
For comparison, the scanning electron micrographs of GNFs before and after the chemical crosslinking are presented in Supplementary Figure S3, confirming that the fibers remained intact after the crosslinking in ethanol solution, the sterilization with UV light, and the rinsing with 70% ethanol. The Young’s modulus of single fibers was measured using a different cantilever modified with a SiO2 particles of 10 µm in diameter (Figure 1C). Prior to the indentation, we scanned to obtain the topographic profile near one single fiber and ensured that the probe indented the middle point. In this study, we used a particle-attached cantilever, because the indentation of nanofibers with a sharp, pyramidal tip resulted in an overestimation of Young’s modulus with a broader distribution (Supplementary Figure S4), as reported previously [38] Although the exact origin of the broad distribution was not conclusively identified, each fiber likely contained both densely and loosely crosslinked regions. A representative force curve (symbols) is shown in Figure 1C. The force curves were fitted with the Hertz model of the sphere–plane contact (solid line, Figure 1C) [16], yielding the Young’s modulus E,
F is the force, R the radius of the indenting sphere, ν the Poisson’s ratio (0.5), and δ the indentation depth. As presented in Figure 1D, the distribution of Young’s modulus was well fitted to the Gaussian distribution function, with the median at <E> ≈ 52 kPa, which is comparable to that of photochemically crosslinked gelatin nanofibers [40]. It should be noted that the used of Hertz model for sphere-plane contact for the indentation of GNFs with the diameter of several 100 nm with a 10 µm-large SiO2 particle is a practical compromise to avoid large deviations in force curves and Young’s moduli. Although the indentation of planar gelatin “films” with the same degree of crosslinking would be helpful to validate the model, it was experimentally not possible to fabricate 100 nm-thick gelatin films with the same crosslinking degree as GNFs because the crosslinking reaction in liquid phase is diffusion limitted.
Dynamic deformation of mESCs on dense and sparse GNFs was monitored using timelapse imaging over 2.5 h (Supporting Information Movie Supplementary Figure S2). In this study, we first confirmed the uniform and continuous coating of the surface using fluorescently labeled gelatin and the AFM height profile (Supplementary Figure S5), then performed timelapse imaging of mESCs expressing reporter Oct4-eGFP with simultaneous bright field and fluorescence imaging. This ensured that we observed the dynamic behavior of pluripotent mESCs. Figures 2A,B show the overlaid phase contrast and fluorescence images of Oct4-eGFP mESCs captured 60 min after starting timelapse imaging. For comparison, the corresponding image taken of Oct4-eGFP mESCs on a gelatin-coated glass substrate is presented in Figure 2C. All cells showed positive eGFP signals on all three substrates, confirming the maintenance of pluripotency. To exclude the potential risk of phototoxicity affecting the cell behavior, we performed the same experiments without fluorescence illumination using a seeded gelatin-coated glass substrate. As shown in Supplementary Figure S6, the data indicated that simultaneous phase contrast and fluorescence imaging did not affect the cell behavior.
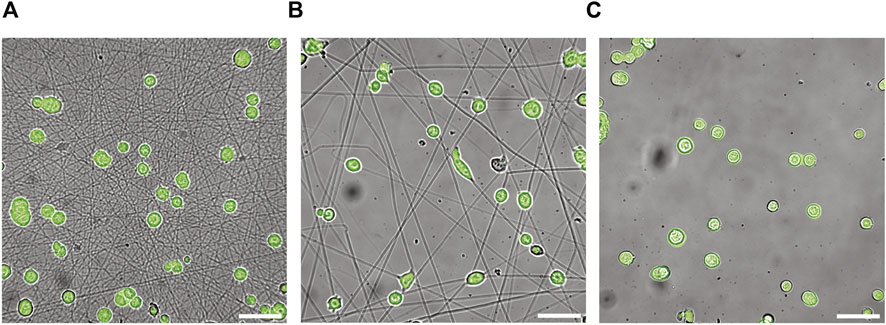
FIGURE 2. Snapshot images of mouse embryonic stem cells (mESCs) on discrete and continous surfaces. Bright field microscopy images of Oct4-GFP mESCs on glass substrates coated with (A) dense and (B) sparse GNFs. For comparison the image taken on glass coated with continuous gelatin is shown in panel (C). The images were taken at t = 60 min. Scale bars: 50 µm.
To monitor maintenance of pluripotency over a longer time period, we performed immunofluorescence labeling of the fixed mESCs with antibodies coupled to pluripotency markers after 48 h. It should be noted that the timelapse image analysis was performed during the first 2.5 h, when the cells mostly remained as single cells. The upper panels in Figure 3 show the fluorescence images of mESCs labeled with DAPI (cell nucleus, blue), Oct4-eGFP reporter (green), and anti-Sox2 (red) on sparse GNFs, while the lower panels include another set of images with anti-Nanog (magenta) labeling. Two sets of staining were performed for each seeded substrate owing to the limited number of fluorescence channels. Corresponding images of a seeded gelatin-coated glass substrate and a seeded dense GNF-coated glass substrate are presented in Supplementary Figure S7. All mESCs showed positive signals from the three pluripotency markers, Oct4, Sox2, and Nanog, confirming that all mESCs maintained their pluripotency over 48 h. This seems reasonable considering previous observations of the maintenance of pluripotency on gelatin-coated substrates over 15 passages [41], on fibronectin-coated scaffolds for 24 h [17], and on polyacrylamide hydrogel substrates coated with collagen of varying elasticity for 5 days [7]. Moreover, we examined if the size of colonies is affected by the surface functionalization. The size of each colony on three surfaces showed no statistically significant difference (p ≥ 0.05); 4500 ± 6300 μm2 on dense GNFs (n = 40), 5300 ± 5800 μm2 on sparse GNFs(n = 46), and 5800 ± 9300 μm2 on continuous gelatin (n = 36). It should be noted that the size of each colony depends on the local surface density of cells caused by the seeding, which makes the differences in each group fairly large.

FIGURE 3. Maintenance of pluripotency of mESCs. Fluorescence images of Oct4-GFP mESCs at t = 48 h on sparse GNFs, blue: DAPI, green: Oct4-GFP reporter, red: anti-Sox2, magenta: anti-Nanog. Scale bars: 50 µm. Two sets of images were taken in order to avoid the interference between different labels. The corresponding images taken on the other surfaces are shown in Supplementary Figure S7.
We examined whether discrete functionalization with nanofibers affects the migration behavior of mESCs by comparing the cell migration trajectories on nanofiber-coated substrates with those on substrates continuously coated with gelatin. The flow of analysis is shown in Figure 4A. For each cell, we defined the contour, determined the center of mass, and tracked the centroid trajectory. Figures 4B–D show the migration trajectories of mESCs tracked over the first 150 min after equilibration, observed on sparse nanofibers, dense nanofibers, and continuous gelatin coating, respectively. Note that the migration is in quasi-two-dimensional space, because the vertical displacement is negligible compared to the cell size. The position of each cell at t = 0 min was set as the origin, and n = 59 (dense GNF), 46 (sparse GNF), or 45 (gelatin-coated glass) trajectories marked by different colors were overlaid. First, we verified that the average velocity of cell migration on the control surface (coated continuously with gelatin), v ≈ 0.2 μm/min, agreed with a previous report [7]. Next, we calculated the mean squared displacement (MSD) to analyze each migration trajectory [42, 43]. As shown in Supplementary Figures S8A–C, the MSD plotted versus time increment τ in the double logarithmic coordinates yielded the power law exponent α,
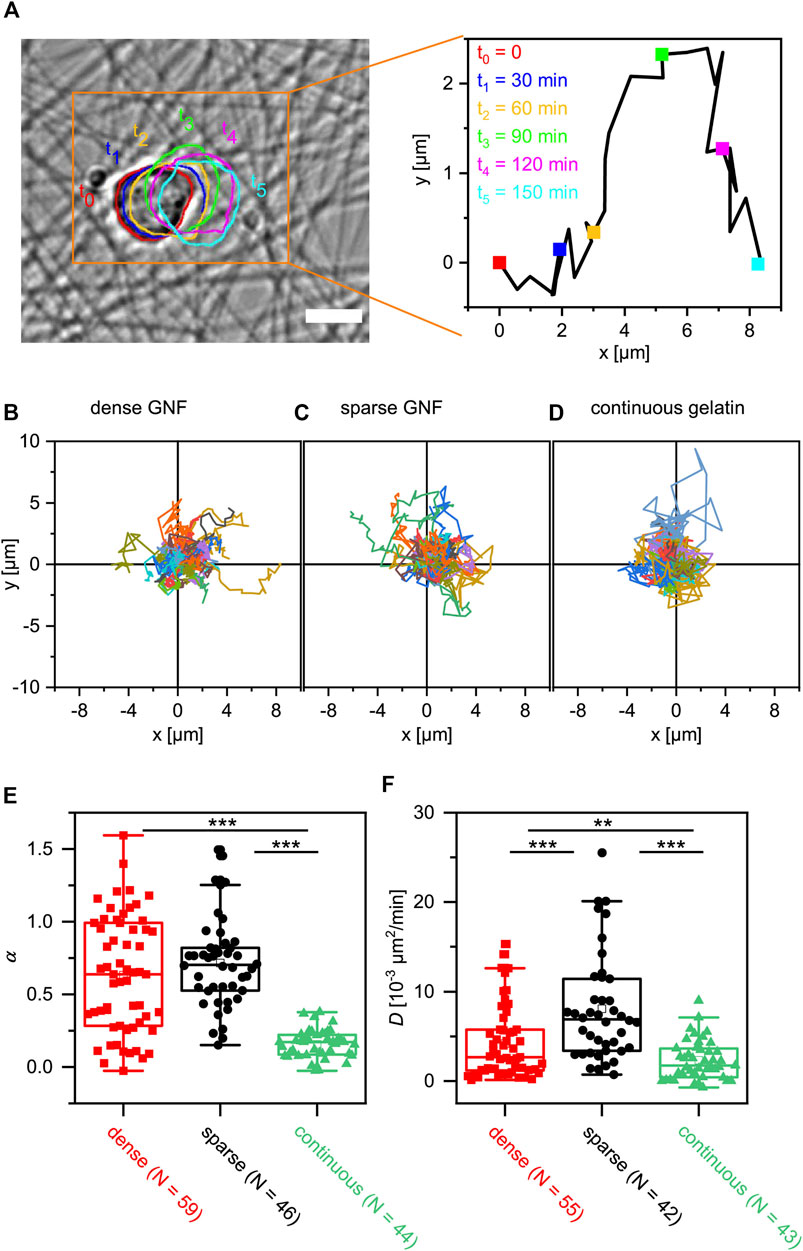
FIGURE 4. Influence of cell-surface contacts on migration of mESCs. (A) Migration of an Oct4-GFP mESC recorded on dense GNFs. The centroid trajectory extracted from the image is shown in a larger magnification. Scale bar: 10 µm. (B–D) Migration trajectories of Oct4-GFP mESCs recorded on dense and sparse GNFs as well as on continuous gelatin. (E) Power law exponent α and (F) diffusion coefficient D calculated from the MSD analyses. Outliers were removed using Grubbs’s test, while the statistical significance was assessed by t-test (** p < 0.01, *** p < 0.001).
Cell migration can be categorized into two groups: mesenchymal migration and amoeboid movement [25]. The former, mesenchymal migration, is characterized by the formation of actin-containing protrusions (e.g., lamellipodia) near the spreading front, followed by retraction of the trailing end. In contrast, our timelapse movie suggests that mESCs undergo an amoeboid-like migration powered by the extension of protrusions (pseudopods) at the front, which is similar to human hematopoietic stem cells [26]. This type of protrusion can also be found in other non-differentiated cells, such as invadopodia in invasive cancer cells.
From the physical viewpoint, deformation of cells is an active, non-equilibrium process, that is, accompanied by energy consumption. In this study, we calculated the power spectra to quantitatively assess the significance of energy consumption by cell deformation by expanding the deformation
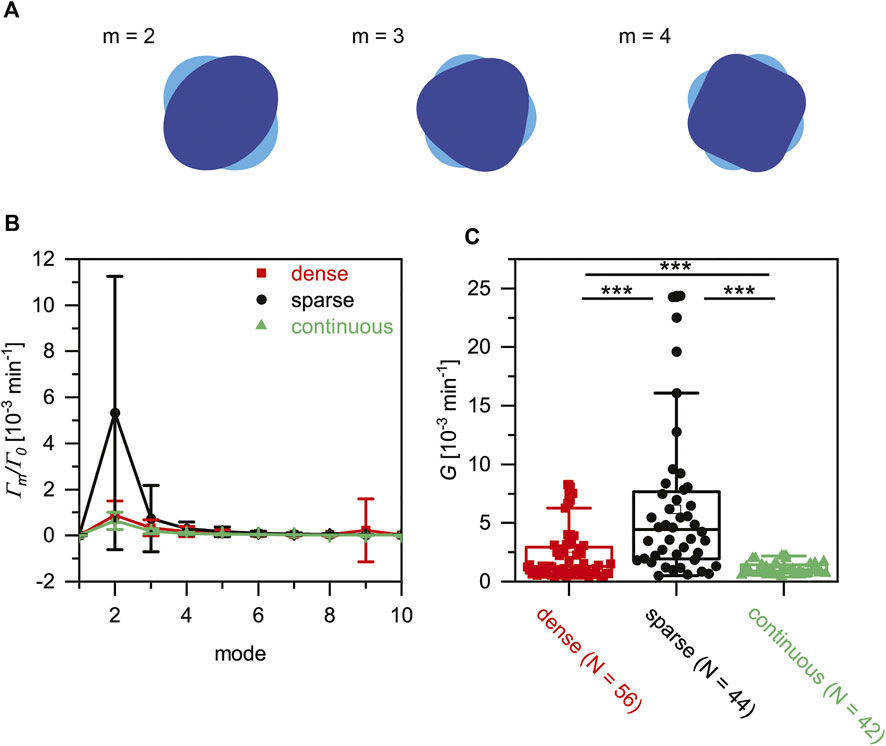
FIGURE 5. Discreteness of cell-surface contacts affects active cell deformation. (A) Schematic illustration of deformation in Fourier modes, m = 2, 3 and 4. (B) Power spectra of active deformation calculated for Oct4-GFP mESCs on three surfaces. (C) Total power
We investigated whether the distinct difference observed in the migration and active deformation of cells correlates with the strength of cell–substrate interactions, because it is well established that the strength of cell adhesion directs the arrangement of focal adhesion and hence cell contraction driven by actomyosin complexes [46]. For this purpose, we measured the mechanical strength of cell adhesion with a self-developed, high-throughput assay using pressure waves induced by picosecond laser pulses (Figure 6A) [26, 31, 35, 36]. As shown in Figure 6B, brightfield images were recorded before and after the application of the laser pulse to identify the cells detached from the substrate (indicated in red). Because the pressure exerted on cells located at distance d can be calculated by the calibration measurement (Supplementary Figure S10), the fraction of adherent cells on the surface
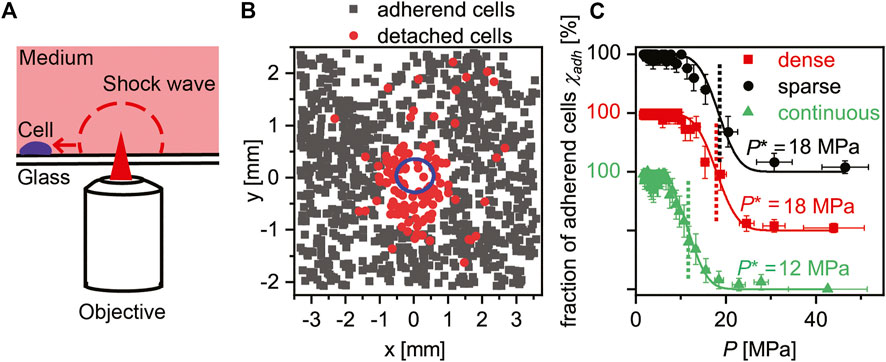
FIGURE 6. Quantitative assessment of cell adhesion strength. (A) Schematic illustration of the self-developed setup. Adhered cells are exposed to shock waves induced by the ps laser pulse in a non-invasive manner. The pressure exerted on each cell p can be calibrated using pulse energy and the distance from the focal point (Supplementary Materials). (B) Comparison of images before and after the exposure to shock waves enables the discrimination of adhered and detached cells on sparse GNFs. Note that only cells outside the cavitation bubble (blue) were counted. (C) Fractions of adhered cells χ plotted versus pressure exerted on cells p were fitted with error functions, yielding the critical pressure required for cell detachment p*.
Finally, we examined if surface functionalization affects biological functions. As presented in Figure 3, mESCs sustained their pluripotency over 48 h on all three surfaces, indicating that surface functionalization did not affect cell differentiation in our experimental time window. In contrast, our timelapse data suggest that surface functionalization may affect the proliferation of mESCs. Here, BrdU was added to the mESCs 2 h after seeding, and the cells were fixed and stained with BrdU antibody after overnight incubation. Figure 7A shows the immunofluorescence image of mESCs stained with anti-BrdU conjugated with Alexa Fluor 594. The fractions of BrdU positive cells extracted from two experiments (N > 100 cells per condition) were plotted, as shown in Figure 7B. On the surface continuously coated with gelatin, the fraction of BrdU positive cells was 89% ± 10%. This agrees with the cell division rate obtained on glass substrates continuously coated with fibronectin 24 h after seeding, 87% [17]. In contrast, the fractions of BrdU positive cells on GNFs were distinctly larger than that on continuous gelatin coating: 95% ± 4% (sparse) and 96% ± 3% (dense).
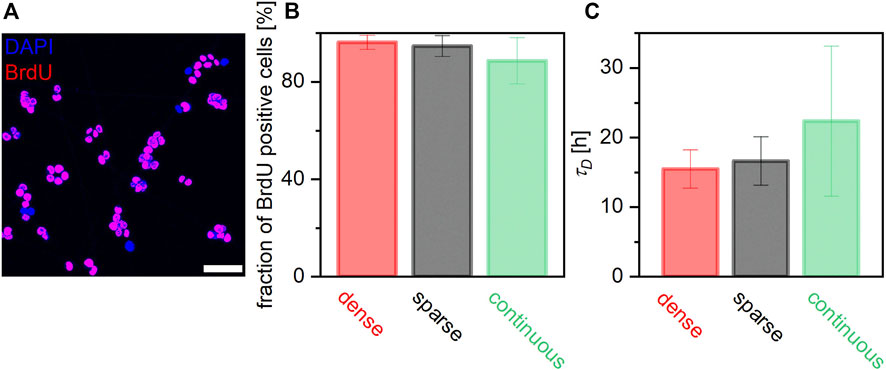
FIGURE 7. Influence of cell-surface contacts on proliferation of mECSs. (A) Overlay of fluorescence images of cells with DAPI (blue) and anti-BrdU (red) filters. BrdU-positive cells are identified as magenta objects. (B) Fraction of BrdU positive cells calculated from the timelapse imaging and (C) doubling times are compared. Although the difference was not significant, cells on GNFs seem to proliferate faster than those on glass continuously coated with gelatin.
To verify this finding, we estimated the doubling time of mESCs
In this study, we aim to shed light on how the discreteness of cell-surface contacts affects the migration driven by active deformation of mouse embryonic stem cells (mESCs). The comparison of spatio-temporal dynamics of mESCs by live, timelapse imaging of cells demonstrated that the active deformation of mESCs was significantly suppressed on glass substrates functionalized continuously with gelatin compared to those observed on the substrates functionalized with discrete gelatin nanofibers (GNFs). Intriguingly, the quantitative cell adhesion strength determined by the self-developed assay utilizing pressure waves demonstrated that the suppression of active deformation and migration does not correlates with continuousity of gelatin on substrates but not with the strength of cell adhesion, as suggested by previous studies [10, 11]. The extension of this strategy in 3D systems, such as nanofiber stacks versus continuous gel-based matrix would help us understand how the cell behavior and stem cell fate are affected by the discreteness of cell-matrix contacts.
The original contributions presented in the study are included in the article/Supplementary Material, further inquiries can be directed to the corresponding author.
MT and MB designed and directed the research. EK and SK established cell culture, EK, ZHF, MK, and KH performed the measurements, EK, JT, and AY analyzed the data, and MT and EK wrote the paper. All authors were involved in discussions throughout the manuscript preparation.
This study was supported by Germany’s Excellence Strategy—2082/1—390761711 (to MB and MT), the German Science Foundation (CRC873 B07 to MT), and the JSPS (JP19H05719 and JP20H00661 to MT, and JP22K18170 to KH). EK, ZHF, and SK thank the Graduate School “Functional Materials” for support. MB and MT thank the German–Japanese University Alliance (HeKKSaGOn Alliance), and MT thanks Nakatani Foundation for support.
EK thanks M. Khin and R. Rappolt for experimental assistance, K. Richler for helpful comments, and C. Ackermann and U. Engel (Nikon Imaging Center Heidelberg) for insightful comments on cell imaging. We thank Edanz (https://jp.edanz.com/ac) for editing a draft of this manuscript.
The authors declare that the research was conducted in the absence of any commercial or financial relationships that could be construed as a potential conflict of interest.
All claims expressed in this article are solely those of the authors and do not necessarily represent those of their affiliated organizations, or those of the publisher, the editors and the reviewers. Any product that may be evaluated in this article, or claim that may be made by its manufacturer, is not guaranteed or endorsed by the publisher.
The Supplementary Material for this article can be found online at: https://www.frontiersin.org/articles/10.3389/fphy.2022.1052106/full#supplementary-material
1. De Belly H, Paluch EK, Chalut KJ. Interplay between mechanics and signalling in regulating cell fate. Nat Rev Mol Cel Biol (2022) 23(7):465–80. doi:10.1038/s41580-022-00472-z
2. Huebsch N, Arany PR, Mao AS, Shvartsman D, Ali OA, Bencherif SA, et al. Harnessing traction-mediated manipulation of the cell/matrix interface to control stem-cell fate. Nat Mater (2010) 9(6):518–26. doi:10.1038/nmat2732
3. Kechagia JZ, Ivaska J, Roca-Cusachs P. Integrins as biomechanical sensors of the microenvironment. Nat Rev Mol Cel Biol (2019) 20(8):457–73. doi:10.1038/s41580-019-0134-2
4. Winer JP, Oake S, Janmey PA. Non-linear elasticity of extracellular matrices enables contractile cells to communicate local position and orientation. PLOS ONE (2009) 4(7):e6382. doi:10.1371/journal.pone.0006382
5. Evans MJ, Kaufman MH. Establishment in culture of pluripotential cells from mouse embryos. Nature (1981) 292(5819):154–6. doi:10.1038/292154a0
6. Martin GR. Isolation of a pluripotent cell line from early mouse embryos cultured in medium conditioned by teratocarcinoma stem cells. Proc Natl Acad Sci U S A (1981) 78(12):7634–8. doi:10.1073/pnas.78.12.7634
7. Chowdhury F, Li Y, Poh Y-C, Yokohama-Tamaki T, Wang N, Tanaka TS. Soft substrates promote homogeneous self-renewal of embryonic stem cells via downregulating cell-matrix tractions. PLOS ONE (2010) 5(12):e15655. doi:10.1371/journal.pone.0015655
8. Sthanam LK, Barai A, Rastogi A, Mistari VK, Maria A, Kauthale R, et al. Biophysical regulation of mouse embryonic stem cell fate and genomic integrity by feeder derived matrices. Biomaterials (2017) 119:9–22. doi:10.1016/j.biomaterials.2016.12.006
9. Taylor-Weiner H, Ravi N, Engler AJ. Traction forces mediated by integrin signaling are necessary for definitive endoderm specification. J Cel Sci (2015) 128(10):1961–8. doi:10.1242/jcs.166157
10. Okeyo KO, Tanabe M, Kurosawa O, Oana H, Washizu M. Self-organization of human iPS cells into trophectoderm mimicking cysts induced by adhesion restriction using microstructured mesh scaffolds. Dev Growth Differ (2018) 60(3):183–94. doi:10.1111/dgd.12430
11. Yu L, Li J, Hong J, Takashima Y, Fujimoto N, Nakajima M, et al. Low cell-matrix adhesion reveals two subtypes of human pluripotent stem cells. Stem Cel Rep (2018) 11:142–56. doi:10.1016/j.stemcr.2018.06.003
12. Domke J, Radmacher M. Measuring the elastic properties of thin polymer films with the atomic force microscope. Langmuir (1998) 14(12):3320–5. doi:10.1021/la9713006
13. Watanabe K, Ueno M, Kamiya D, Nishiyama A, Matsumura M, Wataya T, et al. A ROCK inhibitor permits survival of dissociated human embryonic stem cells. Nat Biotechnol (2007) 25(6):681–6. doi:10.1038/nbt1310
14. Liu L, Yoshioka M, Nakajima M, Ogasawara A, Liu J, Hasegawa K, et al. Nanofibrous gelatin substrates for long-term expansion of human pluripotent stem cells. Biomaterials (2014) 35:6259–67. doi:10.1016/j.biomaterials.2014.04.024
15. Bentele T, Amadei F, Kimmle E, Veschgini M, Linke P, Sontag-González M, et al. New class of crosslinker-free nanofiber biomaterials from Hydra nematocyst proteins. Sci Rep (2019) 9:19116–9. doi:10.1038/s41598-019-55655-0
17. Bertels S, Jaggy M, Richter B, Keppler S, Weber K, Genthner E, et al. Geometrically defined environments direct cell division rate and subcellular YAP localization in single mouse embryonic stem cells. Sci Rep (2021) 11:9269. doi:10.1038/s41598-021-88336-y
18. Silva J, Barrandon O, Nichols J, Kawaguchi J, Theunissen TW, Smith A. Promotion of reprogramming to ground state pluripotency by signal inhibition. Plos Biol (2008) 6:e253. doi:10.1371/journal.pbio.0060253
19. Sim Y-J, Kim M-S, Nayfeh A, Yun Y-J, Kim S-J, Park K-T, et al. 2i maintains a naive ground state in ESCs through two distinct epigenetic mechanisms. Stem Cel Rep (2017) 8:1312–28. doi:10.1016/j.stemcr.2017.04.001
20.abcam. BrdU staining protocol: Abcam. Available from: https://docs.abcam.com/pdf/protocols/BrdU_protocol.pdf (2020). (Accessed February 16, 2022).
21. Parslow A, Cardona A, Bryson-Richardson RJ. Sample drift correction following 4D confocal time-lapse imaging. J Vis Exp (2014) 2014:51086. doi:10.3791/51086
22. Gov NS, Safran SA. Red blood cell membrane fluctuations and shape controlled by ATP-induced cytoskeletal defects. Biophysical J (2005) 88:1859–74. doi:10.1529/biophysj.104.045328
23. Betz T, Lenz M, Joanny J-F, Sykes C. ATP-dependent mechanics of red blood cells. Proc Natl Acad Sci U S A (2009) 106:15320–5. doi:10.1073/pnas.0904614106
24. Fröhlich B, Jäger J, Lansche C, Sanchez CP, Cyrklaff M, Buchholz B, et al. Hemoglobin S and C affect biomechanical membrane properties of P. falciparum -infected erythrocytes. Commun Biol (2019) 2:311. doi:10.1038/s42003-019-0556-6
25. Sackmann E, Tanaka M. Critical role of lipid membranes in polarization and migration of cells: A biophysical view. Biophys Rev (2021) 13:123–38. doi:10.1007/s12551-021-00781-1
26. Burk AS, Monzel C, Yoshikawa HY, Wuchter P, Saffrich R, Eckstein V, et al. Quantifying adhesion mechanisms and dynamics of human hematopoietic stem and progenitor cells. Sci Rep (2015) 5:9370. doi:10.1038/srep09370
27. Kaindl T, Rieger H, Kaschel L-M, Engel U, Sleeman JP, Tanaka M, et al. Spatio-temporal patterns of pancreatic cancer cells expressing CD44 isoforms on supported membranes displaying hyaluronic acid oligomers arrays. PLOS ONE (2012) 7:e42991. doi:10.1371/journal.pone.0042991
28. Lamas-Murua M, Stolp B, Kaw S, Thoma J, Tsopoulidis N, Trautz B, et al. HIV-1 nef disrupts CD4 + T lymphocyte polarity, extravasation, and homing to lymph nodes via its nef-associated kinase complex interface. J (1950) 201:2731–43. doi:10.4049/jimmunol.1701420
29. Partin AW, Schoeniger JS, Mohler JL, Coffey DS. Fourier analysis of cell motility: Correlation of motility with metastatic potential. Proc Natl Acad Sci U S A (1989) 86:1254–8. doi:10.1073/pnas.86.4.1254
30. Michael Norton DK. Fundamentals of noise and vibration analysis for engineers. Cambridge: Cambridge University Press (2003).
31. Yoshikawa H, Rossetti F, Kaufmann S, Kaindl T, Engel U, Tanaka M, et al. Quantitative evaluation of mechanosensing of cells on dynamically tunable hydrogels. J Am Chem Soc (2011) 133:1367–74. doi:10.1021/ja1060615
32. Vogel A, Busch S, Parlitz U. Shock wave emission and cavitation bubble generation by picosecond and nanosecond optical breakdown in water. The J Acoust Soc America (1996) 100(1):148–65. doi:10.1121/1.415878
33. Yoshikawa HY, Kawano T, Matsuda T, Kidoaki S, Tanaka M. Morphology and adhesion strength of myoblast cells on photocurable gelatin under native and non-native micromechanical environments. J Phys Chem B (2013) 117:4081–8. doi:10.1021/jp4008224
34. Yoshikawa HY, Cui J, Kratz K, Matsuzaki T, Nakabayashi S, Marx A, et al. Quantitative evaluation of adhesion of osteosarcoma cells to hydrophobic polymer substrate with tunable elasticity. J Phys Chem B (2012) 116(28):8024–30. doi:10.1021/jp212385p
35. Rieger H, Yoshikawa HY, Quadt K, Nielsen MA, Sanchez CP, Salanti A, et al. Cytoadhesion of Plasmodium falciparum–infected erythrocytes to chondroitin-4-sulfate is cooperative and shear enhanced. Blood (2015) 125:383–91. doi:10.1182/blood-2014-03-561019
36. Fröhlich B, Dasanna AK, Lansche C, Czajor J, Sanchez CP, Cyrklaff M, et al. Functionalized supported membranes for quantifying adhesion of P. falciparum-infected erythrocytes. Biophysical J (2021) 120:3315–28. doi:10.1016/j.bpj.2021.07.003
37. Linke P. New stimuli-responsive substrates for the dynamic control of spatiotemporal patterns and fate of cells by physical cues. Heidelberg: Dissertation, Heidelberg University (2020). p. 2020.
38. Hayashi K, Matsuda M, Nakahata M, Takashima Y, Tanaka M. Stimulus-responsive, gelatin-containing supramolecular nanofibers as switchable 3D microenvironments for cells. Polymers (2022) 14(20):4407. doi:10.3390/polym14204407
39. Tutus M, Rossetti FF, Schneck E, Fragneto G, Förster F, Richter R, et al. Orientation-selective incorporation of transmembrane F0F1 ATP synthase complex from micrococcus luteus in polymer-supported membranes. Macromol Biosci (2008) 8(11):1034–43. doi:10.1002/mabi.200800128
40. Huang D, Nakamura Y, Ogata A, Kidoaki S. Characterization of 3D matrix conditions for cancer cell migration with elasticity/porosity-independent tunable microfiber gels. Polym J (2020) 52(3):333–44. doi:10.1038/s41428-019-0283-3
41. Tamm C, Pijuan Galitó S, Annerén C. A comparative study of protocols for mouse embryonic stem cell culturing. PLoS One (2013) 8(12):e81156. doi:10.1371/journal.pone.0081156
42. Stokes CL, Lauffenburger DA, Williams SK. Migration of individual microvessel endothelial cells: Stochastic model and parameter measurement. J Cel Sci (1991) 99(2):419–30. doi:10.1242/jcs.99.2.419
43. Gorelik R, Gautreau A. Quantitative and unbiased analysis of directional persistence in cell migration. Nat Protoc (2014) 9(8):1931–43. doi:10.1038/nprot.2014.131
44. Oliveira FA, Ferreira RMS, Lapas LC, Vainstein MH. Anomalous diffusion: A basic mechanism for the evolution of inhomogeneous systems. Front Phys (2019) 7. doi:10.3389/fphy.2019.00018
45. Ohta T, Monzel C, Becker AS, Ho AD, Tanaka M. Simple physical model unravels influences of chemokine on shape deformation and migration of human hematopoietic stem cells. Sci Rep (2018) 8(1):10630. doi:10.1038/s41598-018-28750-x
46. Gupton SL, Waterman-Storer CM. Spatiotemporal feedback between actomyosin and focal-adhesion systems optimizes rapid cell migration. Cell (2006) 125(7):1361–74. doi:10.1016/j.cell.2006.05.029
47. Jaggy M, Zhang P, Greiner AM, Autenrieth TJ, Nedashkivska V, Efremov AN, et al. Hierarchical micro-nano surface topography promotes long-term maintenance of undifferentiated mouse embryonic stem cells. Nano Lett (2015) 15(10):7146–54. doi:10.1021/acs.nanolett.5b03359
48. Gérard C, Goldbeter A. The balance between cell cycle arrest and cell proliferation: Control by the extracellular matrix and by contact inhibition. Interf Focus (2014) 4(3):20130075. doi:10.1098/rsfs.2013.0075
49. Xue J, Pisignano D, Xia Y. Electrospun nanofibers: Maneuvering the migration and differentiation of stem cells with electrospun nanofibers (adv. Sci. 15/2020). Adv Sci (Weinh) (2020) 7(15):2070083. doi:10.1002/advs.202070083
Keywords: mouse embryonic stem cell, nanofiber, cell migration, active deformation, adhesion
Citation: Kimmle E, Hajian Foroushani Z, Keppler S, Thoma J, Hayashi K, Yamamoto A, Bastmeyer M and Tanaka M (2022) Discreteness of cell–surface contacts affects spatio-temporal dynamics, adhesion, and proliferation of mouse embryonic stem cells. Front. Phys. 10:1052106. doi: 10.3389/fphy.2022.1052106
Received: 23 September 2022; Accepted: 28 November 2022;
Published: 09 December 2022.
Edited by:
Changjin Huang, Nanyang Technological University, SingaporeReviewed by:
Kabir H. Biswas, Hamad bin Khalifa University, QatarCopyright © 2022 Kimmle, Hajian Foroushani, Keppler, Thoma, Hayashi, Yamamoto, Bastmeyer and Tanaka. This is an open-access article distributed under the terms of the Creative Commons Attribution License (CC BY). The use, distribution or reproduction in other forums is permitted, provided the original author(s) and the copyright owner(s) are credited and that the original publication in this journal is cited, in accordance with accepted academic practice. No use, distribution or reproduction is permitted which does not comply with these terms.
*Correspondence: Motomu Tanaka, dGFuYWthQHVuaS1oZWlkZWxiZXJnLmRl
Disclaimer: All claims expressed in this article are solely those of the authors and do not necessarily represent those of their affiliated organizations, or those of the publisher, the editors and the reviewers. Any product that may be evaluated in this article or claim that may be made by its manufacturer is not guaranteed or endorsed by the publisher.
Research integrity at Frontiers
Learn more about the work of our research integrity team to safeguard the quality of each article we publish.