 Xiansi Wang1
 Shaokun Bi
 Jianbo Zhang
95% of researchers rate our articles as excellent or good
Learn more about the work of our research integrity team to safeguard the quality of each article we publish.
Find out more
ORIGINAL RESEARCH article
Front. Phys. , 31 October 2022
Sec. Interdisciplinary Physics
Volume 10 - 2022 | https://doi.org/10.3389/fphy.2022.1049547
This article is part of the Research Topic Multiphase Flow Behavior in the Deep-Stratum and Deep-Water Wellbores View all 13 articles
During the deepwater drilling, the complicated gas-liquid-solid multiphase flow will occur if the formation gas enters and migrates in the wellbore. Through understanding of the wellbore flow behaviors is of great importance for the blowout prevention and well control. Considering the dynamic mass and heat transfer process in wellbore caused by alternating ambient temperature field, a multiphase flow model of multicomponent fluid in wellbore is deduced and developed, including the continuity equation, momentum conservation equation and energy conservation equation. Furthermore, the corresponding initial and boundary conditions are proposed for different working conditions in deepwater drilling, and an efficient numerical solution method is established, including dynamic mesh generation method and discrete solution method of partial differential equations. Applied in a deep-water kicking well, the proposed model is used to analyze the multiphase flow rules in the wellbore. The results show that in the process of annular fluid returning from the bottomhole, the pressure generally decreases linearly, while the temperature change is nonlinear. The temperature first rises and then falls at the formation section, and first falls and then rises at the seawater section. Furthermore, the pit gain increases approximately in a quadratic polynomial relationship, caused by the rise and expansion of gas in the wellbore, and the pressure drop and gas influx rate increase at the bottomhole. In the process of kick evolution, the standpipe pressure and bottomhole pressure gradually decrease, which can be an important sign for kick detection.
During deepwater drilling, the formation gas intrudes into the wellbore and blowout occurs, which is a great threat to safe and efficient drilling. In 2010, the Deepwater Horizon drilling platform in the Gulf of Mexico blew out, causing direct economic losses of more than 68 billion US dollars. In addition, it also caused huge casualties and well completion disasters [1–3]. Therefore, studying the rules of wellbore multiphase flow during gas kick has important engineering value for accurately understanding the gas invasion process and make well control plan for the blowout prevention.
Since the 1960s, great efforts have been made to study the multiphase flow model in gas kick. Leblanc and Leuis (1968) established a kick model based on the homogeneous flow theory [4], but the model ignores the friction and pressure loss in the annulus and gas-liquid slippage velocity, which is only suitable for simplified calculation. The kick flow model established by Records (1972) considers the influence of friction and pressure loss in the annulus, but the calculation result of the model has a significant error compared with the field measurements [5]. Horberock and Stanbery (1981) established the momentum conservation equation of fluid in vertical pipeline. Based on the theory of homogeneous flow, the gas-liquid flow characteristic are analyzed [6]. Considering gas-liquid slippage and pressure loss of two-phase flow, Santos (1982) introduced the concept of void fraction and established a deep-well kick flow model [7]. Nickens (1987) analyzed the wellbore multiphase flow parameters considering the gas-liquid phase transition, slippage and mass transfer [8]. They studied the effects of wellbore shape, BHA and hydraulic parameters on wellbore pressure distribution. On this basis, Ohara (1995) proposed a deep-water well control model [9], in which the flow process of mud at different stages in the well is divided into several sub models for simulation. In particular, Nunes (2002) proposed an analytical model of wellbore multiphase flow and the corresponding numerical solution method [10]. The model can calculate the pressure distribution and gas distribution in the wellbore and choke line at different times. Wang and Sun (2009) established a multiphase flow model in a gas kick [11], which can be applied to the wellbore multiphase flow simulation in the process of gas kick and well killing in deepwater drilling. Pourafshary et al (2009) considered the coupling between wellbore fluid and reservoir fluid and the slippage of multicomponent gas and liquid phase, and established the unsteady wellbore two-phase flow model assuming that the gas phase and liquid phase are in phase equilibrium on any wellbore section [12]. Lu and Connell (2014) considered the phase transition process in wellbore multiphase flow and established the unsteady model of wellbore liquid injection process based on phase stability analysis and phase separation calculation [13]. Udegbunam et al. (2014) analyzed the influence of uncertainty of parameters such as pipe string dimension, slippage velocity, friction coefficient and reservoir characteristics on flow characteristics during underbalanced drilling [14]. Fu et al. (2020) [15–17] experimentally studied and modelled the methane hydrate formation under bubbly flow condition in the deep-water drilling wellbore. The methane hydrate formation in drilling mud altered the rheology of drilling mud which made it exhibit non-Newtonian behavior [18] and increased the pressure losses of drilling mud in the wellbore [19, 20]. Their works are significant for increasing accuracy of predicting pressure loss in wellbore and provided a solid stone for modelling the multiphase flow behavior in deepwater wellbore. Recently, Sun et al (2018) developed several models to analyze the effect of phase transition on gas kick migration in wellbore [21–29].
During deepwater drilling, the multiphase flow rules of gas kick is more complex than that of onshore well kick, caused by the alternating change of low temperature at seawater section and high temperature at deep formation section. The flow in wellbore is a complex dynamic mass and heat transfer process. Therefore, it is necessary to establish an accurate multiphase and multicomponent flow model to obtain the dynamic distribution of flow parameters such as fluid velocity, pressure and temperature in the process of blowout evolution. In this paper, considering the dynamic mass and heat transfer process in wellbore, a multiphase flow model in wellbore of multicomponent fluid is deduced and established. Furthermore, the corresponding initial and boundary conditions are presented for different working conditions in deepwater drilling and an efficient numerical solution method is established, including dynamic mesh generation method and discrete solution method of partial differential equation. Last, a detailed analysis has been performed to evaluate the wellbore multiphase flow process of a deep-water kicking well.
There are complex changes in multiphase flow parameters in deepwater drilling. The model assumptions are as follows.
1) Fluid flow is regarded as one-dimensional flow along the wellbore, ignoring the rotation of drilling tools and the axial migration of drilling fluid.
2) There is stable radial heat transfer between wellbore and formation, and the rock is homogeneous.
3) Ignore the changes in physical property of formation rock, drilling tools, casing and cement sheath.
4) Ignore the heat generated by the friction of the drilling tool.
5) The dissolution of gas is instantaneous.
As a gas kick occurs in deepwater drilling, the gas phase, drilling fluid phase, cuttings phase and hydrate may exist in the wellbore at the same time. According to the principle of mass conservation, the continuity equations of each phase in the wellbore are developed as follows:
Where,
Based on the momentum conservation principle of fluid in the wellbore, the equation of pressure field distribution is obtained as follows:
The schematic of energy conservation in the model is shown in Figure 1. Assuming that the flow is gas-liquid two-phase flow, the energy equation of wellbore unsteady flow and heat transfer is proposed. The annular element of the well section below the mudline is analyzed as follows.
① The heat flowing into the micro element from the lower end face

FIGURE 1. Schematic of energy conservation equation derivation in kick multiphase flow model.
Each parameter is a function of time and position,
Where, i is each component in the wellbore, respectively, g (gas), w (drilling fluid), C (rock cuttings) and H (hydrate); mi is the mass flow rate of each component, kg/s; Ci is the specific heat capacity of each component, J/(kg. °C).
② The heat flowing into the micro element from the lower end face
The temperature at the upper end is
③ Heat flowing from the formation into the annulus
In which,
TD is the transient heat transfer function, which is simulated as follows
In case of the seawater section,
Where, krs is the thermal conductivity of riser.
④ Heat flowing into the drilling tool from the annulus
⑤ Heat change inside the wellbore unit
According to the energy conservation, the heat change inside the unit body = the heat flowing into the unit body—the heat flowing out of the unit body, i.e.
Since
Therefore, the temperature field equation in the annulus is obtained as,
Similarly, the equation of temperature field in drill pipe is obtained as,
1) Seawater temperature field.
The complex ambient temperature field is one of the key factors affecting the multiphase flow rules in wellbore. The temperature at seawater section decreases gradually with water depth, and the variation trend is nonlinear. However, the temperature at formation rock section gradually increases with well depth, and the change trend is related to the formation temperature gradient.
The simulation methods of seawater temperature in spring, summer and autumn (Gao, 2007 [30]) are as follows.
① Water depth h ≤ 200 m,
Where, Tsea is seawater temperature, °C; Ts is the seawater surface temperature, °C.
② Water depth h > 200 m
2) Formation temperature field.
The variation of formation temperature field in deep-water drilling is similar to that in onshore drilling. The formation temperature gradient is mainly related to the lithology and sedimentary characteristics of the rocks.
Where, T0 is seawater temperature at mudline, °C; h0 is the sea water depth, m; h is the vertical depth, m.
1) Initial conditions of temperature field
① Start circulating
At initial condition, the fluid temperature in the wellbore is the same as the ambient temperature:
② Gas kick process
The initial condition of temperature field in gas kick is the temperature distribution of drill pipe and annulus calculated at the moment before gas kick.
2) Initial conditions of pressure field
During normal drilling, there is no gas influx
Where, Qm is the displacement of mud pump, m3/s; qc is the displacement of rock cuttings, m3/s.
Regarding the calculation of flow parameters during pump shutdown and well killing, the initial conditions are the distribution of flow parameters in the wellbore at the moment before the change of working conditions.
1) Boundary conditions of temperature field
Because the liquid temperature at the drill string inlet can be measured directly, the boundary condition of the temperature field is
At the same time, the temperatures of the liquid in the drill string and the annulus liquid at the bottom of the well are equal, i.e.
Where, Tin is the inlet temperature of drill string, °C; Tin is the well depth, m.
2) Boundary conditions of pressure field and velocity field
During a gas kick, the boundary conditions of pressure and flow velocity parameters are as follows.
Where, Ps is wellhead back pressure, Pa.
It is very difficult to obtain the analytical solution directly for the established multiphase flow model. In this study, the corresponding numerical algorithm is established for the above model. Firstly, the wellbore needs to be meshed, and the spatial grid length (usually long at the bottom and short at the top) is dynamically selected according to the fluid velocity and gas rising velocity in the wellbore. Then set the initial time step, and automatically adjust the time step according to the calculation speed requirements.
According to the gas rising speed
Where, ∆tj is the time step of node j, s; ∆Sj is the spatial step of node j, m; |U| is the absolute value of the correlation speed at node j,
The schematic diagram of spatial grid division is shown in Figure 2. The length of any spatial grid is
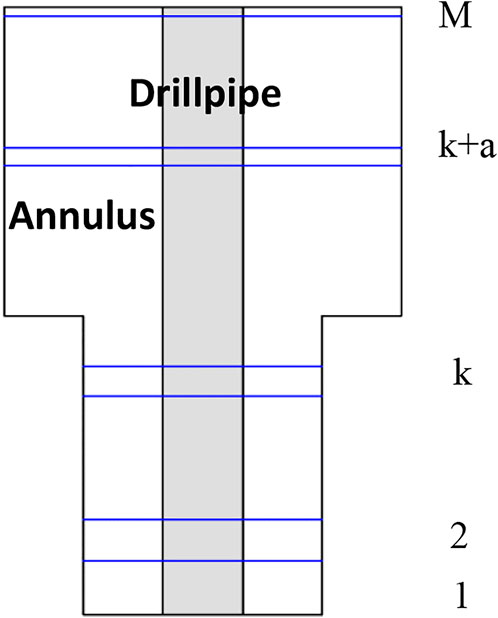
FIGURE 2. Discrete grids of space domain and time domain for kick multiphase flow model.
The dynamic grid difference model are used in this study. Taking the gas phase continuity equation as an example, the CV discrete method (control volume method) is adopted,
The schematic of spatial grid division is shown in Figure 3. Where,
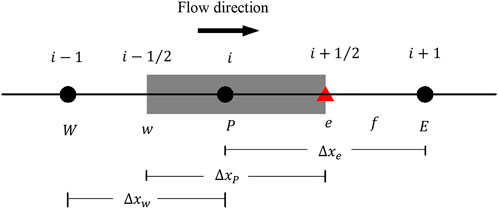
FIGURE 3. Schematic of space domain in x direction.
Eq. 49 can be differenced as follows:
Where, ξ and
Similarly, the momentum equation and energy equation of wellbore multiphase flow model can be obtained and solved [29].
Using the proposed multiphase flow model, the flow parameter, and temperature and pressure distributions in the drill pipe and annulus are analyzed. The parameters of the field well are shown in Tables 1, 2.

TABLE 1. Thermo-dynamic parameters in the case.
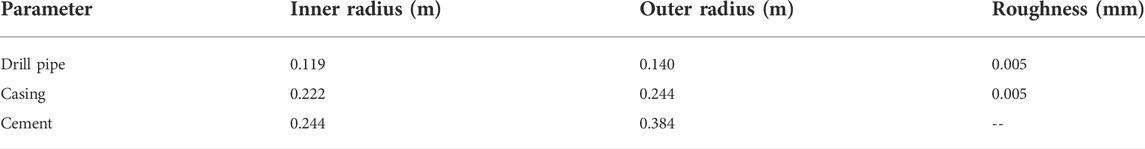
TABLE 2. Parameters of wellbore geometry structure.
Figure 4 shows the temperature distribution in the wellbore under different displacements. On the one hand, the heat in the annulus is transferred to the drill pipe, and the mud temperature in the drill pipe increases gradually. On the other hand, the mud in the annulus exchanges heat with the surroundings. In the seawater section, the heat in the annulus is mainly transmitted to the seawater; and in the formation section, the heat in the annulus is mainly transmitted to the formation section. At a specific well depth, when the heat absorbed by the mud in the annulus from the outside is greater than the heat transmitted to the drill pipe, its temperature gradually increases; on the contrary, its temperature gradually decreases. Therefore, when the mud returns from the annulus, the temperature gradually rises near the bottomhole. As the formation temperature decreases and enters the seawater section, the annulus temperature decreases gradually. Near the sea surface, the mud temperature rises slightly.
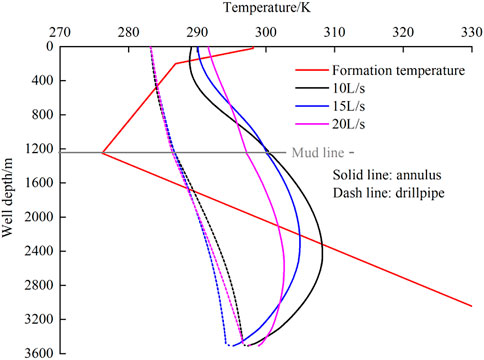
FIGURE 4. Temperature distribution in the drill pipe and annulus with different displacements.
With the increase of displacement, the temperature variation rate in drill pipe and annulus decreases. Because the larger the mud displacement, the less sufficient the heat exchange with the surroundings.
Figure 5 shows the wellbore pressure distribution under different displacements. With the increase of well depth, the pressure in drill pipe and annulus varies linearly. However, affected by the influence of annulus friction and bit pressure drop, the pressure in the drill pipe is greater than that in the annulus.
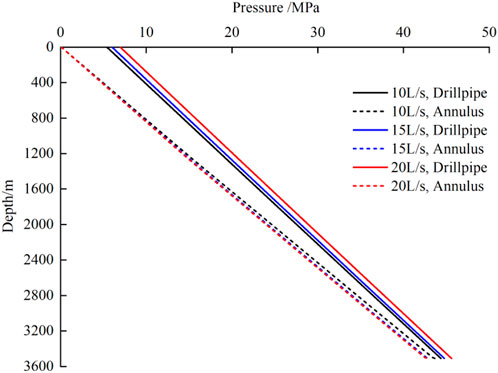
FIGURE 5. Pressure distribution in the drill pipe and annulus with different discharge capacities.
As seen in Figure 6, the difference between inflow and outflow rates increases linearly with time. Because the change of outlet flow during gas kick is mainly caused by gas rise in the wellbore and the continuous entry of new gas into the wellbore. In the early stage, the gas mainly remain at the bottomhole, and its volume change is inversely proportional to pressure, while the change of wellbore pressure is linearly related to the well depth. Therefore, the expansion of gas volume is approximately proportional to the well depth. On the other hand, at the initial stage, regardless of the change of bottom hole pressure, gas enters the wellbore at a constant overflow rate.
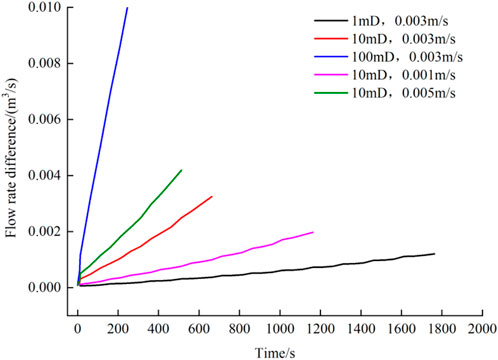
FIGURE 6. Change of mud flow rate in the inlet and outlet under different kick conditions.
Figure 7 shows the change curve of mud pit increment during overflow. When the time is 5 min, the pit gain increases approximately in a quadratic polynomial relationship with the increase of time. Under the same conditions, with the increase of ROP(Rate of Penetration) or reservoir permeability, the pit gain increases, and the increasing range is accelerated. Because with the increase of permeability and reservoir exposure thickness, various effects such as bottom hole pressure reduction, overflow speed acceleration, bubble rise and expansion, result in the intensification of gas kick.
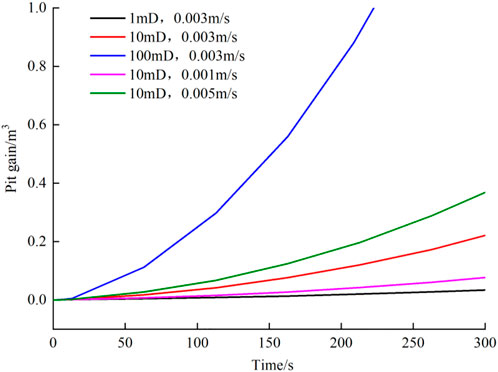
FIGURE 7. Change of pit gain with time under different kick conditions.
Therefore, when drilling in high pressure and high permeability formation, the ROP (rate of penetration) should be controlled and the early detection of overflow should be strengthened.
Figure 8 shows the gas distribution when the pit gain is 1 m3. As seen, with the increase of reservoir permeability or ROP, the shorter the time required for pit gain reaching 1 m3, the shorter the gas rising distance and the lower the gas volume fraction. Therefore, the gas section with high void fraction is prone to rapid expansion at the wellhead, which has a greater impact on well control.
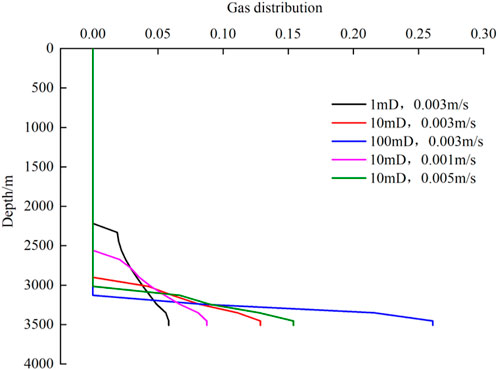
FIGURE 8. Gas distribution in the annulus when pit gain is 1 m3 under different kick conditions.
Figure 9 shows the variations of the standpipe pressure with time. The change of standpipe pressure is the same as that of bottom hole pressure. At the initial stage of gas kick, the previous gas in the wellbore slip and expand at a constant rising speed, and the new gas from the reservoir enter the wellbore at a constant rate. The change of bottomhole pressure is mainly caused by the loss of hydrostatic pressure in the wellbore.
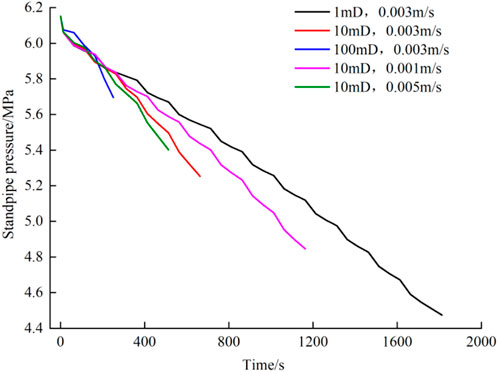
FIGURE 9. Curve of standpipe pressure variation under different kick conditions.
Using the proposed model, the multiphase flow rules in the wellbore during the gas kick is analyzed. The results show that in the process of annular fluid returning from the bottom of the well, the pressure generally decreases linearly while the temperature change is nonlinear. It first rises and then falls at the formation section, and first falls and then rises at the seawater section. With the increase of displacement, the temperature change rate in drill pipe and annulus decreases. Because the larger the mud displacement, the less sufficient the heat exchange with the surroundings. In the process of gas kick, the difference between inflow and outflow rates increases linearly with time, and the pit gain increases approximately in a quadratic polynomial relationship. Furthermore, in the process of kick evolution, the standpipe pressure and bottomhole pressure gradually decrease.
The original contributions presented in the study are included in the article/supplementary material, further inquiries can be directed to the corresponding author.
XW: Methodology; LH: Original draft preparation XL: Investigation; SB: Supervision: HL: Software, Validation: JZ: Material correlation calculation; XS: Writing- Reviewing and Editing.
This work was supported by the National Natural Science Foundation--Youth Foundation (5210040269), Postdoctoral innovative talents support program in Shandong Province (SDBX2020005), Postdoctoral innovative talents support program in China (BX2021374) and Postdoctoral Applied Research Project of Qingdao (qdyy20200086).
XW, LH, XL, HL, were empolyed by CNPC Offshore Engineering Co., Ltd.
The remaining authors declare that the research was conducted in the absence of any commercial or financial relationships that could be construed as a potential conflict of interest.
All claims expressed in this article are solely those of the authors and do not necessarily represent those of their affiliated organizations, or those of the publisher, the editors and the reviewers. Any product that may be evaluated in this article, or claim that may be made by its manufacturer, is not guaranteed or endorsed by the publisher.
1. Levy JK, Gopalakrishnan C. Promoting ecological sustainability and community resilience in the US Gulf Coast after the 2010 Deepwater Horizon oil spill. J Nat Resour Pol Res (2010) 2(3):297–315. doi:10.1080/19390459.2010.500462
3. Norse EA, Amos J. Impacts, perception, and policy implications of the Deepwater Horizon oil and gas disaster. Envtl L Rep News Anal (2010) 40:11058.
4. Leblanc JL, Lewis RL. A mathematical model of a gas kick. J Pet Technology (1968) 20(8):888–98. doi:10.2118/1860-pa
6. Hoberock LL, Stanbery SR. Pressure dynamics in wells during gas kicks: Part 1 - component models and results. J Pet Technology (1981) 33(8):1357–66. doi:10.2118/9256-pa
7. Santos OLA. Mathematical model of a gas kick when drilling in deep waters. Colorado School of Mines (1982).
8. Nickens HVA. A dynamic computer model of a kicking well. SPE Drilling Eng (1987) 2(2):159–73. doi:10.2118/14183-pa
9. Ohara S. Improved method for selecting kick tolerance during deepwater drilling operations. Baton Rouge: Louisiana State University and Agricultural & Mechanical College (1996).
10. Nunes JOL, Bannwart AC, Ribeiro PR. Mathematical modeling of gas kicks in deep water scenario[C]. In: IADC/SPE Asia Pacific Drilling Technology (2002).
11. Wang ZY, Sun BJ. Annular multiphase flow behavior during deep water drilling and the effect of hydrate phase transition. Pet Sci (2009) 6(1):57–63. doi:10.1007/s12182-009-0010-3
12. Pourafshary P, Varavei A, Sepehrnoori K, Podio A. A compositional wellbore/reservoir simulator to model multiphase flow and temperature distribution. J Pet Sci Eng (2009) 69:40–52. doi:10.1016/j.petrol.2009.02.012
13. Lu M, Connell LD. Transient, thermal wellbore flow of multispecies carbon dioxide mixtures with phase transition during geological storage. Int J Multiphase Flow (2014) 63:82–92. doi:10.1016/j.ijmultiphaseflow.2014.04.002
14. Udegbunam JE, Lohne HP, Fjelde KK, Arild Ø, Ford E Improved underbalanced operations with uncertainty analysis[C]. In: IADC/SPE Drilling Conference and Exhibition (2014).
15. Fu WQ, Wang ZY, Zhang JB, Sun BJ. Methane hydrate formation in a water-continuous vertical flow loop with xanthan gum. Fuel (2020) 265:116963. doi:10.1016/j.fuel.2019.116963
16. Sun BJ, Fu WQ, Wang N, Wang ZY, Gao YH. Multiphase flow modeling of gas intrusion in oil-based drilling mud. J Pet Sci Eng (2019) 174:1142–51. doi:10.1016/j.petrol.2018.12.018
17. Fu WQ, Wang ZY, Chen LT, Sun BJ. Experimental investigation of methane hydrate formation in the carboxmethylcellulose (CMC) aqueous solution. SPE J (2020) 25(3):1042–56. doi:10.2118/199367-pa
18. Fu WQ, Wei W, Wang H, Huang BX, Wang ZY. Study on the rheology of CO2 hydrate slurry by using the capillary method. J Mar Sci Eng (2022) 10:1224. doi:10.3390/jmse10091224
19. Fu WQ, Yu J, Xiao Y, Wang CL, Huang BX, Sun B. A pressure drop prediction model for hydrate slurry based on energy dissipation under turbulent flow condition. Fuel (2022) 311(2022):122188. doi:10.1016/j.fuel.2021.122188
20. Fu WQ, Yu J, Xu YH, Wang CL, Huang BX, Sun BJ. A pressure drop prediction model for hydrate slurry based on energy dissipation under laminar flow condition. SPE J (2022) 27(04):2257–67. doi:10.2118/209586-pa
21. Liao Y, Wang Z, Sun X, Lou W, Liu H, Sun B. Modeling of hydrate dissociation surface area in porous media considering arrangements of sand grains and morphologies of hydrates. Chem Eng J (2022) 312:133830. doi:10.1016/j.cej.2021.133830
22. Liao Y, Wang Z, Sun X, Sun B, Linga P. Modeling and characterizing the thermal and kinetic behavior of methane hydrate dissociation in sandy porous media. Appl Energ (2022) 312:118804. doi:10.1016/j.apenergy.2022.118804
23. Sun X, Wang Z, Sun B, Chen L, Zhang J. Modeling of dynamic hydrate shell growth on bubble surface considering multiple factor interactions. Chem Eng J (2018) 331:221–33. doi:10.1016/j.cej.2017.08.105
24. Sun X, Sun B, Wang Z, Chen L, Gao Y. A new model for hydrodynamics and mass transfer of hydrated bubble rising in deep water. Chem Eng Sci (2017) 173:168–78. doi:10.1016/j.ces.2017.07.040
25. Sun X, Sun B, Wang Z, Chen L, Gao Y. A hydrate shell growth model in bubble flow of water-dominated system considering intrinsic kinetics, mass and heat transfer mechanisms. Int J Heat Mass Transfer (2018) 117:940–50. doi:10.1016/j.ijheatmasstransfer.2017.10.045
26. Sun X, Sun B, Zhang S, Wang Z, Gao Y, Li H. A new pattern recognition model for gas kick diagnosis in deepwater drilling. J Pet Sci Eng (2018) 167:418–25. doi:10.1016/j.petrol.2018.04.035
27. Sun X, Sun B, Gao Y, Wang Z. A model of multiphase flow dynamics considering the hydrated bubble behaviors and its application to deepwater kick simulation. J Energ Resour Technology (2018) 140(8). doi:10.1115/1.4040190
28. Sun X, Wang Z, Li H, He H, Sun B. A simple model for the prediction of mutual solubility in CO2-brine system at geological conditions. Desalination (2021) 504:114972. doi:10.1016/j.desal.2021.114972
29. Sun B, Sun X, Wang Z, Chen Y. Effects of phase transition on gas kick migration in deepwater horizontal drilling. J Nat Gas Sci Eng (2017) 46:710–29. doi:10.1016/j.jngse.2017.09.001
Keywords: gas kick detection, multiphase flow (G/L/S), deepwater well, numerical solution, transient heat transfer
Citation: Wang X, Huang L, Li X, Bi S, Li H, Zhang J and Sun X (2022) Wellbore multiphase flow behaviors of gas kick in deep water horizontal drilling. Front. Phys. 10:1049547. doi: 10.3389/fphy.2022.1049547
Received: 20 September 2022; Accepted: 05 October 2022;
Published: 31 October 2022.
Edited by:
Weiqi Fu, China University of Mining and Technology, ChinaReviewed by:
Jiahui Chen, University of Alberta, CanadaCopyright © 2022 Wang, Huang, Li, Bi, Li, Zhang and Sun. This is an open-access article distributed under the terms of the Creative Commons Attribution License (CC BY). The use, distribution or reproduction in other forums is permitted, provided the original author(s) and the copyright owner(s) are credited and that the original publication in this journal is cited, in accordance with accepted academic practice. No use, distribution or reproduction is permitted which does not comply with these terms.
*Correspondence: Xiaohui Sun, c3hoMDQ5MzA2QDE2My5jb20=
Disclaimer: All claims expressed in this article are solely those of the authors and do not necessarily represent those of their affiliated organizations, or those of the publisher, the editors and the reviewers. Any product that may be evaluated in this article or claim that may be made by its manufacturer is not guaranteed or endorsed by the publisher.
Research integrity at Frontiers
Learn more about the work of our research integrity team to safeguard the quality of each article we publish.