 Xiaoyan Shang
 Wei Shi
 Junhong Su1
94% of researchers rate our articles as excellent or good
Learn more about the work of our research integrity team to safeguard the quality of each article we publish.
Find out more
ORIGINAL RESEARCH article
Front. Phys. , 28 October 2022
Sec. Optics and Photonics
Volume 10 - 2022 | https://doi.org/10.3389/fphy.2022.1046919
This article is part of the Research Topic Advanced Terahertz Spectrum and Metamaterials for Biochemical Sensing and Detection View all 5 articles
The undamaged and damaged areas of the ITO thin film deposited on a silicon substrate induced by laser with different energies were tested with the transmission terahertz time-domain spectroscopy system. Their time-domain spectra and frequency-domain spectra of 0.4–1.0 THz were obtained, and the differences were analyzed between the undamaged and damaged areas in these two spectra. The results show that the peak-to-peak value in the time domain and the amplitude in the frequency domain of the damaged area evidently increased compared with those of the undamaged area, and with the increase in laser-induced energy, resulting in the larger damaged area and heavier surface roughness, these two parameters gradually decrease. For the damaged area of the ITO thin film with the undamaged substrate, the refractive index and absorption coefficient are lower than those of the undamaged area. Therefore, the variation in the terahertz time-domain and frequency-domain spectra could be utilized to distinguish the damage of the optical thin film irradiated by laser, which provides a new approach for the laser-induced damage identification and the technical support in effect of the laser-induced damage on the properties of the optical thin film element in the terahertz band.
A thin film element is an important part of the high energy laser system; its laser-induced damage threshold restricts the higher energy output level of the laser system, and it is accurately tested to be particularly important; in the test, thin film damage identification is the key. At present, the identification method is phase contrast microscopy, scattered light detection, the image method, and acoustic discrimination. [1] Each method has its rationality and scope of application, but it cannot completely solve the problem of damage identification, and among the current damage identification methods, some determine the damage by comparing the morphological changes of the damaged and undamaged areas, and some determine by detecting the changes of the instantaneous signal when the damage occurs. These methods mainly focus on the analysis of the visible light band.
The terahertz wave is the electromagnetic wave with the frequency of 0.1–10 THz, which is between the microwave and infrared band and is called the submillimeter wave or far-infrared wave. Due to its unique characteristics, it has attracted wide international attention. Terahertz time-domain spectroscopy (THz-TDS) detects the terahertz wave that is transmitted through the sample or is reflected from the surface of the sample and carries the sample abundant physical and chemical information; then, the terahertz time-domain spectroscopy of the sample is obtained and processed; the amplitude, the phase, and the optical parameter of the sample in the terahertz band could be achieved for analyzing the structure and composition of the sample, and by this way, semiconductors, dielectric materials, non-polar materials, and composite materials could be accurately measured [2–5]. Stoik et al. [6] utilized the time-domain peak value and peak time to test the thermal damage of aviation composites at different time intervals and temperatures. Ospald et al. [7] detected surface defects, embedded defects, and honeycomb structures of aerospace composites by terahertz time-domain spectroscopy. Liao et al. [8] used the reflective THz-TDS system to test the surface defect of carbon fiber composites, and the feasibility of the method was verified. Guo et al. [9] tested the defect of glass fiber composites by terahertz time-domain technology. Malinowski et al. [10] irradiated six positions of plant fiber composite samples with increasing laser energy and tested the state of the irradiated samples with the terahertz time-domain spectral imaging system, and the damaged positions could be clearly identified. Zhou et al. [11] calculated the complex refractive index of thin metal films with a nanometer thickness of Ti, NiGr, and Au deposited on the silicon substrate at 0.1T-3 THz by terahertz time-domain spectroscopy. Ma et al. [12] studied the relationship between dielectric properties, absorption, and the refractive index of the conductive ZnO film deposited on a glass substrate with different carrier concentrations in the range of 0.1T–1 THz by measuring the time-domain signal of the terahertz wave passing through the sample. Ma et al. [13] studied the optical characteristics of the ultra-thin metal film of Cr, Ni, and Ti deposited on high-resistance silicon in the terahertz band; the aforementioned research results show that the terahertz wave has distinct advantages in detecting material defects and damage and can be used to study the optical properties of thin films in the terahertz band. However, the terahertz wave is rarely utilized to study the damage of optical thin films induced by laser, so herein, the transmission terahertz time-domain spectroscopy system is used to study the terahertz spectrum of the undamaged and the damaged regions of the ITO film deposited on a silicon substrate which was irradiated by laser with different energy levels and which provides a technical basis for analyzing the effect of laser-induced damage on the optical characteristics of the optical thin film component in the terahertz band and a new research idea for laser-induced damage identification.
Experimental samples were measured by using the transmission terahertz time-domain spectroscopy system, as shown in Figure 1. The system is mainly composed of a femtosecond laser, time delay unit, terahertz radiation, and detection unit. The Mai Tai laser, with a center wavelength of 800 nm, pulse width of 60 fs, repetition frequency of 80 MHz, and an output power of 950 mW [14], emits a femtosecond laser pulse, which is divided into two paths after passing through mirrors M1 and M2, and the beam splitter CBS. One is the pump light path, and the other is the detection light path; the pump light is reflected by the mirror M5 and focused on a photoconductive antenna PCA by a lens L1 after passing through the time delay system to generate a terahertz pulse. This pulse is collimated and focused on the measured sample by using off-axis paraboloidal mirrors PM1 and PM2. After the pulse transmits the sample, it carries the sample information and is collimated by PM3, focused by PM4, and reflected by the component ITO. Then, the pulse and the detection light, which is reflected by mirrors M6, M7, and M8 and transmits the component ITO, pass through the ZnTe electro-optical crystal at the same time. Because the terahertz electric field changes the refraction coefficient of the ZnTe crystal, the transmitted detection light is transformed into elliptically polarized light and is split into two beams of polarized light whose intensities are different, observed by using a Wallaston prism, and finally are, respectively, received by the balanced detector; the output voltage reflects the electric field intensity of the terahertz pulse passing through the sample. Based on the point-by-point time delay, the whole time domain spectrum of the terahertz pulse could be obtained through the ellipsometry change of the detection light. With the Fourier transform, the corresponding terahertz frequency-domain spectrum is achieved and the amplitude and phase information are extracted. During the experiment, the whole system was set in the air environment with the temperature of 23°C, the relative humidity of 13%, and the signal-to-noise ratio of 1,300 dB.
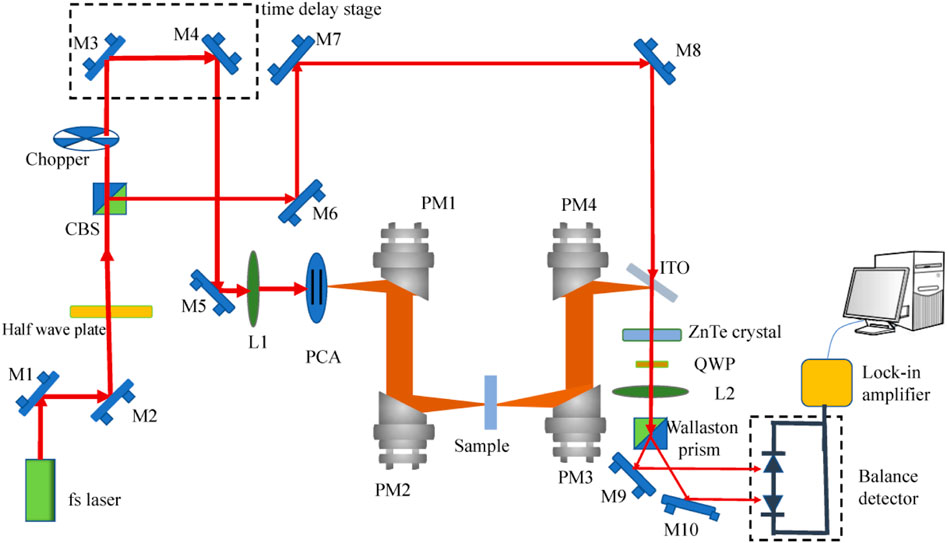
FIGURE 1. Schematic diagram of the transmission terahertz time-domain spectroscopy system.
For the preparation of experimental samples, the high-resistance monocrystalline silicon with a crystal orientation N(100) and thickness of 500 μm was used as the substrate, and the mixture of In2O3 and SnO2 with the ratio of 95:5 is the raw material. The thin film deposition was performed by the way of electron beam thermal evaporation. M-2000UI variable angle wide spectral ellipsometry was used to measure the thin film thickness, which was 121.246 nm. The thin film was irradiated by laser in the 1-on-1 mode. The laser-induced damage test device is shown in Figure 2; the laser beam was emitted using a Nd: YAG solid state laser with the output wavelength of 1,064 nm, the pulse width of 10 ns, and the maximum output energy of 400 mJ, then passed through the attenuator, and was converged on the surface of the measured thin film element with the irradiated spot diameter of 2.5 mm by using the lens focusing system. Simultaneously, the irradiation energy is measured using the energy meter. In the experiment, the ITO film sample was irradiated by a laser beam with the energy densities of 1.03, 1.28, 1.55, and 2.23 J/cm2; the damaged and undamaged areas of the sample were observed under the microscope, as shown in Figure 3.
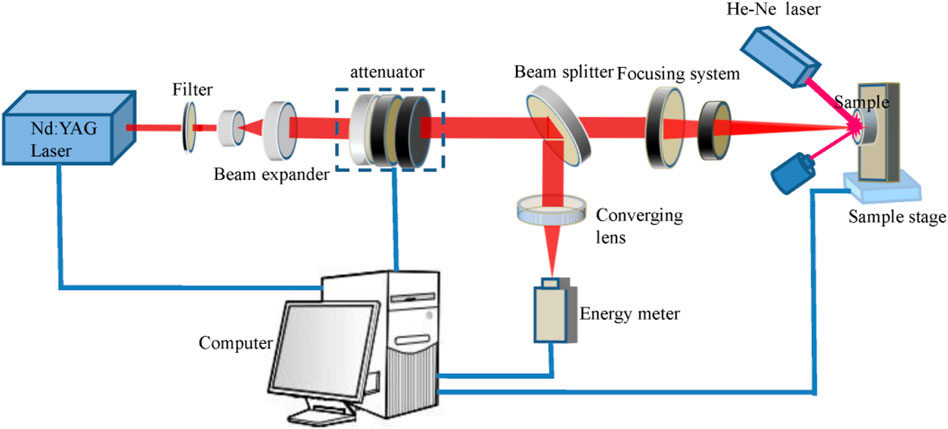
FIGURE 2. Laser-induced damage measurement system.
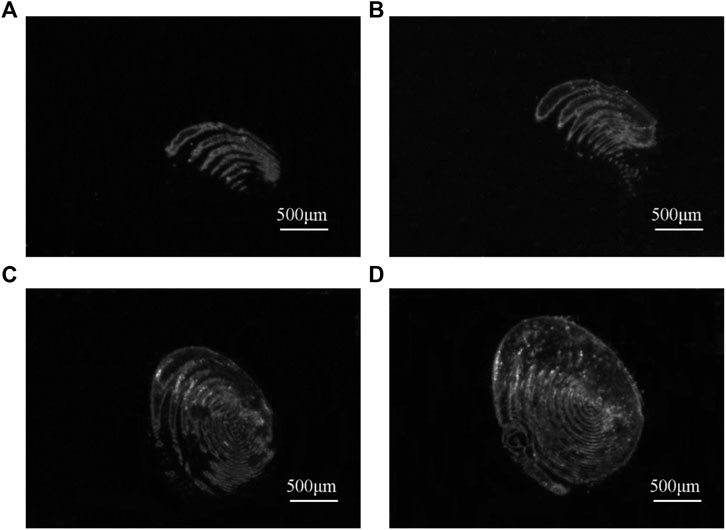
FIGURE 3. The damage image of the sample with ITO thin film induced by laser on condition of different energy. Density (A) 1.03J/cm2 (B) 1.28J/cm2 (C) 1.55J/cm2 (D) 2.23J/cm2.
According to Figure 3, when the laser energy density was 1.03 and 1.28J/cm2, a comb-shaped damage appeared on the surface of the ITO film due to the interference effect and beam shape change, and the damage area in Figure 3B was larger than that in Figure 3A, especially due to the melting damage caused by heat absorption. When the laser energy density was 1.55 and 2.23 J/cm2, the damaged area enlarged evidently and the damage shape presented an elliptical annular stripe in the upper right part of Figure 3D. Due to the temperature gradient formed during laser irradiation, thermal stress is generated. When it is greater than the tensile or compressive strength of the film, stress damage occurs.
For a thin film sample, the substrate should be considered when the optical constant is calculated. Since the thin film thickness is in the order of nanometer, which is much smaller than that of the substrate, in order to simplify the calculation, the echo signal is usually considered, which is formed by multiple reflection on the upper and lower surfaces of the film, while the multiple reflection in the substrate is ignored [15]. As shown in Figure 4, E0(ω) is the incident terahertz electric field and Eref and Esam(ω) are the terahertz electric fields transmitted through the substrate and the thin film sample, respectively.
where t13 and t34 are the transmission coefficient of the interface between air and the substrate and between the substrate and air; the transmission factor of the terahertz wave penetrating through the substrate
The transmission factor in air
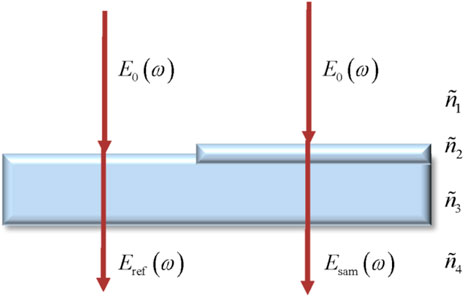
FIGURE 4. Schematic diagram of the terahertz wave vertically transmitting into the thin film sample and the substrate.
When the terahertz wave transmits into the thin film sample, it will be reflected many times between the upper and lower surfaces of the thin film, and the F-P effect occurs. Therefore, Esam(ω) is represented by
where t12 and t23 are the transmission coefficients of the interface between air and the thin film and between the thin film and the substrate, respectively; the transmission factor of the terahertz wave penetrating through the thin film
The transmission factor in air is
FP(ω) could be expressed as [16].
where r21 and r23 are the reflection coefficients of the interface between the thin film and air and between the thin film and the substrate, and they are, respectively, expressed as
Substituting Eq. 7 from Eq. 4, we get
The differential signal Ediff(ω) is expressed as
Then, the transfer function is given by
From Eq. 1, Eq. 2, Eq. 3, Eq. 5, Eq. 6, and Eq. 8, the following formula can be obtained:
According to Fresnel formula,
Considering Eq. 13,
Then, the following relationship is established:
Considering that the complex dielectric constant of the material
The absorption coefficient
In Eq. 18, the absorption coefficient of the sample includes the absorption of the incident THz waves by the sample itself and the attenuation caused by scattering and reflection [17–19].
Based on the transmission terahertz time-domain system, the undamaged area and laser-induced damage area of the ITO thin film deposited on the silicon substrate were tested. The results are shown in Figure 5. Figure 5A shows the reference time-domain waveform when there was no sample, and Figure 5B shows the waveform when the terahertz wave passed through the bare silicon substrate and the undamaged area and the damage area of the sample induced by laser with the energy densities of 1.03, 1.28, 1.55, and 2.23 J/cm2. The peak-to-peak values of time-domain waveforms in Figure 5 are shown in Table 1. The peak-to-peak value of the signal after the terahertz wave passed through the bare silicon substrate was 46.87% of the reference signal; it was 40.01% of the reference signal after it passed through the ITO thin film sample, and the delay time was 4.07 ps. The value decrease was caused by the absorption, scattering, and surface reflection of the terahertz wave by the bare silicon substrate and the ITO thin film. The reason of the delay time was that the refractive indexes of the bare silicon substrate and the ITO thin film were larger than that of air. The value decrease of the ITO thin film sample relative to the bare silicon substrate was caused by the absorption and stronger surface reflection of the terahertz wave by the ITO thin film. When the terahertz wave penetrated through the damaged area induced by the laser with the energy densities of 1.03, 1.28, 1.55, and 2.23 J/cm2, the peak-to-peak values were 15.8, 15, 14.5, and 7% higher than those of the undamaged area, respectively, and with the increase in the laser-induced energy density, the peak-to-peak value of the damaged area gradually decreased, in order to analyze the morphology of the damaged area. The Zygo NewView 8000 surface profilometer was used to test the three-dimensional profile of the sample.
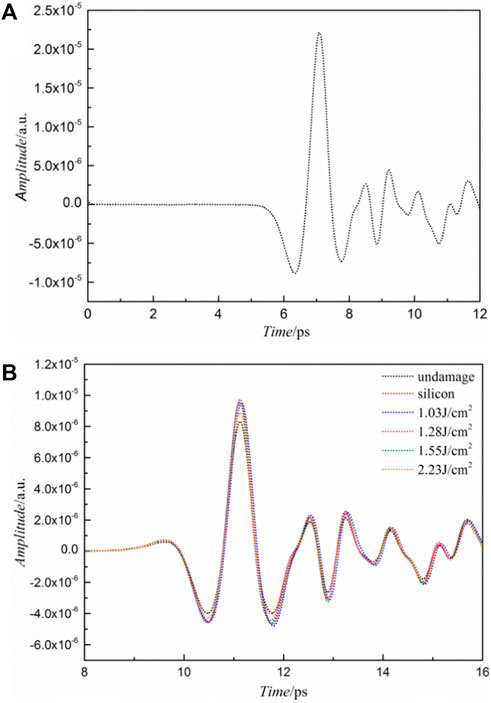
FIGURE 5. THz time-domain waveform. (A) Reference signal; (B) time-domain waveform of the Si substrate and the undamaged and damaged areas with different energy densities for the ITO sample.
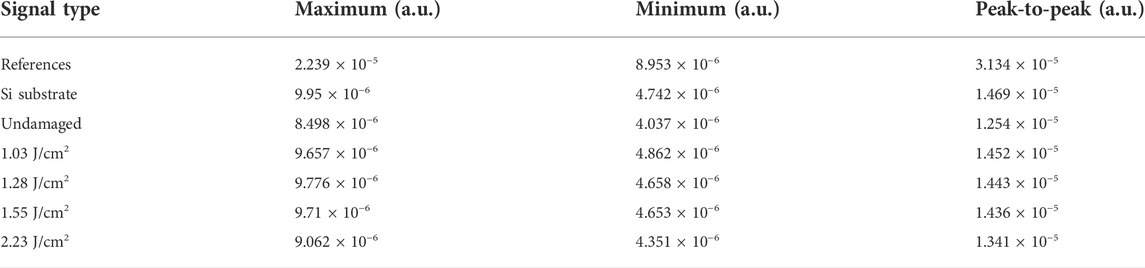
TABLE 1. Peak-to-peak value of the reference and Si substrate, and the damaged and undamaged areas of the ITO thin film sample from the the time-domain waveform.
The results are shown in Figure 6. The relationship between the peak-to-peak value and the roughness under different laser energy densities is shown in Figure 7. In Figures 6A–D, the roughness was 23.6, 28.9, 55.4, and 83.4 nm, respectively, and the maximum damage depth was 54.6, 79, 386, and 402 nm, respectively; the latter two were larger than the thickness of the ITO thin film, and the maximum damage spot diameter was 1.32, 1.57, 1.68, and 2.02 mm, respectively. From Figure 6 and Figure 7, it was found that the peak-to-peak value of the damaged area was higher than that of the undamaged area because melting, vaporization, ablation, and stripping phenomena occurred in the damaged area, the roughness increased, reflection performance of the terahertz wave by the ITO thin film was weakened, and scattering and transmission performance were strengthened. With the increase in the laser energy density irradiating the ITO thin film, the surface roughness increased, the damage area expanded, and the damage extended from the ITO thin film to the substrate. When the terahertz wave was incident on the corresponding damage area, scattering was strengthened; the peak-to-peak values in the time domain were gradually decreased. As shown in Figure 8, all the acquired time-domain signals were treated with Fourier transform to obtain a terahertz spectral amplitude of 0.4–1.0 THz since measurement was carried out in the air environment; the obvious absorption peaks of water vapor are shown in the figure [20, 21]. As shown in Figure 8, the amplitude of the undamaged area was the smallest at each frequency compared with that of the damaged area because the ITO thin film with a high free carrier concentration and conductivity had a high reflectivity effect on the terahertz wave [22]. With the increase in the laser energy density, the amplitude in the frequency domain of the damage area gradually decreased at each frequency, and the smaller the laser energy density, relative to the undamaged area, the more obvious is the amplitude rise. This change trend is the same as that of the peak-to-peak value in the time domain; the main reason was that melting, ablation, vaporization, and resolidification phenomena occurred when the ITO thin film sample was irradiated by laser, and the damage was caused [23]. Compared with the undamaged area, the conductivity of the damaged thin film became poor and the transmittance to the terahertz wave increased, which increased the amplitude of the terahertz wave passing through the damaged area at each frequency [24]. When the laser energy density increased, the damage area enlarged, the damage extended from the surface to the interior, and the damage depth had reached the silicon substrate; the absorption and scattering of the terahertz wave with different frequencies were gradually intensified [25], and the amplitude of the terahertz wave penetrating through the damaged area gradually decreased.
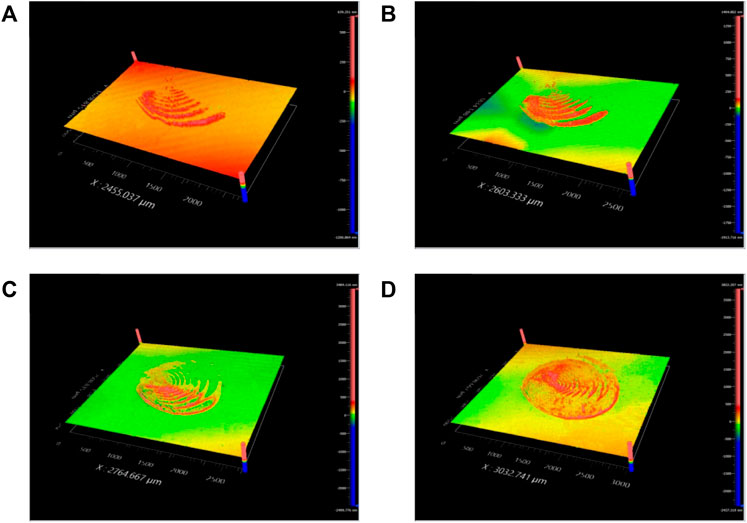
FIGURE 6. Damage profile of the ITO thin film sample irradiated by laser with different laser energy densities: (A) 1.03 J/cm2, (B) 1.28 J/cm2, (C) 1.55 J/cm2, and (D) 2.23 J/cm2.
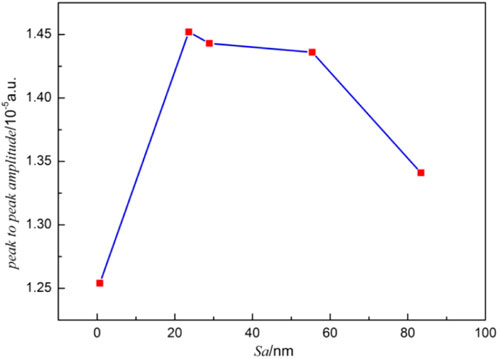
FIGURE 7. Relationship of roughness and the peak-to-peak value in the time domain with different energy levels for the ITO sample.
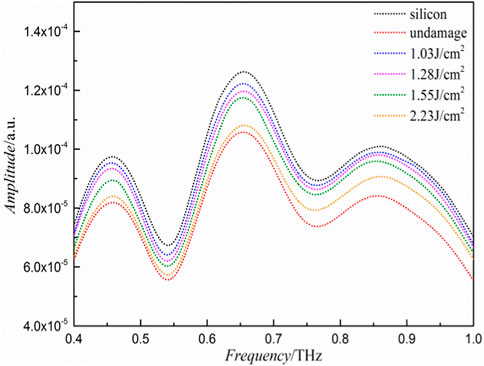
FIGURE 8. Amplitude in frequency of the ITO thin film sample.
According to Eqs 16, 18, the refractive index spectrum and absorption coefficient spectrum of the undamaged area and the damaged area induced by laser with different laser energy densities were calculated, as shown in Figure 9 and Figure 10. Since the substrate of the ITO thin film sample was damaged when the laser energy density was 1.55 and 2.23 J/cm2, a part of the ITO thin film was fallen off and melting, vaporization, ablation, and material splash phenomena occurred, which caused the ITO thin film to not exist in some parts of the damaged area, and the ITO thin film existing in other parts may include silicon composition. Eqs 16, 18 are not applicable under these conditions. The refractive index and absorption coefficient of these two samples were not calculated.
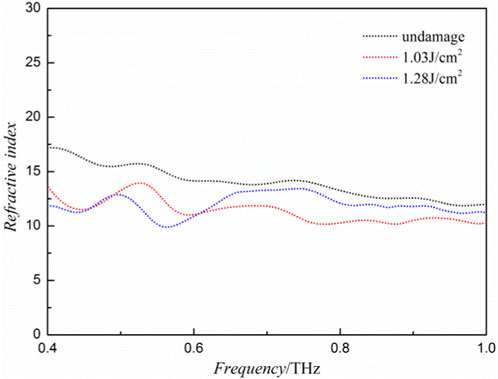
FIGURE 9. Refractive index of the ITO thin film sample.
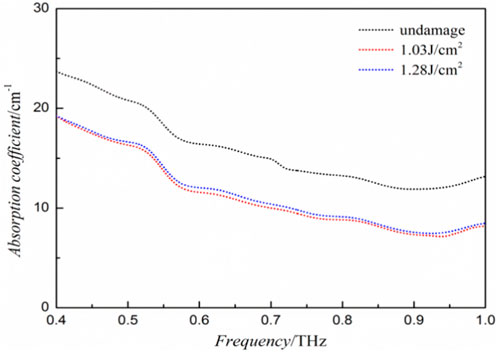
FIGURE 10. Absorption coefficient of the ITO thin film sample.
As shown in Figure 9, the refractive index of the ITO thin film deposited on a silicon substrate was between 15 and 17 in the range of 0.4–1.0 THz, and it decreased with the increase in the frequency. According to Drude theory, its infrared performance could be studied in the light of a metal-like substance [26], so its refractive index was very high. The refractive index of the damaged area was different from that of the undamaged area, and since it was related to the structure and the concentration of carriers of the thin film, it could be expressed as [27].
where
When the ITO thin film sample was damaged by the way of laser irradiation, there were hole defects in the thin film structure, the structure became loose [28], and the carrier concentration increased, which led to the decrease in the refractive index.
As shown in Figure 10, within the frequency of 0.4–1.0 THz, the absorption coefficients in both the undamaged area and damaged area of the ITO thin film sample decreased with the increase in the frequency, and due to the absorption of the THz wave by water vapor in the air, there were slight fluctuations in the curves [20, 21]. The absorption coefficient of the undamaged area was larger than that of the damaged area at each frequency because the ITO thin film had strong reflection to the THz wave; when the film is damaged, the reflection decreased and transmission increased to result in the decrease of the absorption coefficient. With the increase in the laser energy density, the absorption coefficient gradually increased at each frequency because the scattering and absorption of the terahertz wave by the damaged area were gradually strengthened, and this variation trend was opposite to that of the amplitude spectrum in Figure 8. On the other hand, the change in the absorption coefficient of the ITO thin film damaged by laser also represented the change in the microstructure and characteristics, the band gap of the damaged area became smaller, more absorption bands appeared, more oxygen vacancies were formed, and rapid heating and solidification resulted in the reduction of tin oxide [24, 25].
The transmission terahertz time-domain system was used to measure the undamaged and the damaged areas of the ITO thin film deposited on a silicon substrate induced by laser with different energies, the time-domain waveform, and the spectral amplitude. The refractive index spectrum and absorption coefficient spectrum in the range of 0.4–1.0 THz were obtained. It was found that the peak-to-peak values in the time domain and spectral amplitude of the damaged area were significantly higher than those of the undamaged area, and with the increase in the laser-induced energy, they gradually decreased. The absorption coefficient and refractive index of the damaged sample with the undamaged substrate were lower than those of the undamaged sample. It showed that terahertz time-domain spectroscopy is an effective tool for testing the damage of the ITO thin film element induced by laser, and the damage could be identified by comparing the terahertz spectral changes of the damaged and undamaged areas.
The original contributions presented in the study are included in the article/Supplementary material. Further inquiries can be directed to the corresponding author.
XS, WS, and JS contributed to the conception and design of the study; XS and CD performed the calculations; CD organized the database; XS wrote the first draft of the manuscript; WS and JS contributed to manuscript revision and supervision. All authors have read and agreed to the submitted version.
This research was supported by the National Key Research and Development program of the Ministry of Science and Technology of China (2017YFA0701005), the National Natural Science Foundation of China (61427814 and 61575161), the key scientific research plan project of Education Department of Shaanxi Provincial government (18JS046), and the National Science Key Laboratory Fund project (6142602200407 and WDYX21614260204).
The authors declare that the research was conducted in the absence of any commercial or financial relationships that could be construed as a potential conflict of interest.
All claims expressed in this article are solely those of the authors and do not necessarily represent those of their affiliated organizations, or those of the publisher, the editors, and the reviewers. Any product that may be evaluated in this article, or claim that may be made by its manufacturer, is not guaranteed or endorsed by the publisher.
1. Su JH, Wang KK, Liang HF. Acoustic detection method of optical thin film damage based on frequency characteristics. High Power Laser Part Beams (2014) 26:071004. doi:10.3788/hplpb20142607.71004
2. Grischkowsky D, Keiding S, Exter M, Fattinger C. Far-infrared time-domain spectroscopy with terahertz beams of dielectrics and semiconductors. J Opt Soc Am B (1990) 7:2006–15. doi:10.1364/JOSAB.7.002006
3. Naftaly M, Miles RE. Terahertz time-domain spectroscopy for material characterization. Proc IEEE (2007) 95:1658–65. doi:10.1109/JPROC.2007.898835
4. Yan ZJ, Shi W, Hou L, Xu M, Yang L, Dong C, et al. Investigation of aging effects in cross-linked polyethylene insulated cable using terahertz waves. Mater Res Express (2017) 4:015304. doi:10.1088/2053-1591/aa5237
5. Jiang Z, Li M, Zhang XC. Dielectric constant measurement of thin films by differential time-domain spectroscopy. Appl Phys Lett (2000) 76:3221–3. doi:10.1063/1.126587
6. Stoik C, Bohn D, Blackshire JL. Nondestructive evaluation of aircraft composites using transmissive terahertz time domain spectroscopy. Opt Express (2008) 16:17039–51. doi:10.1364/OE.16.017039
7. Ospald F, Zouaghi W, Beigang R, Matheis C, Jonuscheit J, Recur B, et al. Aeronautics composite material inspection with a terahertz time-domain spectroscopy system. Opt Eng (2014) 53:031208–28. doi:10.1117/1.OE.53.3.031208
8. Liao XL, Wang Q. Nondestructive inspection of carbon fiber composite materials based on THz - TDS. Laser &Infrared. (2015) 45:1255–60.
9. Guo X D, Wang Q, Gu XH, Chen XA, Fan XW. Analysis of terahertz spectroscopic inspection experiment for glass fiber composite material defects. Infrared Technol (2015) 37:764–8.
10. Malinowski PH, Ostachowicz WM, Touchard F, Boustie M, Chocinski-Arnault L, Gonzalez PP, et al. Study of plant fibre composites with damage induced by laser and mechanical impacts. Composites B: Eng (2018) 152:209–19. doi:10.1016/j.compositesb.2018.07.004
11. Zhou DX, Parrott EPJ, Paul DJ, Zeitler JA. Determination of complex refractive index of thin metal films from terahertz time-domain spectroscopy. J Appl Phys (2008) 104:053110. doi:10.1063/1.2970161
12. Ma GH, Li D, Ma H, Shen J, Wu C, Ge J, et al. Carrier concentration dependence of terahertz transmission on conducting ZnO films. Appl Phys Lett (2008) 93:211101. doi:10.1063/1.3036708
13. Ma FY, Chi Q, Su JP, Du YL, Zhang WW, Chen M, et al. Study on the optical properties of ultra-thin metal films in the THz band. Spectrosc Spectral Anal (2012) 32:610–3. doi:10.3964/j.issn.1000-0593(2012)03-0610-04
14. Chen SG, Hou L, Lou X, et al. Investigation of terahertz continuous wave imaging and pulse wave imaging. J Xi'an Univ Technol (2013) 29:127–32.
15. Mickan SP, Abbott D, Munch J, Zhang XC. Noise reduction in terahertz thin film measurements using a double modulated differential technique. Fluct Noise Lett (2002) 2:13–28. doi:10.1142/S0219477502000609
16. Dorney TD, Baraniuk RG, Mittleman DM. Material parameter estimation with terahertz time-domain spectroscopy. J Opt Soc Am A (2001) 18:1562–71. doi:10.1364/JOSAA.18.001562
17. Li Z, Lian FY. Research on scattering in the THz quantitative analysis. Spectrosc Spectral Anal (2016) 36:1666–9. doi:10.3964/j.issn.1000-0593(2016)06-1666-04
18. Yan F. Scattering effects in THz-TDS transmission measurements of solid state samples. Master’s thesis. Beijing: University of Science and Technology (2016).
19. ZaytsevI KI, Tsapenko KP, Nosov PA, Yurchenko SO. An impact of multiple wave reflections in a flat sample on material parameter reconstruction using THz pulsed spectroscopy. J Phys : Conf Ser (2015) 584:012005–6. doi:10.1088/1742-6596/584/1/012005
20. Zhou X, Deng H, Lou ZF, Wang D. Study of transmission characteristics of water vapor based on terahertz time-domain spectroscopy. Infrared (2013) 34:20–4. doi:10.3969/j.issn.1672-8785.2013.06.04
21. Li J, Liu QC, Xiong L. Transmission characteristics of terahertz wave in water vapor transmitted 0.6 m. Laser Optoelectron Prog (2018) 55(9):090101. doi:10.3788/LOP55.090101
22. Chen YD, Zhu GS, Xu HR, Dong L, Jiang XP, Shi ZF, et al. Study on the IR properties of ITO with (400) preferred orientation prepared. J Funct Mater (2018) 49:0912709136–1. doi:10.3969/j.issn.1001-9731.2018.09.023
23. Yoo JH, Menor MG, Adams JJ, Raman RN, Lee JRI, Olson TY, et al. Laser damage mechanisms in conductive widegap semiconductor films. Opt Express (2016) 24:17616. doi:10.1364/OE.24.017616
24. Yoo JH, Andrew L, Jeff B, Elhadj S. Optical and electrical properties of indium tin oxide films near their laser damage threshold. Opt Mater Express (2017) 7:817–26. doi:10.1364/OME.7.000817
25. Szorenyi T, Laude D L, Bertoti I, Kantor Z, Geretovszky Z. Excimer laser processing of indium-tin-oxide films: An optical investigation. J Appl Phys (1995) 78:6211–9. doi:10.1063/1.360567
26. Chen YD. Preparation of ITO thin films and study on infrared stealth properties. Master’s thesis. Guilin: Guilin University of Electronic Technology (2018).
27. Li TL, Zhu YX, Xu C, Gao G, Shen GD. Influence of evaporation rate on optical constants of ITO deposited by e-beam evaporation. J Funct Mater (2009) 40:56–9. doi:10.1145/1651587.1651601
Keywords: terahertz spectrum, ITO thin film, laser-induced damage, absorption coefficient, refractive index, damage identification
Citation: Shang X, Shi W, Su J and Dong C (2022) Study on the laser-induced damage of thin films by terahertz time-domain spectroscopy. Front. Phys. 10:1046919. doi: 10.3389/fphy.2022.1046919
Received: 17 September 2022; Accepted: 12 October 2022;
Published: 28 October 2022.
Edited by:
Huabin Wang, Chongqing Institute of Green and Intelligent Technology (CAS), ChinaCopyright © 2022 Shang, Shi, Su and Dong. This is an open-access article distributed under the terms of the Creative Commons Attribution License (CC BY). The use, distribution or reproduction in other forums is permitted, provided the original author(s) and the copyright owner(s) are credited and that the original publication in this journal is cited, in accordance with accepted academic practice. No use, distribution or reproduction is permitted which does not comply with these terms.
*Correspondence: Wei Shi,c3dzaGlAbWFpbC54YXV0LmVkdS5jbg==
Disclaimer: All claims expressed in this article are solely those of the authors and do not necessarily represent those of their affiliated organizations, or those of the publisher, the editors and the reviewers. Any product that may be evaluated in this article or claim that may be made by its manufacturer is not guaranteed or endorsed by the publisher.
Research integrity at Frontiers
Learn more about the work of our research integrity team to safeguard the quality of each article we publish.