 Majid Layachi
 Laura Casas-Ferrer†
 Gladys Massiera
 Laura Casanellas
- Laboratoire Charles Coulomb (L2C), UMR 5221 CNRS-Université de Montpellier. Montpellier, France
Synthetic biomimetic prototissues with reduced complexity can facilitate the understanding of intricate biological processes, by allowing the role of specific physical or chemical mechanisms to be isolated. The aim of the present work is to provide a rheological description of vesicle prototissues as a biomimetic model for the flow of cellular tissues, which can be relevant for the mechanical comprehension of embryogenesis or tumor metastasis. Prototissue were obtained by the controlled assembly of Giant Unilamellar Vesicles (GUVs) mediated by the biotin-streptavidin pair, using a simple assembly protocol. Prototissues were mechanically probed in a “pipette-aspiration” inspired microfluidic chip, under controlled pressure conditions. A viscoelastic flow behavior was obtained which was well captured by a generalized Kelvin-Voigt fluid model, with inferred rheological parameters that did not show a significant dependence on the GUV-GUV adhesion strength. In addition, the flow of the vesicle prototissues exhibited a strain-stiffening behavior. Complementary flow velocimetry analysis revealed a decrease of prototissue effective permeability with the applied pressure, and enabled to identify vesicle spatial reorganizations taking place within the prototissue. Overall, our microfluidic setup makes possible the simultaneous characterization of the biomimetic prototissue at two different length scales, global and local, bridging the viscoelastic response of the overall prototissue with its structural changes between an ensemble of vesicles.
1 Introduction
Tissue flows take place in embryogenesis, tumor metastasis or wound healing. In gastrulation (an early stage of embryogenesis), living cells are able to collectively migrate and reshape extensively in an orchestrated fashion leading to morphologically distinct tissue domains [22, 36]. Alternatively, during metastasis, multicellular aggregates of circulating tumor cells (CTC clusters) can spread through the blood flow, squeezing through micron-sized blood vessels and disseminate the primary tumor to healthy organs [26]. Living tissues are thus constantly subjected to mechanical stresses, which can be cell-generated or result from the interaction with the surrounding environment [49]. The rheological properties of tissues determine the way they mechanically respond to such mechanical stimuli. The flows of living tissues are particularly complex, as intricate mechanical and chemical signal transduction processes are at play together with genetic regulation. In order to diminish their degree of complexity, reconstituted multicellular aggregates or cell monolayers have been employed as model living tissues [25]. In particular, in-vitro experiments of such models, performed in well-defined flow geometries and controlled-stress conditions, have enabled gaining insight into the rheological properties of tissues.
Mechanical properties of cellular aggregates have been reported in the literature using complementary experimental techniques. Mechanical tests in compression mode were performed by means of parallel plates [27, 46] or magnetic force tensiometers [47, 48] enabling to measure, from the aggregate shape relaxation, their surface tension and viscosity. Micropipette aspiration, which has been employed over decades in the literature to measure the mechanical properties of individual cells of several types (e.g. red blood cells [21] or fibroblasts [61]), has also been efficiently used to probe the rheology of multi-cellular aggregates [32, 35]. For example, micropipette aspiration experiments revealed a viscoelastic flow response of 3D murin-sarcoma-cell aggregates when subjected to an externally applied pressure difference [33, 34]. The aggregate deformation displayed fast elastic advancement at short times and a viscous phase at longer times, which could be modeled by a modified Maxwell model. This technique was also employed to test in vitro the rheological properties of Xenopus embryonic layers [37]. Mesoderm (constituted of soft and motile cells) displayed both a lower viscosity and elastic modulus compared to ectoderm (constituted of immotile cells with higher cortical stiffness and cell-cell adhesion), making noticeable the link between mechanical properties at cell and tissue scales. Alternatively, aspiration experiments have been recently performed in microfluidic confinement coupled to simultaneous microscopy imaging [64]. Microfluidics enables to easily change the dimensions of the channels as well as the flow geometry [59]. The authors determined the local viscoelastic properties of mouse-embryonic-cell aggregates, which were attributed to shape changes of individual cells and to cell-cell rearrangements.
In order to isolate solely the role of mechanics and disregard all active processes still occurring in cell aggregates, more reductionist model systems have been conceived, which we describe shortly in the following. Soap foams and adhesive emulsions, despite being inert, have been shown to be capable of reproducing some of the essential mechanical and morphological features of living tissues, as first reported by D’Arcy Thomson [31]. The millifluidic flow of 2D-soap foams has been extensively studied in the literature for contraction and Stokes flows [10, 16, 17]. Their rheological response could be captured by a visco-elasto-plastic (VEP) constitutive equation, which accounted for bubble deformation and 2D dynamic bubble rearrangements (T1 events). Adhesive oil-in-water emulsions, obtained with the introduction of non-specific (depletion-interaction) or specific adhesion sites, were probed in 2D microfluidic contraction flows. The authors reported a competition between droplet deformation and droplet rearrangements under flow [29, 30]. As the degree of adhesion was increased, droplet deformation was favored while rearrangements were hindered.
In this communication we will study the microfluidic flow of giant unilamellar vesicle (GUVs) prototissues as a model for cellular tissues. GUVs are constituted by a lipidic bilayer, which reproduces essential mechanical properties of living cells, but disregard any activity or complex signaling processes. In addition, cell cortex which confers elasticity [28] and provides an effective surface tension to cells [66], is absent in vesicles. GUVs are soft objects, with a membrane that can easily bend by thermal noise (with a bending modulus of about tenths of kBT and an equilibrium tension of vesicles of the order of
The possibility to selectively change the properties of vesicle prototissues also makes them suitable models for the study of clogging events. The flow of particulate suspension through a bottleneck may lead to its obstruction, when the size of the constriction is smaller or comparable to the particle diameter [14]. The size, shape and deformability of the individual particles strongly determine the chances for plug formation or plug removal [11, 14, 41]. This can be relevant in numerous medical or physiological situations involving flows at the microscopic scale. For example, injectable therapeutic protein solutions can assemble into aggregates of irregular shapes and sizes by blocking the needles during injection [18], and blood capillaries can be blocked by red blood cells or CTC clusters displaying anomalous rigidities or adhesive properties [4, 42, 57].
The microfluidic flow of individual GUVs has been extensively studied over the last decades, both theoretically and experimentally, partly with the goal of modelling the flow of red blood cells (RBC). Due to the high deformability of their membranes it exists a complex interplay between GUVs (or RBCs) and the external shear flow, leading to different flow regimes (tank-treading, vs tumbling or swinging) [2, 45, 67]. Microfluidics has been also used to probe the mechanical properties of GUVs, for instance by using optical tweezers or microfluidic aspiration [19, 68]. Although this literature is vast, the microfluidic flow of vesicle prototissues remains, to the best of our knowledge, still unexplored. In this work we present the first set of rheological experiments performed in microfluidic aspiration of vesicle prototissues, which allows us to get insight into their rheological properties and clogging capabilities. Using a microfluidic constriction of controlled size and by imposing a ramp of increasing aspiration pressures, we are capable of identifying the prototissue size range leading to partial clogging of the channel. In this regime, we measure the advancement of the prototissues inside the constriction in time and derive its elastic modulus, viscosity and relaxation times. This global description is complemented by a velocimetry analysis which allows us to detect structural reorganizations taking place at a local scale and enables to estimate the porosity of the prototissue in the clogging regime.
2 Materials and methods
2.1 Vesicles prototissue assembly
The prototissues used in this study were obtained by the controlled assembly of biotinylated lipid based Giant Unilamellar Vesicles (GUV) using Streptavidin (SA), a tetrameric bonding protein [8]. GUVs were synthesized by electroformation in a dedicated chamber consisting of two ITO glass slides (SigmaAldrich, 636916) facing each other with a 1 mm PDMS spacer. The slides were coated with 25 μl of the working lipid mix and left under vacuum for 90 min to evaporate the solvent. The mix was a 9:1 chloroform/methanol solution containing Egg-PC (SigmaAldrich, P3556), DSPE-PEG (2000)-Biotin (Avanti Polar Lipids, 880129P) at 2% and 4% molar fractions, and NBD-PE (Avanti Polar Lipids, 810144, green marker, λex = 460 nm, λem = 535 nm) at 1% molar fraction. After evaporation of the solvent, the chamber was mounted and filled with about 1 ml of filtered sucrose solution (SigmaAldrich, 616916) in Milli-Q water at 308 mOsm. Osmolarity was measured with an osmometer (Gonotec, OSMOMAT 3000) and adjusted with Milli-Q water. The chamber was then connected to a function generator applying an alternative tension between the two slides. The tension was gradually increased from 0.2 V to 1.2 V at 10 Hz for 2 h 15 min and finally decreased to 1 V at 4 Hz for 30 min to detach the vesicles from the slides. The electroformed vesicles were stored in a plastic tube at 4°C for a maximum of one week. The concentration of the vesicle suspension was quantified using microscopy and image analysis [8] and adjusted to work at a reference value of (1.5 ± 0.2) × 103 GUV μl−1, before every assembly experiment.
To assemble the vesicles into 3D aggregates (prototissues), we first concentrated the GUV suspension in order to increase the contact between the neighbouring GUVs, following the concentration method described in [8]. Next, the necessary amount of the Texas Red Streptavidin conjugate (Fisher Scientific, 100338002) was added to the vesicle solution to promote vesicle-vesicle bonding. For all vesicle prototissues we used a fixed ratio, X = 3, where X = nSA/nbiotin is the ratio of the number of molecules of Streptavidin in solution (nSA) to the total number of biotin molecules present on the outer leaflet of vesicle membranes (nbiotin) [8]. To keep GUVs in close contact with each other and favour the Biotin-Streptavidin bonding, the incubation step was carried out under centrifugation at 8 g for 2 h. The adhesion degree of the resulting prototissues was quantified by measuring the contact angle between adjacent outlying GUVs. For 2% and 4 %-biotin prototissues we obtained typical values of θ = (37 ± 14)° and θ = (59 ± 9)°, respectively. An example is shown in Figure 1A for both levels of adhesion. We will refer to them as 2% and 4 %-biotin prototissues in the following sections.
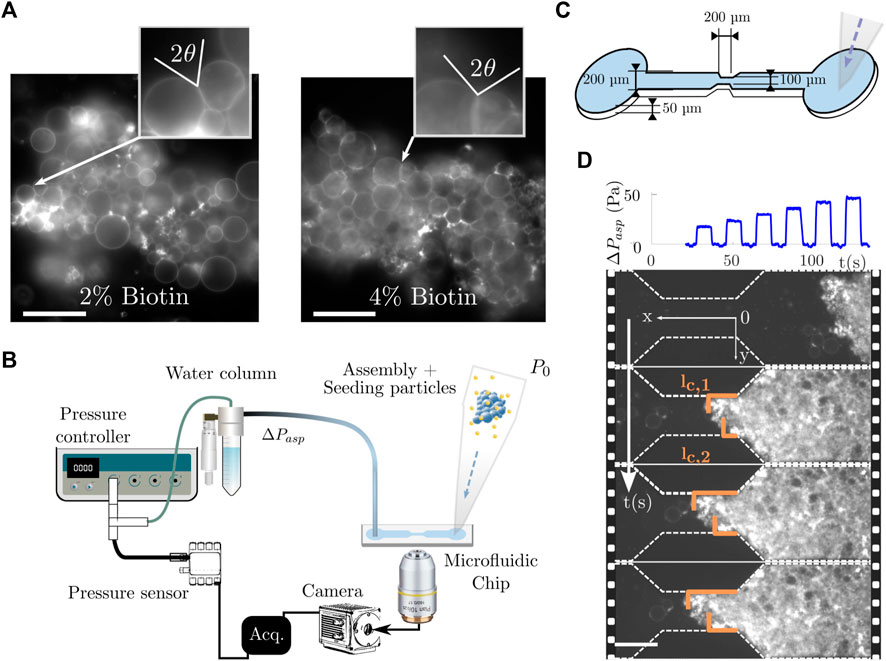
FIGURE 1. Microfluidic aspiration setup for prototissue rheology experiments. (A) Example of obtained prototissues after GUV assembly. Two different compositions were used: 2% and 4 %- biotin vesicles with a SA-to-biotin ratio of X = 3. They led to two different adhesion degrees, quantified by the contact angle θ between outer neighbouring GUVs as shown in the inset. Scale bar is 50 µm. (B) Microfluidic apparatus comprising an aspiration system, the microfluidic chip and the microscopy acquisition device. The prototissues were injected through the pipette cone (reservoir) in the right inlet of the microchannel and aspirated to the constriction where a 20x objective was used for fluorescence acquisition. (C) Sketch of the microfluidic chip used in the experiment (not to scale). The flow was created from right to left. (D) Example of image monitoring of the aspiration of prototissue in the microfluidic constriction with a series of pressure increasing steps. lc,1 and lc,2 are the contact lengths between the prototissue and the lateral constriction walls measured for each frame. The acquisition rate was 30 fps and simultaneous pressure measurements were performed. Scale bar 100 µm.
2.2 Microfluidic aspiration assay
2.2.1 Overview of the experiment
In order to study the mechanical properties of the synthesized vesicle prototissues, we developed a rheological set-up achieving tissue deformation in a microfluidic channel with a constriction (Figure 1B). Vesicle prototissues were introduced into the microfluidic chip by filling a pipette cone plugged onto the channel inlet with a buffer solution containing several prototissues. For sedimentation considerations, the buffer used in the microfluidic chip was a glucose solution at 315 mOsm. A negative pressure was applied to bring the prototissues, one by one, close to the channel constriction, so that they were visible within the field of view. When a prototissue was in the vicinity of the constriction, a sequence of increasing pressure steps was applied to generate the aspiration flow, and the advancement of the front of the prototissue inside the constriction (noted lc) was monitored using fluorescence microscopy. The monitoring was stopped when the prototissue exited the constriction. Each prototissue was subjected to only one aspiration sequence. A series of aspiration sequences were performed one after another, each with a different vesicle prototissue, to probe a sufficient number of them. The typical time for the aspiration assay was about two hours. In the S.I., we provide a video with an example of a prototissue being subjected to an aspiration sequence in the microfluidic channel.
2.2.2 Microfluidic apparatus
The microfluidic geometry consisted of a 200 µm wide channel leading to a (50 ± 2)µm or (100 ± 5)µm wide constriction. The decrease in width followed an angle of 45° to avoid strong re-circulation zones at the edges. The constriction was 200 µm long and was considered small compared to the total channel length (4 mm). All channels had a height of (50 ± 7 µm) (Figure 1C). Microchannels were fabricated by standard soft-lithography microfabrication techniques [59]. We mold the devices using polydimethylsiloxane (PDMS) and sealed it with a glass microscope slide using plasma bonding. Prior to all aspiration experiments, the channels were functionalized with a β-casein solution to reduce wall friction [39].
The flow inside the chip was generated by a pressure difference. A height-adjustable water column was connected to the outlet of the microfluidic chip to provide a positive pressure difference. In addition, the water column was connected to a pressure controller (Fluigent, MFCS-EZ) providing a negative pressure (with a resolution of 2 Pa). With the use of tracking micro-beads (Invitrogen, Molecular Probes), both the height of the water column and the pressure controller offset were adjusted to immobilize the beads inside the channel and thus to set the pressure to zero before starting any aspiration experiment. During the experiment, the pressure controller was programmed to generate a pressure stepped sequence using Fluigent’s Oxygen interface. In most of the described experiments, steps of 4 Pa where applied during 9 s from 0 Pa to 50 Pa. Occasionally, the pressure increments were set to 16 Pa to be able to reach pressures as high as 150 Pa. The applied pressure was measured using a pressure sensor (Honeywell, HSCDRRN001NDAA5) with a resolution of 0.5 Pa to double check the value provided by the pressure controller. Images were then captured at 30 fps with a CMOS camera (Hamamatsu, C13440 ORCA flash 4.0). Figure 1D shows an aspiration sequence (top) with the corresponding fluorescence images represented as a time lapse (bottom) for several steps in pressure. Note that the pressure sequence contained an initial negative kick (not visible in the top graph of Figure 1D, but visible in Figure 3A) used to ensure correct image-pressure synchronization. We will describe in the following the acquisition and analysis methods developed for the aspiration experiment.
2.3 Flow visualization and image analysis
2.3.1 Image acquisition
Phase contrast and fluorescence images were obtained using an inverted microscope (Leica, DMIRB) with a 20× magnification air objective (NA = 0.4). Fluorescence excitation was made using a white LED lamp (CoolLED, pE-300) coupled to fluorescence filters during a 15 ms exposure time. All images were captured at mid-height of the microfluidic constriction.The trigger out signal of the camera and the tension output of the pressure sensor were recorded at 1 kHz using a LabView virtual instrument through a Input/Output acquisition card (National Instruments, NI-USB 6210) which enabled to assign the corresponding pressure value to each individual frame.
2.3.2 Image analysis
2.3.2.1 Aggregate deformation
Fluorescence images of the vesicle prototissues obtained during the microfluidic aspiration assays were analysed using Ilastik’s pixel classification workflow [6]. The classifier was trained to identify the zones occupied by the prototissue (distinguishing this zones from the other parts of the channel or from the channel walls). Segmented images were then analyzed using a Matlab homemade routine to extract the contact length (lc) defined as the front of the prototissue in contact with the lateral constriction walls.The two values, noted lc,1 and lc,2 in Figure 1D for each wall, were averaged to get
2.3.2.2 Particle Image Velocimetry
In order to compute the velocity field of the prototissue and of the buffer inside the microchannel, the fluorescence of the vesicle membranes (provided by the fluorescent streptavidin molecules) or of the seeding particles present in the buffer was analyzed using PIVLab [60]. PIVlab performs Particle Image Velocimetry based on a multipass Fast Fourier Transform window deformation algorithm. The algorithm was run on contiguous interrogation windows covering the entire frame. The interrogation zones were squared and between 32 px and 128 px wide with a 50% overlap. To improve spatial accuracy, the algorithm was run over 2 to 3 passes with decreasing zone sizes (50%). The computed velocity field was filtered by applying global velocity and local standard deviation filters in order to eliminate outliers. The filtered vectors were eventually interpolated using a boundary value solver. Divergence and vorticity fields were computed after the velocity field based on finite differences. The obtained vector fields were then coupled to the segmentation masks obtained with Ilastik allowing us to discriminate between the vectors corresponding to the prototissue and the buffer flow.
3 Results and discussion
3.1 Constriction clogging and escape pressure
We first assessed the clogging behaviour of vesicle aggregates through the microfluidic channel constriction. In aspiration experiments, aggregates penetrated inside the constriction as the pressure was increased. The escape pressure (ΔPesc) was defined as the pressure necessary for the aggregate to exit the constriction (bottom image in Figure 2A). Aggregates of different sizes were probed. Note that most aggregates were confined in the vertical direction, as the mean diameter of the aggregates was typically larger than the channel height. Thus, the aggregate size was measured by fitting its 2D-projected area with an ellipse (top image in Figure 2A). This method enabled to smooth out contour irregularities and to take into account the global shape of the aggregate, which was well suited for our 2D analysis. In most cases, the applied flow inside the channel oriented the aggregates along the axis of the constriction. Thus, the minor axis of the ellipse was the effective cross section limiting the passage of the aggregate inside the constriction. Consequently, the length of the minor axis of the fitted ellipse was taken as the relevant aggregate size, wAggr. It was rescaled by the width of the constriction, wc, and noted w*.

FIGURE 2. Clogging behaviour of vesicle aggregates in the constriction. (A) Top: example of a vesicle aggregate entering the channel constriction. The aggregate size was set as the minor axis of the fitted ellipse (red). Bottom: example of an aggregate at the moment at which it exits the constriction. (B) Escape pressure as a function of the normalized aggregate size (w* = wAggr/wc). Squares and triangles correspond to 2% and 4 %-biotin aggregates, respectively. Black and gray colors refer to experiments performed in constrictions of width 50 µm and 100 µm respectively. The maximum value of w* is given by the ratio of the channel and the constriction widths. These values are indicated in the figure with dashed vertical lines. Error bars correspond to the standard deviation of the imposed pressure (upper bar) and to the step of the applied pressure (lower bar).
Figure 2B shows the plot of ΔPesc versus the re-scaled aggregate size, w*. The data were obtained for two degrees of adhesion (2% and 4% biotin, with X = 3). Additionally, we used two different constriction widths (50 µm and 100 µm) to test various combinations of w*. w* ≃ 1 corresponds to probed aggregates with sizes comparable to the constriction width. Clogging events for this typical sizes were scarce since aggregates flowed easily through the constriction. Thus, pressure values necessary to evacuate the aggregates from the constriction were small, ranging from ΔPesc = 2 Pa to 6 Pa. The figure shows that as the aggregate size increases, 1 ≤ w* ≤ 2, the pressure values increases and they become more scattered (ranging from ΔPesc ≃2 Pa to 25 Pa). A threshold occurs for w* ≃ 2 (with ΔPesc ≤ 40 Pa) above which the scatter is even more visible. Aggregates above this size got trapped by the constriction and required larger pressures to escape, up to 120 Pa. Moreover, changing the biotin content (shown in gray and black symbols in the figure), which accounts for different levels of GUV-GUV adhesion, did not significantly impact the behaviour of the escape pressure. Finally, note that in some occasions the aggregates approached the constriction with a slight tilt angle with respect to the flow direction (with a median value of ≃10° for all aspirated aggregates) and could thus change the effective cross section (an example is shown in the top panel in Figure 2A). However, taking into account this angle correction in the calculation of the aggregate cross-section did not significantly modify the overall behavior observed in Figure 2B nor the value of the threshold obtained at w* ≃ 2.
Clogging studies performed in the literature with protein aggregates in microfluidic confinement also revealed the importance of the size ratio between the aggregates and the constriction. The authors reported values of the size ratio for clogging and release around 1 to 3 [18], in the same range as those obtained here for vesicle prototissues. However, the pressure applied to achieve aggregate escape was one to three orders of magnitude higher that in our case. They also highlighted the importance of the protein aggregate deformability in the clogging process. Likewise, microfluidic experiments performed using model PDMS soft objects with controlled shapes showed a link between both the shape and the internal structure of the objects probed with their deformation capabilities in clogging dynamics [11]. Even if we can state from our results that the size of vesicle aggregates represents a key parameter for clogging and for the value of the escape pressure, an important scatter is visible in Figure 2B. This scatter could be partially explained by a variability in vesicle aggregates deformability and shape. On the one hand, spatial heterogeneity of vesicle-vesicle adhesion levels within the prototissues or vesicle polydispersity in size within each aggregate might lead to different levels of prototissue compaction (as discussed later in Section 3.2.3). On the other hand, irregularities in the shape of the aggregate contours might lead to different aggregate deformability. Thus, remarkably different flows and clogging responses can take place, even for aggregates displaying comparable sizes.
3.2 Prototissue viscoelastic response at the global scale
In this section, we characterize the rheological behaviour of aggregates with sizes at least two times larger than the channel constriction (w* ≳ 2). Due to their important sizes, we will refer to these aggregates in the following sections as vesicle prototissues. As discussed in Section 3.1, these aggregates were large enough to clog the microfluidic constriction and thus remained stuck in the constriction for several pressure steps, allowing us to quantify their rheological properties.
3.2.1 Creep tests
Figure 3A shows an example of an aspiration sequence (blue curve) with several steps of increasing pressure. Each aspiration sequence is constituted of several creep tests (a step of constant pressure is applied) and their corresponding relaxation tests (the pressure is set back to zero). Each pressure step was analyzed separately and the corresponding contact length, lc, (defined in Figure 1D and shown in orange in Figure 3A was used to evaluate the deformation (strain) γ of the prototissue in time as:
where lc (t0) was the initial value for each pressure step. The deformation was made dimensionless by the normalization to the width of the constriction, wc. Figure 3B and C show the strain curves for both the creep and relaxation phases, obtained from Figure 3A.

FIGURE 3. Example of an aspiration experiment and its data treatment. The probed prototissue was obtained with the assembly of 2%-biotin GUVs and had a size of w*∼2.1. (A) Applied aspiration sequence consisting of several pressure steps (ΔPasp, shown in blue) and the corresponding evolution of the contact length, lc (orange). The pressure sequence starts with a kick with negative pressure to ensure that the temporal correspondence between the pressure signal and the image acquisition was correct. After each positive (aspiration) step, a small negative pressure of 2 Pa was applied over 1.5 s to insure a complete relaxation of the prototissue before each pressure step was applied. (B) Time aligned strain curves γ(t) for each pressure step during the creep phases. The dashed lines show the best fit to the model (Eq. 2). The inset shows the diagram corresponding to the generalized Kelvin-Voigt fluid model. (C) Time aligned strain curves γ(t) after each pressure step during the relaxation phases. The dashed lines show the fitted model following Eq. 3. In (B) and (C), colors correspond to different pressure values.
Qualitatively, the strain curve shows an initial fast exponential increase (or decrease) when the pressure is applied (or set back to zero). This transient behavior is followed by a slower regime for which the strain increases linearly in time. This behaviour is characteristic of viscoelastic materials, which display an elastically dominated response at short times and a viscous one at longer times. One can also observe in the strain curve the occurrence of some discontinuities in the slope of the final steady state, that we call γ-jumps. These γ-jumps could be correlated with internal reorganizations of GUVs within the prototissue, therefore causing internal structural changes. In the following, the fitting of the data with a rheological model will be limited to the data points prior to these γ-jumps. They will nonetheless be discussed later in Section 3.3.2.
3.2.2 Generalized Kelvin-Voigt fluid model
Several models have been used in the literature to describe the viscoelastic behaviour of cell tissues or cell aggregates. Most of these models are phenomenological and are obtained by the association of storage and dissipation elements [27, 33]. A theoretical framework was introduced by Tlili et al. [63] which describes the tissue rheology by the addition of an intra-cell contribution and an inter-cell counterpart. The intra-cellular term can be modelled by a Kelvin-Voigt solid model to account for cells individual elasticity and viscosity. The inter-cellular part can be instead modelled by a dissipative dashpot to account for cell-cell rearrangements, which leads to an irreversible deformation (characteristic of liquid materials). Further elements can be added to take into account additional flow features such as plasticity (with the addition of a yielding term) or to account for active processes of living systems such cell division or apoptosis. The specific number of elements contained in the model (mainly springs and dash-pots) and their arrangement (association in series or parallel) depends on the specific biological system under study [63].
In this work, the strain curves obtained were fitted using a generalized Kelvin-Voigt fluid model. The model takes into account the association of a Kelvin-Voigt body with an extra dash-pot connected in series, as shown in the diagram of the inset of Figure 3B. The model comprises three elements (one spring and two dash-pots), which is the minimum number of elements necessary to reproduce the experimental trends obtained in the aspiration experiments (as described in the following). According to the framework proposed by Tlili et al. [63], the modified Kelvin-Voigt model includes an intra-GUV term and an inter-GUV one. The intra-GUV contribution is represented by the Kelvin-Voigt body, which contains an elastic and a dissipative term accounting for the elasticity and viscosity of GUV membranes. The intra-vesicle counterpart is modelled by a dissipative dashpot in series and encompasses the dissipation due to spatiotemporal reorganization of GUVs within the prototissue. Note that this model is equivalent to the Jeffrey model – which is in turn a generalized Maxwell model – which considers the association of a Maxwell fluid in parallel with an additional viscous dash-pot. The model is linear and includes the time derivative of
The viscosities of the two dash-pots are noted η1 and η2 and the elastic modulus of the spring, G. σ stands for the shear stress. The generalized Kelvin-Voigt model enables a more straightforward physical interpretation of each individual element in creep tests, as compared to the generalized Maxwell model. The spring of the Kelvin-Voigt body accounts for the elastic response at short times; the dash-pot in series provides the viscous response at long times. The vesicle prototissue did not display any instantaneous elastic response in the aspiration experiments; we can thus refer to the elasticity provided by the elastic spring as a retarded elasticity. The solution of the constitutive equation for a creep test reads [13, 44]:
where γ0 and
Here, γi is the initial strain, λ1 is the retardation time and γ∞ the unrecoverable strain, indicative of liquid-like behaviour. Eqs. 2 and 3 were fitted to the experimental curves obtained for both the creep and relaxation phases with satisfactory goodness (R2 ≥ 0.95 in Figure 3B,C, dashed gray lines). The fitting parameters obtained were used to compute the rheological parameters of the model.
It is worth noting that the constriction geometry used in this study creates an heterogeneous flow, with a shear and an extensional contribution (their relative contribution is spatially dependent with an extensional term that increases close to the constriction entry) [7, 51]. Flows with mixed kinematics are necessary to be able to discriminate between different rheological models in complex fluids, as shown for example for the visco-elasto-plastic flow of soap foams [9]. The rheological parameters that we derive hereafter are, thus, effective quantities. They do not correspond to a pure shear or extensional solicitation but to a combination of both. The effective elastic modulus (G) is related to the intercept and to the applied pressure as G ∼ΔPasp/γ0 [13, 44]. And the effective viscosity (η2) is determined from the slope at the steady regime and the applied pressure as
Figure 4A shows the plot of the effective elastic modulus G versus ΔPasp derived from the data in Figure 3. We obtain values ranging from 30 Pa to 80 Pa. The vesicles constituting the prototissues are under tension due to GUV-GUV adhesion. Membrane fluctuations are thus damped, resulting in a very weak contribution of the bending mode to the elastic deformation of the vesicles [19]. The stretching mode would mainly account for the elastic deformation of vesicles constituting the prototissues, observed under flow. Note that we cannot exclude the formation of pore formation on GUV membranes which can participate to their mechanical response [15, 40, 53–56]. Prototissues could be depicted as a complex network of individual vesicles under tension, arranged in series and/or in parallel, with an effective elastic modulus resulting from a superposition of their mechanical responses and GUV-GUV adhesion. The range of values obtained for the vesicle prototissue can be compared with the elastic modulus of cell aggregates that has been determined in the literature using similar microfluidic flow geometries or the micropipette aspiration technique. For different cell types (cancer or embryonic cells), the elastic modulus of cell aggregates was estimated between ∼100 Pa and 1000 Pa [33, 37, 64]. These values are considerably larger than the ones obtained here for vesicle prototissues, partly due to the presence of the cell acto-myosin cortex.
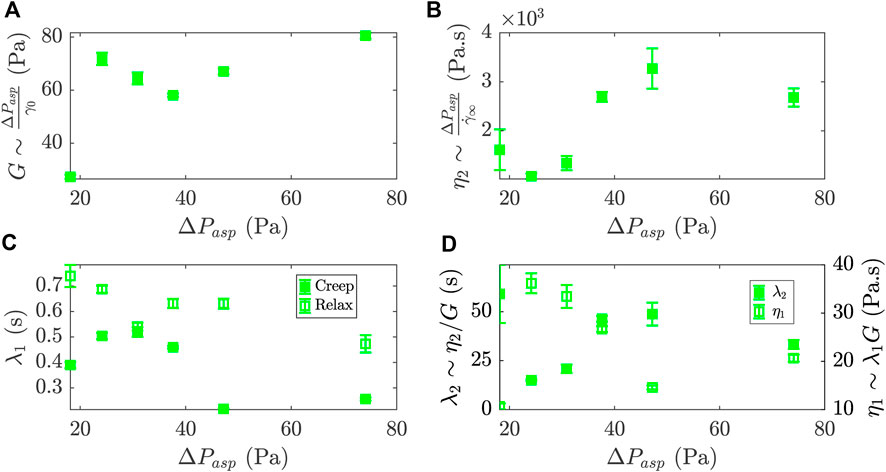
FIGURE 4. Rheological parameters of a 2 %-biotin prototissue deduced from the generalized Kelvin-Voigt fluid model and their evolution with the steps in aspiration pressure, ΔPasp. (A) Effective elastic modulus, G (B) Effective viscosity, η2. (C) Retardation times, λ1, for the creep and relaxation phases (full and empty symbols respectively). (D) Relaxation time, λ2, defined as the ratio η2/G and viscosity η1 defined as λ1G. Error bars were obtained by propagating the errors obtained over the fitting procedure.
The values of the effective viscosity η2 are plotted in Figure 4B. They range from 1×10³ Pa s to 4×10³ Pa s. These values were obtained with the assumption that the β-casein functionalization of the microfluidic chip greatly reduced the adhesion between the prototissue and the channel walls, so that the viscous dissipation within the prototissue was dominant [32, 39]. The viscosity of cellular aggregates was also evaluated in the literature and the values ranged within 5×10³ Pa s and 1×10⁵ Pa s [33, 37, 64]. Cell-cell interactions in a living cellular aggregate subjected to aspiration flows are far more complex than in the case of GUV-GUV passive-adhesion-based prototissues, as active mechano-sensing mechanism are at play.
Both measurements of the fitted retardation time λ1, for the creep and the relaxation phases, are represented in Figure 4C. They fall within the range 0.1 s to 1 s. These values are similar to the ones found in the literature for single GUVs subjected to stretching with optical tweezers [68]. This characteristic time describes the retardation time of the prototissue response after the step in pressure, which is introduced by the Kelvin-Voigt body in the model. According to the model Eqs. 2 and 3, the transients of the creep and relaxation phase should provide comparable values of the retardation times. Nonetheless, we observe in Figure 4C slightly larger values for the relaxation phase. The small disparity may be related to the occurrence of irreversible internal reorganizations of GUVs in the creep phases that could no longer relax when the aspiration pressure was released and that could explain a slow down of the dynamics in the relaxation phases [46].
The rheological parameters derived from the fitting parameters of Eq. 2 can be used to compute two complementary rheological parameters, λ2 and η1. Figure 4D shows the plot of these derived quantities vs ΔPasp. The relaxation time is obtained as λ2 = η2/G. This additional characteristic time is one to two orders of magnitude larger than the first retardation time (λ1), which was obtained directly from the fit. While the retardation time (λ1) is indicative of the short timescale for which the elastic behavior is dominant, λ2 describes the response at long time scales for which viscous dissipation dominates. The latter could thus be associated to inter-GUV dynamics such as GUV reorganization within the prototissue. Alternatively, an additional viscosity can also be derived as η1 = λ1G. Values are comprised between 10 Pa s and 40 Pa s, two to four orders of magnitude lower than the viscosity η2. In the model, this corresponds to the viscosity of the Kelvin-Voigt element. While η2 was related to the viscosity at the scale of the overall prototissue participating at long time scales, this significantly smaller viscosity η1 would account for the viscosity provided by GUVs and taking part at short time scales. As a comparison, typical values obtained in the literature for GUVs membranes are of the order of ∼Pa s [23, 43].
The values obtained for the rheological properties, as well as the number of independent rheological descriptors is, of course, model dependent. We have used here a generalized Kelvin-Voigt model describing a viscoelastic fluid-like behavior, with three independent rheological parameters (G, η2, λ1). Similar or more complex rheological viscoelastic models can be found in the literature to reproduce the flow behavior of living systems. For example, the rheological behavior of murin sarcoma cell aggregates, performed in pipette aspiration, was modeled with a modified Maxwell model with two spring constants and two dash-pots [33]. This model is slightly more complex than the one we introduce in Eq. 1, as it takes into account four independent parameters, instead of three. However, it can be simplified by considering the second spring with an infinite elastic constant. In such conditions, the 3-parameter model we propose here is recovered. Living cells have an active cortex, which can participate with a very fast elastic response at short times and can be represented by the additional spring body, that we do not observe in our vesicle prototissues.
Finally, in aspiration experiments, a pressure loss is experienced if the blockage of the channel by the prototissue is not complete due to geometrical constraints and due to the permeable structure of the prototissue, which leads to the presence of an interstitial flow (as it will be described in detail in Section 3.3.1). This implies that the true pressure in the channel constriction is thus smaller than the applied pressure (ΔPasp) [18]. Note however that the pressure drop computed from the ratio of the flow velocities of the buffer in the constriction with and without the prototissue is small, about 1%, and will thus be neglected in the following. A significant difference could introduce a correction in the calculation of the rheological properties (elastic modulus and viscosity η2), for which we used ΔPasp. Nevertheless, since the viscosity of the prototissue (obtained values range from 102 to 104 Pa s) is several orders of magnitude larger than the buffer viscosity (ηbuffer ≃ 10−3 Pa s), the aspiration force exerted on the aggregate as a shear stress from the interstitial fluid, due to its permeable structure, would still be negligible [35]. In-situ measurement within the microfluidic channel between the entry and exit of the constriction would enable to determine experimentally the value of this true pressure. Interestingly, its monitoring in real time could also be informative about any structural or mechanical changes occurring within the prototissue, as already used for example to detect the transient passage of soft objects inside a channel [1, 69].
3.2.3 Variability in the prototissue rheological response
In order to evaluate the variability of the rheological values of the vesicle prototissues, we performed aspiration experiments and applied the framework developed in the previous Section 3.2.1 to numerous prototissues of different sizes and degrees of internal adhesion. The prototissues tested had sizes comprised within 1.8 ≤ w* ≤ 3.1 and were composed of 2 or 4%-biotin GUVs. Figure 5 shows the effective rheological parameters obtained for nine different prototissues (green squares correspond to the values shown in Figure 4). We focus here on the elastic modulus G (5A), the viscosity η2 (5B), and the characteristic times λ1 (5C) and λ2 (5D). 2% and 4 %-biotin prototissues are represented with squared and triangular symbols, respectively. Globally, no clear trend emerges from the plots of Figure 5 to discriminate between the two degrees of adhesion used or between the different sizes of the prototissues. The elastic modulus spreads over a decade with values ranging approximately from 10 Pa to 100 Pa. The viscosity covers two decades from ≃ 102 to ≃ 104 Pa s. The retardation time λ1 varies from ≃ 0.1 to ≃1 s whereas the relaxation time (λ2) is comprised between ≃ 10 and ≃ 103s. All plots on Figure 5 show an important sample variability. For instance, prototissues with the same adhesion degree (4% biotin) and size (w* = 1.8, dark green and turquoise triangles) show different values of G (≃10 Pa and 50 Pa, respectively). Likewise, 2 %-biotin samples (with comparable sizes w* = 2.5, 2.6, red and black squares) can also display different G values, ≃25 Pa and 45 Pa, respectively. Concomitantly, viscosity values for the aforementionned examples are in the same range for 4 %-biotin prototissues, at about η2 ≃ 103 Pa s, but differ by almost 1 decade for the 2 %-biotin prototissues. The values obtained for the retardation time λ1 displays a slightly lower scatter, with all values contained within one decade. Unsurprisingly, λ2 displays a larger scatter as it is a derived quantity obtained from G and η2. Besides, by comparing prototissues with different adhesion degrees but with similar sizes (e.g. light green squares with brown triangles), we see that they do not show a significant difference in the prototissue rheological response. In conclusion, even though significant differences in the vesicle outer contact angle are visible for 2% and 4 %-biotin prototissues at rest (as shown in Figure 1A), these two levels of adhesion may result in a too small difference of adhesion to be detected in the rheological signature of the prototissues.
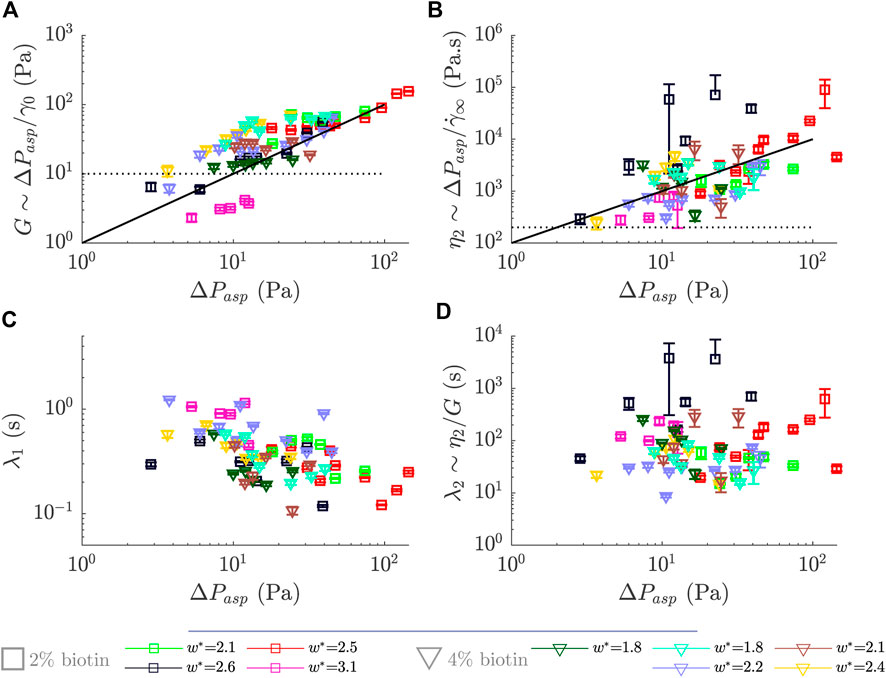
FIGURE 5. Rheological parameters obtained for different prototissues with different biotin compositions and sizes as a function of the applied steps in pressure, ΔPasp. (A) Effective elastic modulus, G (B) Effective viscosity, η2. (C) Retardation time, λ1. (D) Relaxation time defined as the ratio λ2∼ η2/G. Error bars were obtained by propagating the errors obtained over the fitting procedure.
The variability observed for prototissues with comparable adhesion and sizes could find explanation in different sources. First, prototissues prepared using the same biotin content may still display slight variations in the degrees of adhesion due to possible variations in their content in Streptavidin (SA). The vesicle assembly protocol relies on diffusion processes that can create heterogeneities in the distribution of SA and eventually lead to a variability in the degree of internal adhesion for different prototissues. The assembly protocol may also lead to spatial heterogeneities in adhesion within a given prototissue which may also generate differences in the flow behavior. Second, the GUVs used were synthesized via electroformation, a process allowing a high yield but providing a wide size distribution. This polydispersity of the vesicles constituting the prototissues may also be involved in the observed variability of the results. It has been shown that the microscopic structure of soft object participates to its deformability properties [11]. Thus, GUV polydispersity, which might lead to substantially different GUV-GUV spatial configuration within the prototissue, could impact its rheological response.
Despite the visible variability, global trends can be identified for the modulus and viscosity as a function of the applied pressure (no clear trends are visible for the retardation and relaxation times). The two black lines, solid and dashed, shown in the figure represent guides to the eye with slopes 1 and 0, respectively. Specifically, for the elastic modulus the curves display a tendency to increase with the applied pressure, with slopes comprised roughly between zero and one. This behaviour seems independent of the biotin composition. This increase in the modulus would imply a stiffening of vesicle prototissues under pressure. A stiffening behavior has been reported in the literature for individual cells, which is provided by the mechanical properties of their cytoskeleton network [28]. On the other hand, in adhesive oil-in-water emulsions the stiffening behavior appears as a consequence of an enhanced droplet-droplet adhesion [29]. For the case of vesicle prototissues, stiffening may also be originated by a change on the spatial arrangement of vesicles. In particular, an increase of prototissue cohesiveness may probably lead to a less deformable prototissue, and thus to a stiffer response at short time scales. A general increase is also observed for the viscosity (η2) for increasing applied pressures, with a slope also comprised roughly between zero and one. This would correspond to a shear-thickening behavior of vesicle prototissues. We have attributed this viscosity in previous Section 3.2.1 to events taking place at long time scales, such as rearrangements between vesicles. A possible increase in cohesiveness as the applied pressure is increased, as mentioned earlier, would be accompanied by a decrease in the rate of vesicle rearrangements within the prototissue, therefor leading to an increase of the viscosity at the prototissue scale. In adhesive emulsions larger droplet-droplet adhesion lead to a slow down of the dynamics of droplet rearrangements [29, 30]. Similarly, an increase of cell-cell adhesion in living tissues generated an increase of the energy barrier to access to irreversible plastic events and thus a consequent slowing down of the reorganization rate [46, 49]. Note however that for the case of vesicle prototissues we are not able to detect any change in the rate of vesicle reorganizations in the analysis performed in next Section 3.3.2. In the present Section 3.2.1, we have addressed the flow behaviour at the scale of the overall prototissue (global scale). In the following section, we will deepen the analysis to get an insight into a local scale, i.e. of several vesicles.
3.3 Prototissue flow behaviour at the local scale
In order to probe the flow response of the prototissues at the local scale, we performed velocimetry analysis. Using the PIV technique, we computed both the velocity fields of the prototissue and of the buffer. In Section 3.3.1, the velocity field of the buffer is used in particular to evaluate the permeability of the channel plugged by the prototissue. In Section 3.3.2, we use the velocimetric data to identify vesicle reorganizations.
3.3.1 Prototissue permeability
We measured the permeability of the prototissue with the goal of determining its clogging properties in the microfluidic constriction, and its evolution with the applied pressure. Besides, permeability measurements can provide us additional information on the inner structural properties of the prototissue, as we will discuss later on. In Figure 6A we show an example of the velocity field obtained in the channel constriction both for the prototissue (red arrows) and the outer buffer (black arrows). The velocity field of the buffer was determined only in the channel region that was not occupied by the prototissue. Both fields were essentially invariant along the channel axis (x coordinate), far from the prototissue edge. At the interface between the prototissue and the buffer we observed a change in velocity, which is precisely a consequence of the permeability of the prototissue that we want to compute here. We restricted the velocimetry analysis to the frames for which the prototissue flow was in the steady regime (as described in Section 3.2.1). In this regime, we could average in time and improve the signal-to-noise ratio. In Figure 6B, we show an example of the velocity profiles obtained for each applied pressure after averaging both along the x coordinate and in time, for one aspiration experiment. A Poiseuille-like profile is obtained for the buffer. Due to the density of seeding particles and the magnification used, spatial resolution was limited in the vicinity of the channel walls, preventing us from evaluating the non-slip condition at the channel boundaries (
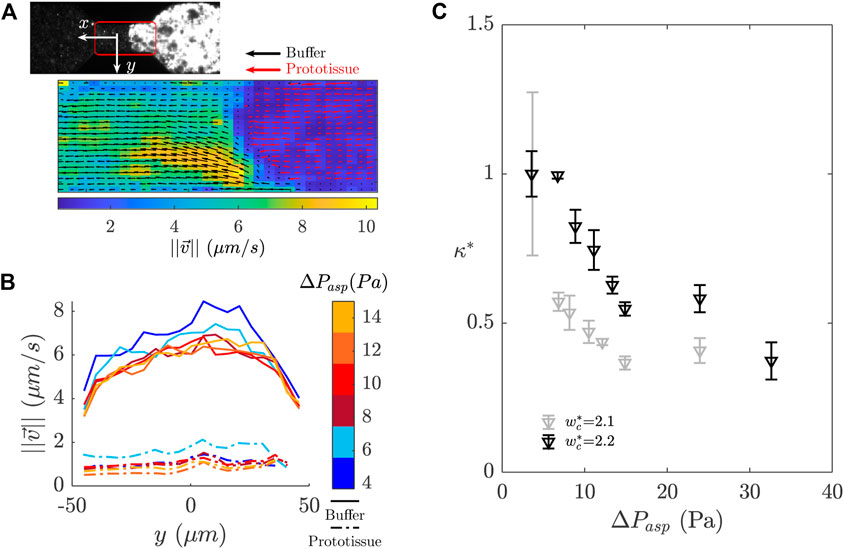
FIGURE 6. Particle image velocimetry (PIV) analysis performed in the microfluidic constriction during the prototissue aspiration sequence. (A) Definition of the region of interest for PIV analysis (175 µm×100 µm area). The colormap corresponds to the velocity magnitude. The red and black arrows show the velocity vectors of the prototissue and the buffer respectively in different scales. (B) Velocity profile along the y axis (orthogonal to the flow direction). The velocity profiles were averaged in time over the steady state regime and along the x axis (for both the prototissue and the buffer). The colormap represents the corresponding pressure values. (C) Plot of the relative permeability κ* as a function of ΔPasp for prototissues with 4 %- biotin vesicles.
The permeability κ establishes the link between the applied pressure ΔPasp and the measured velocity of a background liquid (vbg) with a viscosity (η) flowing through a porous medium of a given thickness (l) as,
For the case of the prototissue, we took η as the viscosity of the buffer (ηb ≃1 mPa s). The background velocity was defined in our case as the difference between the buffer velocity and the velocity of the prototissue,
In Figure 6C we show two examples obtained for κ* as a function of the applied pressure for 4 %-biotin prototissues. The values obtained for κ using Eq.4 were of the order of 10−14 m2. We should note this estimate corresponds to a lower limit, as these values are likely to be higher by accounting for the entire size of the prototissues. For the sake of comparison, similar measurements were carried out on different systems such as protein or cancer cell aggregates yielding values of the order of 10–13 to 10–11 m2, respectively [18, 32, 65]. In Figure 6C, we can observe that the relative permeability κ* decreases monotonously by approximately 50% between the first and the last pressure steps, before the prototissues finally exited the constriction. A decrease of the permeability was reported in the literature for colloidal particles clogging a micro-channel [14]. This decrease in the first stages of clogging was related to particles accumulating in the pore and diminishing interstitial volume. Conversely, the measurements of permeability of cellular aggregates revealed increasing values with raising applied pressures, due to the internal fracture of aggregates [65]. The two prototissues corresponding to Figure 6C did not show fracture during the aspiration. We interpret the decrease as a possible result of an increase in prototissue compaction. Such increase could be reversible or not, depending on whether it corresponds to reorganisation of adhesion sites within the prototissue or just to deformable vesicles being pushed against each other thus decreasing the interstitial volume. These hypothesis could be corroborated in confocal imaging, for which the quantification of the interstitial voids would be attainable, upstream and downstream the constriction. This is out of the scope of the present study.
Overall, this flow analysis performed at the local scale shows that the evolution of the rheological parameters obtained at the global scale, namely a strain-stiffening behavior (Figure 5 in Section 3.2.3), can be correlated with the decrease of the prototissue permeability observed for increasing applied pressures, and be indicative of an increase of prototissue compaction.
3.3.2 Detection of local reorganization events
In the global analysis performed in Section 3.2.1, we observed discontinuities in the slope of the strain curve during aspiration of the prototissues inside the microfluidic constriction, that we named γ-jumps (Figure 3B and Figure 7A). We want to elucidate whether we can attribute these γ-jumps to prototissue structural changes occurring at the scale of individual vesicles, or a group of vesicles. For this, we computed the vorticity and divergence fields after the in-plane velocity field
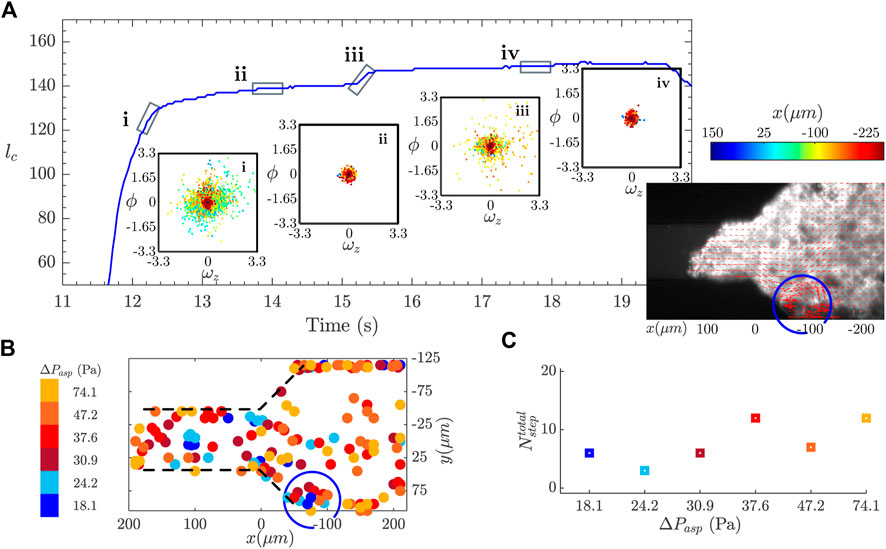
FIGURE 7. Detection of reorganization events during the creep experiment. (A) The blue curve shows the contact length, lc, as function of time, during one aspiration step. A γ-jump is visible on the curve at around 15.5 s. The graphs in the insets show the divergence, ϕ, versus the z-component of the vorticity, ωz, as a scatter plot, for different moments of the aspiration before and after the occurrence of the γ-jump. The color code refers to the position along the x axis (flow direction). The image in the inset shows the overlay of the fluorescence image with the vector representation of the velocity field obtained with the PIV algorithm for the prototissue. (B) Localization of reorganization events obtained for the prototissue shown in (A). Different colors correspond to the events obtained for different aspiration pressures. (C) Representation of the total number of events detected for each aspiration step.
Figure 7A shows the strain curve corresponding to a aspiration step (the entire aspiration sequence was constituted of six steps). This curve contains a γ-jump at around 15.5 s from the beginning of the experiment, and belongs to the steady flow regime. Scatter plots of the divergence (ϕ) versus the vorticity fields
Inspired by these observations, we propose a method capable of automatically identifying, and spatially locating within the channel, the occurrence of reorganization events taking place within the tissue, based on the measure of the divergence and vorticity fields. For this, we applied an arbitrary threshold on both ωz and ϕ such that they verified
From this analysis, we can assert that there exists a link between the reorganization events causing the γ-jumps observed in the strain curve and the peak in vorticity and divergence. This observation allows us to highlight the relation between the global scale of the prototissue with the local scale of several vesicles. Note, however, that this relation could not be always verified, partly due to experimental limitations of our experimental device. In some occasions γ-jumps observed in the strain signal found no correspondence with vesicle rearrangements and vice versa. Microscopy imaging was performed only at a given vertical position within the channel. Scanning microscopy would be required to be able to track vesicle reorganizations within all planes covering the entire depth of the prototissue. Inversely, some prototissue reorganizations visualized between a group of vesicles had no visible signature on the strain curve. We presume that only reorganizations above a given magnitude were susceptible to generate a measurable imprint on the strain signal.
Besides, we can follow the evolution of the number of detected events as a function of the applied pressure, as represented in Figure 7C with different colors. The number of detected events varies from 7 to 12 in each aspiration phase. Although the actual number of events is threshold dependent, this plots informs about their evolution with the applied pressure. Nevertheless, no clear trend is observed, implying that no significant variation in the reorganization rate within the prototissue seems to take place. As discussed earlier, it should be noted that the analysis performed here is for now restricted to epifluorescence images obtained for a given vertical plane of the prototissue. The analysis developed here should be applied to images obtained by scanning microscopy techniques, to be able to capture the reorganization dynamics in 3D. Further work is performed in our group in this direction.
Overall, we have proposed here a framework at a local scale, based on PIV-velocimetry analysis, that appears as a useful tool to quantify the impact of reorganization events taking place at the scale of a few vesicles on the rheological response measured at the scale of the entire prototissue. This image analysis method is well suited to analyse the occurrence of reorganizations events in the prototissue at the scale of several vesicles, as it can be applied to epifluorescence images displaying important vesicle polydispersity, not very sharp contours, and even variable levels of fluorescence. This analysis is intended to reveal the existence of local reorganizations, but it does not enable to discern between reorganizations of different possible topologies. Such reorganizations may correspond to in-plane spatial rearrangements between adjacent vesicles or group of vesicles. In particular, they could correspond to T1 events, for which an exchange of neighbouring vesicles would take place. Non-zero divergence could suggest the existence of out-of-plane vesicle-vesicle reorganization. The method presented here is less accurate than segmentation routines, specially developed for the analysis of epithelial tissue images, which are capable of tracking cell intercalation [20]. Note however that these type of images require reduced cell polydispersity and sharp cell contours to be treated.
4 Conclusions and perspectives
In this study, we have presented a rheological characterization of vesicle prototissues based on a microfluidic approach. Prototissues were aspirated in microfluidic chips containing a constriction, and their flow response was monitored in time using fluorescence microscopy and particle image velocimetry. This combination of means provided us information on both the global scale (of the overall prototissue) and the local scale (of several vesicles). We first determined the typical size for the prototissues required to achieve clogging of the microfluidic channel, which corresponded to approximately two times the size of the constriction. In such clogging conditions we performed creep and relaxation rheological tests, by applying increasing pressure steps, and we measured the prototissue deformation. Prototissues displayed a viscoelastic behaviour, which was well captured by a modified Kelvin-Voigt fluid model with three independent parameters: elastic modulus, viscosity and retardation time. The elastic modulus and viscosity displayed a mild strain-dependent behavior. Our flow results did not reveal any significant distinction between the two levels of GUV-GUV adhesion used for biotin concentration of the GUVs (with 2 or 4% biotin lipidic membranes), although morphological differences were visible at rest. As shown in our previous work [8] DNA driven assembly can provide larger ranges of GUV-GUV adhesion strength. In further works, we aim to probe prototissues with more severe differences in adhesion using DNA technology in order to elucidate if they can lead to a measurable disparity in their rheological behavior. The reported viscoelastic character of synthesized prototissues is comparable to that observed for cellular aggregates and tissues, which makes them a convenient biomimetic tissue in the mechanical study of cell tissues. However, the typical values obtained for the rheological parameters of vesicle prototissues are considerably smaller in magnitude.
We have developed, in parallel, a local-scale description based on a velocimetry analysis. By the determination of the velocity profile of the prototissue and the buffer we determined the permeability of system. A decrease in permeability was reported for increasing applied pressures, which might be attributed to an increase in the compaction of the prototissue. This compaction variation could be at the origin of the non-linear trends observed for the prototissue at the global scale. Besides, the image analysis method developed enabled the identification of reorganization events between several vesicles and their localization within the microfluidic channel, which could be linked, in turn, to the appearance of γ-jumps in the rheological response at the global scale. However, the method we have proposed here does not enable, at the present stage, to discriminate between different spatial topologies. The image analysis should be further developed in order to be able to determine and track the deformation of individual vesicles under flow, based for example on segmentation and tessellation methods [12, 29, 64].
The combination of the flow analysis across different length scales provides a comprehensive description of the mechanical properties of tissular systems [3, 49, 62]. Understanding the way tissues respond to mechanical forces by reshaping and flowing depending on their mechanical properties is crucial in complex biological processes [50, 58]. As featuring examples, in embryogenesis, in vitro experiments with Xenopus embryos revealed different levels of viscosity and elastic modulus for different tissues (ectoderm and mesoderm), and in vivo experiments with Zebra fish showed different rheological trends ranging from fluid to solid-like behaviors during the vertebrate body axis elongation [49]. Alternatively, the adhesive properties of cells have been shown to be crucial for the circulation of tumoral CTC clusters through blood capillaries [4].
Vesicle prototissues represent suitable biomimetic candidates to model the mechanical response of multicellular structures, as they reproduce essential viscoelastic features at different time scales. Vesicle prototissues offer the possibility to selectively tune their mechanical properties, such as their size, morphology or the degree of GUV-GUV adhesion. Besides, the possibility to characterize their flow behavior in microfluidic confinement with well-defined flow geometries enables to systematically test the role of such physical properties on the rheological signature of the prototissues, by the determination of their elastic modulus, viscosity, relaxation time and permeability.
Further complexification of the prototissues could be implemented progressively, with the aim of enhancing the resemblance with living tissues. In particular the encapsulation of an artificial cytoskeleton inside GUVs [5, 15, 38, 52] would presumably provide rheological parameters of the prototissues closer to those reported for multicellular spheroids. And most of all, the synthesis of active prototissues, which represents nowadays a benchmark in the scientific community, would enable to decipher the role of activity in the prototissue rheological fingerprint. Overall, vesicle prototissues represent a remarkable biomimetic model which can contribute in developing a quantitative approach to deepen the understanding of complex mechanics of multicellular systems.
Data availability statement
The raw data supporting the conclusion of this article will be made available by the authors, without undue reservation.
Author contributions
LC led the project. ML and LC-F performed experiments and data analysis. ML and LC wrote the first draft of the manuscript, and GM and LC-F reviewed and edited the manuscript. All authors contributed to scientific discussions of the results.
Funding
This project was supported by the Labex NUMEV (ANR-10-LABX-0020) within the I-Site MUSE and by Agence National de la Recherche (grant ANR-21-CE06-0023–01). The project has received additional funding from the Ecole Doctorale I2S (U. Montpellier).
Acknowledgments
We acknowledge the researchers from the SoftMatter team at L2C for fruitful discussion, specially R. Merindol, G. Poy, and D. Truzzolillo. We also thank for this S. Tlili, L. Pontani, K. Sengupta, A. Parmegianni, F. Graner, F. Fagotto, and G. Desgarceaux. We thank J. M. Fromental and C. Blanc at L2C for the help provided on the implementation of the pressure sensor and microfabrication.
Conflict of interest
The authors declare that the research was conducted in the absence of any commercial or financial relationships that could be construed as a potential conflict of interest.
Publisher’s note
All claims expressed in this article are solely those of the authors and do not necessarily represent those of their affiliated organizations, or those of the publisher, the editors and the reviewers. Any product that may be evaluated in this article, or claim that may be made by its manufacturer, is not guaranteed or endorsed by the publisher.
Supplementary material
The Supplementary Material for this article can be found online at: https://www.frontiersin.org/articles/10.3389/fphy.2022.1045502/full#supplementary-material
References
1. Abkarian M, Faivre M, Stone HA. High-speed microfluidic differential manometer for cellular-scale hydrodynamics. Proc Natl Acad Sci U S A (2006) 103:538–42. doi:10.1073/pnas.0507171102
2. Abkarian M, Viallat A. Dynamics of vesicles in a wall-bounded shear flow. Biophysical J (2005) 89:1055–66. doi:10.1529/biophysj.104.056036
3. Angelini TE, Hannezo E, Trepat X, Marquez M, Fredberg JJ, Weitz DA. Glass-like dynamics of collective cell migration. Proc Natl Acad Sci U S A (2011) 108:4714–9. doi:10.1073/pnas.1010059108
4. Au SH, Storey BD, Moore JC, Tang Q, Chen Y-L, Javaid S, et al. Clusters of circulating tumor cells traverse capillary-sized vessels. Proc Natl Acad Sci U S A (2016) 113:4947–52. doi:10.1073/pnas.1524448113
5. Bashirzadeh Y, Liu AP. Encapsulation of the cytoskeleton: Towards mimicking the mechanics of a cell. Soft Matter (2019) 15:8425–36. doi:10.1039/C9SM01669D
6. Berg S, Kutra D, Kroeger T, Straehle CN, Kausler BX, Haubold C, et al. ilastik: interactive machine learning for (bio)image analysis. Nat Methods (2019) 16:1226–32. doi:10.1038/s41592-019-0582-9
7. Binding D, Walters K. On the use of flow through a contraction in estimating the extensional viscosity of mobile polymer solutions. J Non-Newtonian Fluid Mech (1988) 30:233–50. doi:10.1016/0377-0257(88)85026-2
8. Casas-Ferrer L, Brisson A, Massiera G, Casanellas L. Design of vesicle prototissues as a model for cellular tissues. Soft Matter (2021) 17:5061–72. doi:10.1039/D1SM00336D
9. Cheddadi I, Saramito P, Graner F. Steady Couette flows of elastoviscoplastic fluids are nonunique. J Rheology (2012) 56:213–39. doi:10.1122/1.3675605
10. Cheddadi I, Saramito P, Dollet B, Raufaste C, Graner F. Understanding and predicting viscous, elastic, plastic flows. Eur Phys J E (2011) 34:1. doi:10.1140/epje/i2011-11001-4
11. Chen L, Wang KX, Doyle PS. Effect of internal architecture on microgel deformation in microfluidic constrictions. Soft Matter (2017) 13:1920–8. doi:10.1039/C6SM02674E
12. Clément R, Dehapiot B, Collinet C, Lecuit T, Lenne P-F. Viscoelastic dissipation stabilizes cell shape changes during tissue morphogenesis. Curr Biol (2017) 27:3132–42.e4. e4. doi:10.1016/j.cub.2017.09.005
13. Couarraze G, Grossiord J-L. Initiation à la rhéologie/G. Couarraze et J. L. Grossiord (Londres Paris New York: Tec. & doc.). In: 3e édition revue et augmentée edn (2000). DL 2000.
14. Delouche N, Schofield AB, Tabuteau H. Dynamics of progressive pore clogging by colloidal aggregates. Soft Matter (2020) 16:9899–907. doi:10.1039/D0SM01403F
15.Dimova R,, and Marques C, editors. The giant vesicle book. 1 edn. Boca Raton: CRC Press (2019). doi:10.1201/9781315152516
16. Dollet B. Local description of the two-dimensional flow of foam through a contraction. J Rheology (2010) 54:741–60. doi:10.1122/1.3380852
17. Dollet B, Graner F. Two-dimensional flow of foam around a circular obstacle: Local measurements of elasticity, plasticity and flow. J Fluid Mech (2007) 585:181–211. doi:10.1017/S0022112007006830
18. Duchêne C, Filipe V, Huille S, Lindner A. Clogging of microfluidic constrictions by monoclonal antibody aggregates: Role of aggregate shape and deformability. Soft Matter (2020) 16:921–8. doi:10.1039/C9SM01583C
19. Elias M, Dutoya A, Laborde A, Lecestre A, Montis C, Caselli L, et al. Microfluidic characterization of biomimetic membrane mechanics with an on-chip micropipette. Micro Nano Eng (2020) 8:100064. doi:10.1016/j.mne.2020.100064
20. Etournay R, Popović M, Merkel M, Nandi A, Blasse C, Aigouy B, et al. Interplay of cell dynamics and epithelial tension during morphogenesis of the Drosophila pupal wing. eLife (2015) 4:e07090. doi:10.7554/eLife.07090
21. Evans E. New membrane concept applied to the analysis of fluid shear- and micropipette-deformed red blood cells. Biophysical J (1973) 13:941–54. doi:10.1016/S0006-3495(73)86036-9
22. Fagotto F. The cellular basis of tissue separation. Development (2014) 141:3303–18. doi:10.1242/dev.090332
23. Faizi HA, Dimova R, Vlahovska PM. A vesicle microrheometer for high-throughput viscosity measurements of lipid and polymer membranes. Biophysical J (2022) 121:910–8. doi:10.1016/j.bpj.2022.02.015
24. Fenz SF, Sengupta K. Giant vesicles as cell models. Integr Biol (2012) 4:982–95. doi:10.1039/c2ib00188h
25. Folkman J, Hochberg M. Self-regulation of growth in three dimensions. J Exp Med (1973) 138:745–53. doi:10.1084/jem.138.4.745
26. Follain G, Herrmann D, Harlepp S, Hyenne V, Osmani N, Warren SC, et al. Fluids and their mechanics in tumour transit: Shaping metastasis. Nat Rev Cancer (2020) 20:107–24. doi:10.1038/s41568-019-0221-x
27. Forgacs G, Foty RA, Shafrir Y, Steinberg MS. Viscoelastic properties of living embryonic tissues: A quantitative study. Biophysical J (1998) 74:2227–34. doi:10.1016/S0006-3495(98)77932-9
28. Gardel ML, Kasza KE, Brangwynne CP, Liu J, Weitz DA. Chapter 19 mechanical response of cytoskeletal networks. In: Biophysical tools for biologists, volume two. In: In vivo techniques, 89. Academic Press (2008). p. 487–519. of Methods in Cell Biology. doi:10.1016/S0091-679X(08)00619-5
29. Golovkova I, Montel L, Pan F, Wandersman E, Prevost AM, Bertrand T, et al. Adhesion as a trigger of droplet polarization in flowing emulsions. Soft Matter (2021) 17:3820–8. doi:10.1039/D1SM00097G
30. Golovkova I, Montel L, Wandersman E, Bertrand T, Prevost AM, Pontani L-L. Depletion attraction impairs the plasticity of emulsions flowing in a constriction. Soft Matter (2020) 16:3294–302. doi:10.1039/C9SM02343G
31. Graner F, Riveline D. ‘The forms of tissues, or cell-aggregates’: D’Arcy thompson’s influence and its limits. Development (2017) 144:4226–37. doi:10.1242/dev.151233
32. Guevorkian K, Brochard-Wyart F, Gonzalez-Rodriguez D. In: I Pajic-Lijakovic, and EH Barriga, editors. Chapter eight - flow dynamics of 3D multicellular systems into capillaries. Academic Press (2021). p. 193–223. chap. 8. doi:10.1016/B978-0-12-820310-1.00008-2
33. Guevorkian K, Colbert M-J, Durth M, Dufour S, Brochard-Wyart F. Aspiration of biological viscoelastic drops. Phys Rev Lett (2010) 104:218101. doi:10.1103/PhysRevLett.104.218101
34. Guevorkian K, Gonzalez-Rodriguez D, Carlier C, Dufour S, Brochard-Wyart F. Mechanosensitive shivering of model tissues under controlled aspiration. Proc Natl Acad Sci U S A (2011) 108:13387–92. doi:10.1073/pnas.1105741108
35. Guevorkian K, Maître J-L. In: T Lecuit, editor. Micropipette aspiration: A unique tool for exploring cell and tissue mechanics in vivo, 139. Academic Press (2017). p. 187–201. of Methods in Cell Biology, chap. 10. doi:10.1016/bs.mcb.2016.11.012
36. Heisenberg C-P, Bellaïche Y. Forces in tissue morphogenesis and patterning. Cell (2013) 153:948–62. doi:10.1016/j.cell.2013.05.008
37. Kashkooli L, Rozema D, Espejo-Ramirez L, Lasko P, Fagotto F. Ectoderm to mesoderm transition by down-regulation of actomyosin contractility. Plos Biol (2021) 19:e3001060–33. doi:10.1371/journal.pbio.3001060
38. Keber FC, Loiseau E, Sanchez T, DeCamp SJ, Giomi L, Bowick MJ, et al. Topology and dynamics of active nematic vesicles. Science (2014) 345:1135–9. doi:10.1126/science.1254784
39. Lee S-J, Sohn Y-C, Kim C-L. Friction and wear characteristics of polydimethylsiloxane under water-based lubrication conditions. Materials (2022) 15:3262. doi:10.3390/ma15093262
40. Leomil FSC, Zoccoler M, Dimova R, Riske KA. PoET: Automated approach for measuring pore edge tension in giant unilamellar vesicles. Bioinformatics Adv (2021) 1. doi:10.1093/bioadv/vbab037
41. Lohaus J, Stockmeier F, Surray P, Lölsberg J, Wessling M. What are the microscopic events during membrane backwashing? J Membr Sci (2020) 602:117886. doi:10.1016/j.memsci.2020.117886
42. Loiseau E, Massiera G, Mendez S, Martinez P, Abkarian M. Microfluidic study of enhanced deposition of sickle cells at acute corners. Biophysical J (2015) 108:2623–32. doi:10.1016/j.bpj.2015.04.018
43. Mabrouk E, Cuvelier D, Pontani L-L, Xu B, Lévy D, Keller P, et al. Formation and material properties of giant liquid crystal polymersomes. Soft Matter (2009) 5:1870–8. doi:10.1039/B815817G
45. Mader MA, Vitkova V, Abkarian M, Viallat A, Podgorski T. Dynamics of viscous vesicles in shear flow. Eur Phys J E (2006) 19:389–97. doi:10.1140/epje/i2005-10058-x
46. Marmottant P, Mgharbel A, Käfer J, Audren B, Rieu J-P, Vial J-C, et al. The role of fluctuations and stress on the effective viscosity of cell aggregates. Proc Natl Acad Sci U S A (2009) 106:17271–5. doi:10.1073/pnas.0902085106
47. Mary G, Mazuel F, Nier V, Fage F, Nagle I, Devaud L, et al. All-in-one rheometry and nonlinear rheology of multicellular aggregates. Phys Rev E (2022) 105:054407. doi:10.1103/PhysRevE.105.054407
48. Mazuel F, Reffay M, Du V, Bacri J-C, Rieu J-P, Wilhelm C. Magnetic flattening of stem-cell spheroids indicates a size-dependent elastocapillary transition. Phys Rev Lett (2015) 114:098105. doi:10.1103/PhysRevLett.114.098105
49. Mongera A, Rowghanian P, Gustafson HJ, Shelton E, Kealhofer DA, Carn EK, et al. A fluid-to-solid jamming transition underlies vertebrate body axis elongation. Nature (2018) 561:401–5. doi:10.1038/s41586-018-0479-2
50. Oates AC, Gorfinkiel N, González-Gaitán M, Heisenberg C-P. Quantitative approaches in developmental biology. Nat Rev Genet (2009) 10:517–30. doi:10.1038/nrg2548
51. Oliveira MSN, Alves MA, Pinho FT, McKinley GH. Viscous flow through microfabricated hyperbolic contractions. Exp Fluids (2007) 43:437–51. doi:10.1007/s00348-007-0306-2
52. Pontani L-L, van der Gucht J, Salbreux G, Heuvingh J, Joanny J-F, Sykes C. Reconstitution of an actin cortex inside a liposome. Biophysical J (2009) 96:192–8. doi:10.1016/j.bpj.2008.09.029
53. Riske KA, Dimova R. Electro-deformation and poration of giant vesicles viewed with high temporal resolution. Biophysical J (2005) 88:1143–55. doi:10.1529/biophysj.104.050310
54. Rodriguez N, Cribier S, Pincet F. Transition from long- to short-lived transient pores in giant vesicles in an aqueous medium. Phys Rev E (2006) 74:061902. doi:10.1103/PhysRevE.74.061902
55. Ryham R, Berezovik I, Cohen F. Aqueous viscosity is the primary source of friction in lipidic pore dynamics. Biophysical J (2011) 101:2929–38. doi:10.1016/j.bpj.2011.11.009
56. Sandre O, Moreaux L, Brochard-Wyart F. Dynamics of transient pores in stretched vesicles. Proc Natl Acad Sci U S A (1999) 96:10591–6. doi:10.1073/pnas.96.19.10591
57. Shelby JP, White J, Ganesan K, Rathod PK, Chiu DT. A microfluidic model for single-cell capillary obstruction by Plasmodium falciparum-infected erythrocytes. Proc Natl Acad Sci U S A (2003) 100:14618–22. doi:10.1073/pnas.2433968100
58. Stooke-Vaughan GA, Campàs O. Physical control of tissue morphogenesis across scales. Curr Opin Genet Devdevelopmental Mechanisms, Patterning Evolution (2018) 51:111–9. doi:10.1016/j.gde.2018.09.002
60. Thielicke W, Sonntag R. Particle image velocimetry for matlab: Accuracy and enhanced algorithms in pivlab. J Open Res Softw (2021) 9:12. doi:10.5334/jors.334
61. Tinevez J-Y, Schulze U, Salbreux G, Roensch J, Joanny J-F, Paluch E. Role of cortical tension in bleb growth. Proc Natl Acad Sci U S A (2009) 106:18581–6. doi:10.1073/pnas.0903353106
62. Tlili S, Durande M, Gay C, Ladoux B, Graner F, Delanoë-Ayari H. Migrating epithelial monolayer flows like a Maxwell viscoelastic liquid. Phys Rev Lett (2020) 125:088102. doi:10.1103/PhysRevLett.125.088102
63. Tlili S, Gay C, Graner F, Marcq P, Molino F, Saramito P. Colloquium: Mechanical formalisms for tissue dynamics. Eur Phys J E (2015) 38:33. doi:10.1140/epje/i2015-15033-4
64. Tlili S, Graner F, Delanoë-Ayari H. A microfluidic platform to investigate the role of mechanical constraints on tissue reorganization. Development (2022) dev.200774. doi:10.1242/dev.200774
65. Tran QD, Marcos , Gonzalez-Rodriguez D. Permeability and viscoelastic fracture of a model tumor under interstitial flow. Soft Matter (2018) 14:6386–92. doi:10.1039/C8SM00844B
66. Turlier H, Maître J-L. Mechanics of tissue compaction. Semin Cel Dev Biol (2015) 47-48:110–7. doi:10.1016/j.semcdb.2015.08.001
67. Vlahovska PM, Podgorski T, Misbah C. Vesicles and red blood cells in flow: From individual dynamics to rheology. Comptes Rendus Physique (2009) 10:775–89. doi:10.1016/j.crhy.2009.10.001
68. Wu S-H, Sankhagowit S, Biswas R, Wu S, Povinelli ML, Malmstadt N. Viscoelastic deformation of lipid bilayer vesicles. Soft Matter (2015) 11:7385–91. doi:10.1039/C5SM01565K
Keywords: biomimetic prototissue, microfluidics, tissue rheology, GUV, adhesion, morphogenesis
Citation: Layachi M, Casas-Ferrer L, Massiera G and Casanellas L (2022) Rheology of vesicle prototissues: A microfluidic approach. Front. Phys. 10:1045502. doi: 10.3389/fphy.2022.1045502
Received: 15 September 2022; Accepted: 19 October 2022;
Published: 03 November 2022.
Edited by:
Pierre Joseph, Laboratoire d’analyse et d’architecture Des Systèmes, FranceReviewed by:
Karine Guevorkian, UMR168 Unite physico-chimie Curie, FranceAurora Hernandez-Machado, University of Barcelona, Spain
Copyright © 2022 Layachi, Casas-Ferrer, Massiera and Casanellas. This is an open-access article distributed under the terms of the Creative Commons Attribution License (CC BY). The use, distribution or reproduction in other forums is permitted, provided the original author(s) and the copyright owner(s) are credited and that the original publication in this journal is cited, in accordance with accepted academic practice. No use, distribution or reproduction is permitted which does not comply with these terms.
*Correspondence: Laura Casanellas, bGF1cmEuY2FzYW5lbGxhcy12aWxhZ2VsaXVAdW1vbnRwZWxsaWVyLmZy
†Present address: Laura Casas-Ferrer, School of Chemical and Biomolecular Engineering, Georgia Institute of Technology, Atlanta, GA, United States