 Qinran Yu
 Yixing Liao
94% of researchers rate our articles as excellent or good
Learn more about the work of our research integrity team to safeguard the quality of each article we publish.
Find out more
ORIGINAL RESEARCH article
Front. Phys., 22 November 2022
Sec. Medical Physics and Imaging
Volume 10 - 2022 | https://doi.org/10.3389/fphy.2022.1045192
This article is part of the Research TopicMicrowave-induced thermoacoustic imaging/Photoacoustic ImagingView all 10 articles
Image registration is crucial in the clinical application of photoacoustic tomography (PAT) for vascular growth monitoring. Aiming to find an optimized registration scheme for PAT vascular images acquired at different times and with varying imaging conditions, we compared and analyzed different commonly used intensity-based and feature-based automatic registration schemes. To further improve the registration performance, we proposed a new scheme that combines phase correlation with these commonly used intensity-based registration methods and compared their performances. The objective evaluation measures: peak signal-to-noise ratio (PSNR), structural similarity index metric (SSIM), root mean square error (RMSE), and quantitative visual perception (jump percentage P), as well as subjective evaluation using mean opinion score (MOS), were combined to evaluate the registration performance. Results show that the feature-based approaches in this study were not suitable for PAT image registration. And by adding phase correlation as rough registration, the overall registration performance was improved significantly. Among these methods, the proposed scheme of phase correlation combined with mean square error (MSE) similarity measure and regular-step-gradient-descent optimizer provides the best visual effect, accuracy, and efficiency in PAT vascular image registration.
Monitoring vascular growth is critical for tumor growth monitoring [1]. Traditional imaging modalities such as magnetic resonance imaging (MRI) [2–4], ultrasound (US) [5–10], computed tomography (CT) [11–14], etc. have been commonly applied to evaluate the structural and functional changes of tumors and surrounding blood vessels in clinical practice, but these methods usually involve contrast agents and suffer from low contrast or resolution. Photoacoustic imaging (PAI), as a new radiation-free and non-ionizing imaging modality, has been developing rapidly in recent years [15]. It utilizes the different light absorptions of tissues to provide unique optical contrasts. The different light absorption coefficients of hemoglobin and various tissue chromophores at different wavelengths give PAI unique advantages in structural and functional vascular imaging [16–22]. Numerous studies have proved the effectiveness of PAI in vasculature imaging [23–27], which can be used to visualize the development of single blood vessels around growing tumors, changes in blood oxygen concentration within tumors, and the depth growth of neovascularization areas [28–33]. Comparing and analyzing the changes of blood vessels around tumors at different stages, including neovascularization and irregular changes in vascular morphology, can offer essential knowledge for monitoring the development and treatment of the disease, and realizing early screening and postoperative evaluation of cancer [34–36].
To observe and compare the morphological and functional changes of vasculatures and tissue structures through the disease progression, images need to be collected at different times. Therefore, to identify the differences in these images, the first problem to be solved is image registration. Image registration as a basic task in medical image analysis is a process of matching the images of the same scene obtained at different times, from different viewpoints, or by different sensors [37]. Single-mode registration is often used to analyze changes in images taken at different imaging periods, such as surgical effect evaluation [38, 39] and tumor growth monitoring [40–42]. MRI usually requires the combination of T1 and T2 sequence images to obtain tissue structure information with different contrast [43]. In photoacoustic imaging, we often need to use different optical wavelengths and sensors with different center frequencies to obtain different structural and functional information of tissues [15]. Image registration is needed before the comparison of tissue changes. Thus, finding a good registration scheme for PAI images taken at different times and with different imaging conditions (e.g., with different optical wavelengths or transducer center frequencies) is necessary for comparative analysis of the changes in target tissues through disease progression.
At present, the registration studies involved in photoacoustic imaging are mostly about real-time registration or PAI image registration with other imaging modalities [44–48], and there is no comparative study on different registration schemes for PAI images taken at different times with different transducers and optical wavelengths. In this study, we tested different automatic registration schemes using four categories of image datasets collected under three optical wavelengths and two transducer center frequencies. In addition, a new scheme was proposed to further improve the registration performances. The results were evaluated and compared by combining subjective and objective evaluation measures. The proposed scheme provides efficient and accurate automatic image registration for PAT vascular imaging, which can be applied to the applications such as vascular change monitoring, early screening, and postoperative treatment evaluation using photoacoustic imaging.
A circular-scanning PAT system was used for imaging (See Figure 1). A fast-tuning OPO laser (Beijing ZK Laser Co.,Ltd.; wavelength range: 680–980 nm; repetition frequency: 100 Hz) was used as the excitation source. The light was coupled into a customized optical fiber bundle (CeramOptec GmbH) for light delivery. A digital delay pulse generator (Beijing ZK Laser Co.,Ltd.) sent triggers to laser and data acquisition simultaneously. The ultrasound transducer (ULSO TECH CO., LTD.; center frequency: 5MHz and 7.5 MHz) was mounted on a four-dimensional motion control module (Zolix Instruments Co., Ltd.) which consists of three linear stages and a rotator. The photoacoustic signals were detected by transducers, and then amplified and collected by a customized amplifier and automotive oscilloscopes (Picoscope 5000D). Degassed water was used as the coupling medium for PA waves. The system control interface is developed using Labview to realize the synchronized motor scanning and data acquisition. The image processing module developed using MATLAB includes image reconstrucion, processing, registration, data anaysis and other functions.
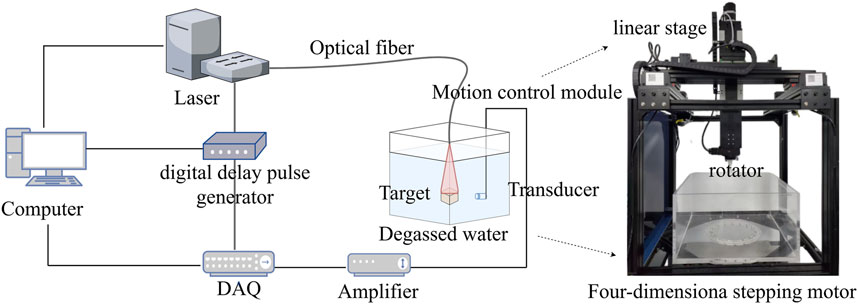
FIGURE 1. Schematics of the experimental system.
The workflow of image processing is shown in Figure 2. Firstly, the images were reconstructed using the delay and sum algorithm (DAS). Furthermore, to reduce the artifacts and background noises, preprocessing using bilateral filter and fuzzy C-means (FCM) was applied to achieve relatively clean background and extract target tissues. Finally, different registration schemes were applied to the PAT images, and the results were evaluated and compared by subjective visual evaluation (MOS) and objective evaluation measures (PSNR, SSIM, RMSE, jump percentage P).
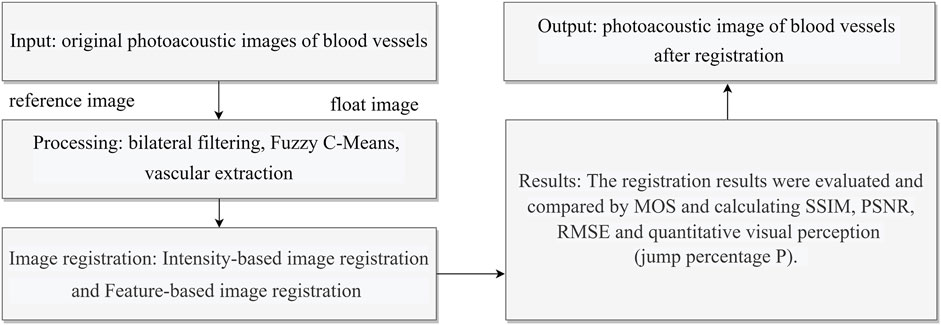
FIGURE 2. Flowchart of image processing.
The image data used in this study were all generated by the self-built PAT system. The backs of the volunteers’ hands were imaged. In the experiments, the hands were held firmly on the holder (at a certain angle) in the tank of degassed water and were completely submerged (see Figure 3). The relative angle and distance of the imaging area of the hand back to the transducer was measured and kept consistent for the same subject in different experiments. Laser pulses (under ANSI limit) are diffused and incident from the top so that the light uniformly covers the entire imaging area. The receiving direction of the transducer is perpendicular to the incident direction of the laser, and the target is scanned circularly. The position of laser incidence and the position of transducer reception are controlled and recorded by the four-dimensional motion module to ensure the consistency of the imaging conditions of the same target tissue. During the imaging process, the sampling rate was 62.5MHz, and the scanning step was 1° covering 180°. 5,000 data points were collected at each position and were averaged 20 times. For different sets of data, three different wavelengths (720°nm, 850°nm, and 960 nm) and transducers with different center frequencies (5°MHz and 7.5 MHz) were used for imaging. The experiments were approved by Chongqing medical university.
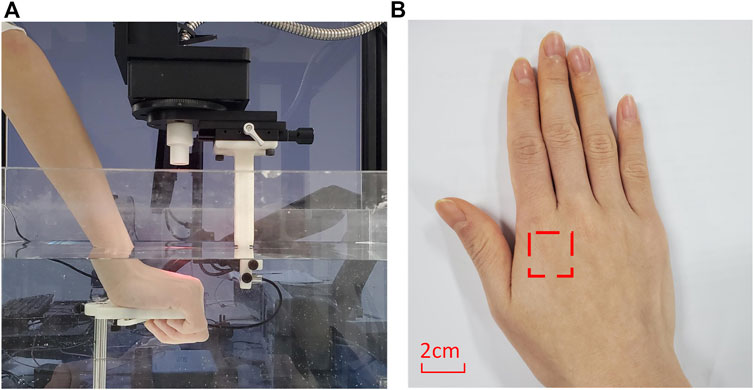
FIGURE 3. (A) is PAT imaging dataset acquisition experiment. (B) is a schematic diagram of imaging area of the hand.
Since the transducer we used was a flat unfocused single-crystal transducer with a large acceptance angle, and the signals from the same tissue could be received within a certain range. In addition, the blood vessels we imaged were superficial. Lights are uniformly irradiated, and one hand was held on the holder in a certain angle. Therefore, the problem caused by slight changes of projection angles at different times would not occur.
In order to verify the feasibility of the scheme, we carried out phantom experiments (See Figure 4). The silicone tubes (inner diameter 1.5 mm, wall thickness 0.5 mm) and Y-junction were used to simulate the vascular morphology in vivo, and Indian ink solution with light absorption coefficient of blood was circulated by a peristaltic pump to simulate the blood flow. Every time the transducer completed a circular scanning, it moved down 1 mm for another scanning, and it moved down five 5 mm in total. The results showed the morphology of the tubes clearly, and there was no significant difference among the five tomographic images. In addition, to verify the change of 2D projection caused by the change of detection angle, we tilted the phantom 15°, which was much larger than the angle difference that could occur in the experiments of the hand back imaging, and then compared the results with that of the phantom placed horizontally (See Figure 5). It is proved that the transducer could receive signals from the same target within a certain range and the change of the results due to the slight differences in the angle can be neglected. Therefore, for superficial blood vessel imaging, the image would not change due to the slight difference of 3D projection angle.
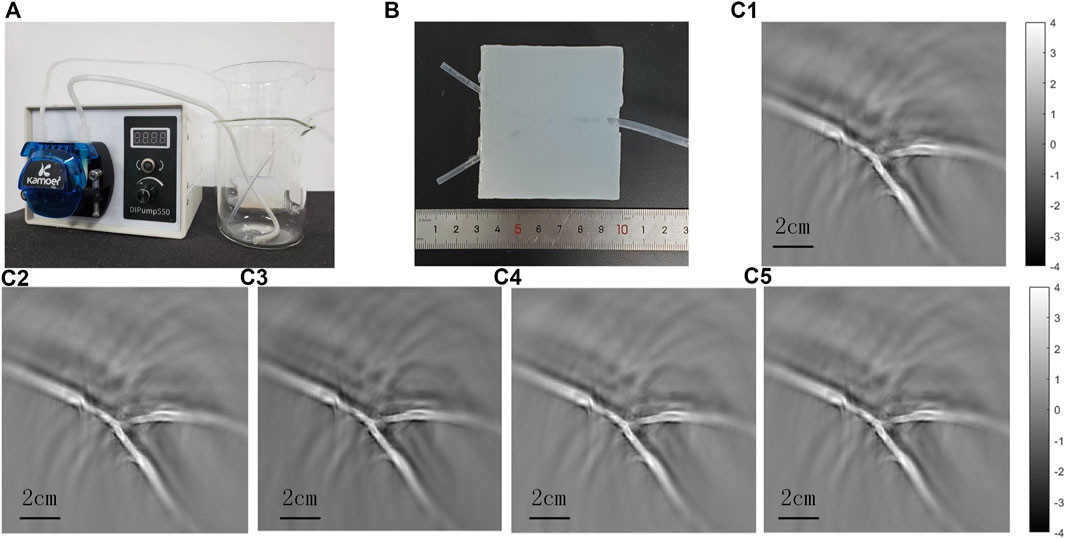
FIGURE 4. Phantom experiments to simulate blood flow imaging. (A) is the experimental device of the phantom experiment, which simulates the flow process of blood in the body through a peristaltic pump. (B) is the phantom of Y-shaped silicone tube. (c1) -(c5) are the first to fifth layers of the PAT images.
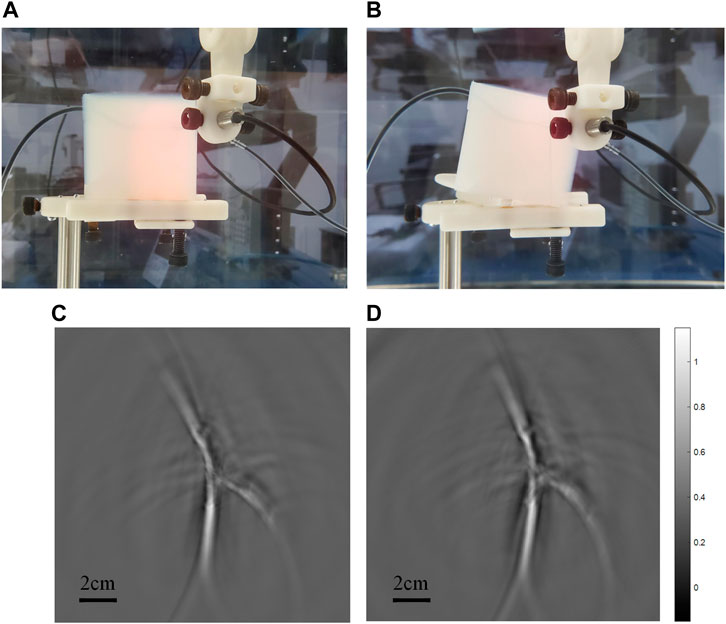
FIGURE 5. (A) is the scanning imaging experiment diagram under horizontal state, and (B) is the scanning imaging diagram under phantom tilt of 15°. (C,D) are photoacoustic imaging images corresponding to (A,B) respectively.
To evaluate the performance and accuracy of different registration methods, the blood vessels of the backs of human hands were imaged. Four categories (nine groups) of datasets collected by transducers with two center frequencies and at three optical wavelengths were used for the registration test (see Table 1). Image registration methods are implemented in MATLAB, using an Intel Core i7, 10th generation with 1.61 GHz clock speed and 16 GB RAM.
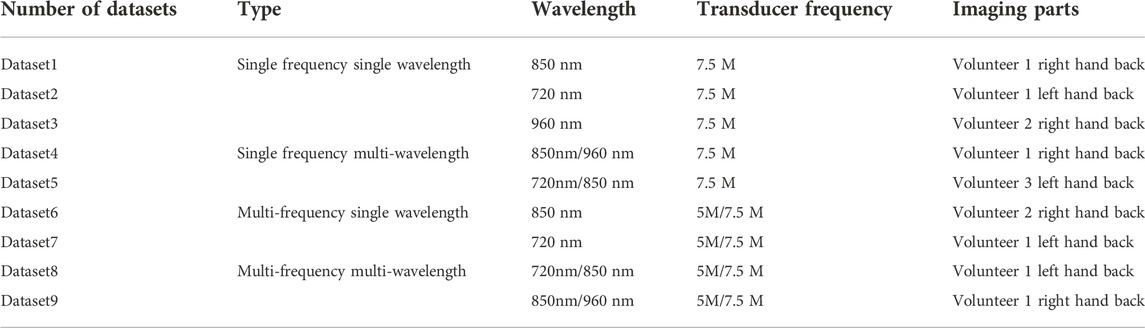
TABLE 1. Overview of hand vascular photoacoustic image datasets.
The images were acquired by transducers with different center frequencies at different wavelengths and the original photoacoustic images had a low signal-to-background ratio (SBR). Therefore, preprocessing is necessary to bring images taken with different imaging conditions to a similar intensity and improve SBR for subsequent registration. Firstly, normalization was applied to bring the images to similar intensity in order to simplify the computation. Then, bilateral filter was applied to smooth and denoise the background, as well as to preserve the edges [49], and FCM was applied to extract the target tissue [50].
After preprocessing the images, the reference image and floating image were obtained. We tested four commonly used intensity-based (see Figures 7A–D) and two feature-based (SIFT and SURF) registration schemes. In addition, we proposed a new scheme by adding phase correlation as rough registration to improve the performance of these intensity-based methods. The registration schemes were investigated using four types of image datasets (see Table 1) collected at three wavelengths by transducers with two central frequencies.
The intensity-based registration method uses grayscale information to directly calculate the similarity degree of the image, which has the advantages of simple operation without complex preprocessing and extensive computation. Its registration process is to select the corresponding similarity measure function according to the characteristics of the images, and then by applying a specific search algorithm in the parameter space of the chosen geometric transformation model, the geometric transformation parameter that maximizes the similarity is found. The image registration quality mainly depends on the similarity measure function.
Mean square error (MSE) and mutual information (MI) are common measure parameters in intensity-based registration [51]. MSE usually represents the deviation between the calculated and the actual values. In image registration, MSE is used to evaluate the accuracy and performance of the algorithm. The smaller MSE represents higher accuracy and better performance of the algorithm. It is defined as Eq. 1:
where I and K are the floating and reference images, respectively. The m, n is the number of samples, that is, the number of pixels corresponding to the floating image I and the reference image K. I, j denotes any pixel. MI is an essential concept in information theory, which describes the correlation between two systems or how much information they contain with each other. In image registration, the MI of the two images reflects the degree of mutual inclusion through their entropy and joint entropy. The mutual information of the two images can be expressed as Eq. 2:
H is the entropy of the image. For an image Y, the entropy can be expressed as Eq. 3. Let the gray level value of image Y be
The role of the optimizer is to guide each parameter of the objective function to update the appropriate size in the correct direction during the updating process of the iterative function, so that the updated parameter drives the value of the objective function to approach the global minimum continuously. The regular step gradient descent optimizer (RSGD) and the one-plus-one evolutionary optimizer (OPOE) are commonly used optimizers. The regular step gradient descent optimizer follows the gradient of image similarity measure in the extreme direction [52]. It uses a constant step length along the gradient between computations until the gradient change direction. Thereafter, with each change in the gradient direction, the step size is reduced according to the relaxation factor. The one-plus-one evolutionary optimizer iterates to find a set of parameters that yield the best registration result. It does this by tuning the arguments (the parent arguments) from the last iteration. If the new (child) parameters yield a better result, the new parameter becomes the adjusted new parent parameter. The next iteration will be more aggressive. If the result of the child parameter is not as good as that of the parent parameter, the parent parameter remains, and the next perturbation will be less aggressive [53].
The feature-based registration method extracts the common features from the reference image and the floating image as the registration primitives. It then estimates the geometric transformation model and parameter values between the reference and floating images by establishing the corresponding relationship between the registration primitives. It has the advantages of low computational complexity and strong robustness. It is suitable for registering images with complex geometric deformation, but not for registering images with blurred feature points or a smaller number of features.
Scale-invariant feature transform (SIFT) is proposed and further improved by Lowe et al. [54]. It can effectively solve the problem of image scale invariance and rotation invariance, and has good robustness to noises and illumination changes. The main idea of the algorithm is: firstly, the scale space of the image is established; then, the extremum points of the image are searched in the scale space; the feature descriptors are established for the extremum points; the similarity matching is carried out by the feature descriptors; the parameter estimation of the model is transformed; and finally the registration is completed.
Speeded up robust features (SURF) is an improvement of SIFT [55]. The main feature of SURF is to use the Hessian determinant value as the feature point and respond to the Harr wavelet transform. It uses the integral graph effectively, and the processing speed is accelerated.
After image registration, specific evaluation measures were used to assess the performance of the registration algorithms. The MOS, time consumption, SSIM, PSNR, RMSE, and percentage P of jump in quantitative visual perception were calculated and compared to evaluate the registration performance of different registration methods.
Subjective evaluation is the most common and direct image evaluation method [56]. Image registration must first satisfy the qualitative visual perception. In MOS, image quality is divided into five grades according to its merits, and the best rating is five.
When visually challenging to judge, objective parameters are usually applied to evaluate the registration performance quantitatively. In this study, the objective evaluation measures used are computation time, RMSE, SSIM, PSNR, and jump percentage P in quantitative visual perception.
Computation time is used to measure the computing speed of image registration. Under the same conditions, the algorithm with less computation time is faster in image registration. There is often a tradeoff between computation time and registration accuracy in practical applications. Therefore, balancing these two factors to optimize quality and efficiency is also the pursuit of image registration algorithms.
RMSE is usually applied to indicate the deviation between the calculated value and the actual value. The smaller the RMSE, the higher the accuracy and the better the algorithm’s performance. It is represented as Eq. 6:
Where p' and p represent the matching points in the image to be registered and the reference image.
SSIM is a measure of the similarity between two images. SSIM is designed based on the ability of the human visual system to capture the structural features of images. The image is evaluated by brightness, contrast, and structure. The value ranges from 0 to 1, and the higher value represents the higher the similarity between the two images in brightness, contrast, and structure. In practical applications, the Gaussian function, variance, and covariance are generally used to calculate the mean value of images instead of traversing the pixels to achieve higher efficiency. It can be expressed as Eq. 7:
Where,
PSNR is used to measure the difference between two images, which can compute the impact of the noises that affect the quality of its representation between registered and reference images. PSNR is the most commonly used objective evaluation index of images. It is based on the error between corresponding pixels. Thus it is the image quality evaluation based on error sensitivity. The higher value of PSNR indicates better registration quality. Since it doesn’t consider the visual characteristics of the human eyes, the evaluation results are sometimes inconsistent with visual perception. Mathematically, it is given as Eq. 8:
The brightness effect and the spatial frequency masking effect are two essential characteristics of human vision. According to these effects, an important parameter of visual discrimination, just noticeable difference (JND), is derived. This parameter is used to calculate the change of effective pixels number of an image, namely, jump percentage P (higher p-value is better). Thus, it can obtain quantitative evaluation results consistent with human visual perception. The evaluation algorithm is given in Figure 6.
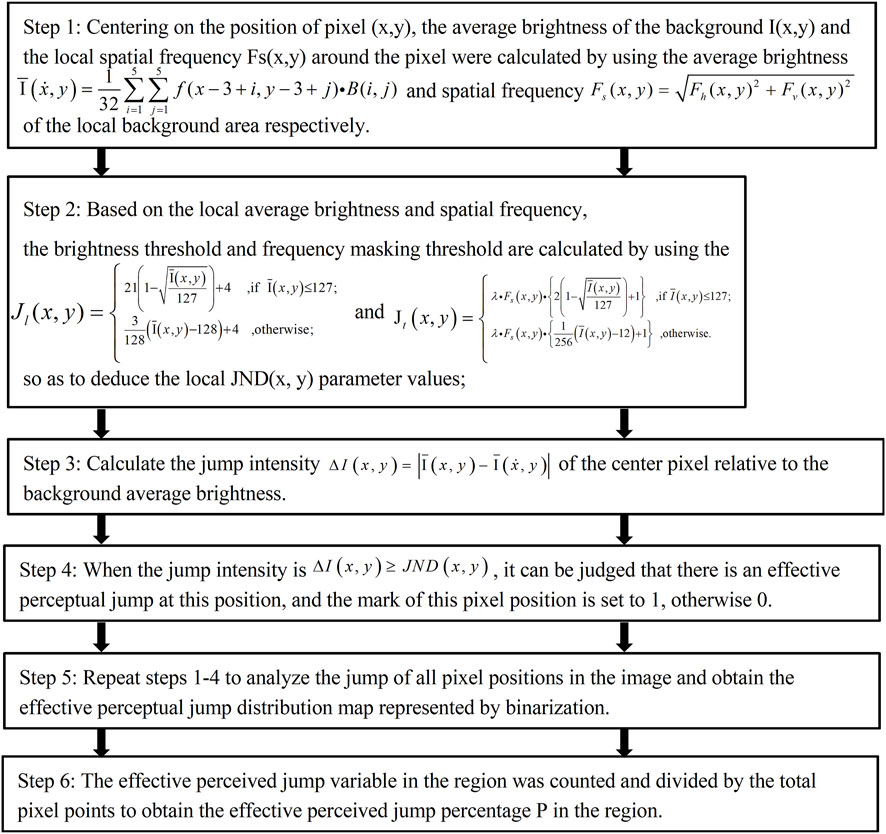
FIGURE 6. Quantitative visual perception algorithm.
The different intensity-based (see Figure 7) and feature-based registrations are evaluated and compared. In our results, the feature-based registration method has a low registration rate (SIFT 33.3% and SURF 11.1%), and poor registration quality. This is due to the insufficient feature points or feature pairs in the PAT images. The results indicate that the feature-based registration in this study is not suitable for applications like hand blood vessel PAT images. In Figure 7, examples of registered images (dataset 9) of each registration method are shown. Although phase correlation (CORR) cannot obtain high registration quality, it is fast. And by applying it as a rough registration with other methods, the overall registration performance can be significantly improved. Therefore, we took it as a rough registration to combine with other registration schemes and compared the results with and without CORR. In Figure 7, A-H refers to the eight different registration schemes. A–D are the registration results without phase correlation, which are MSE and regular step gradient descent optimizer, MSE and one-plus-one evolutionary optimizer, MI and regular step gradient descent optimizer, MI and one-plus-one evolutionary optimizer. E-F are the registration results of phase correlation combined with the previous methods. In the registration images, magenta and green represent the differences between the two images, and the registered part is white.
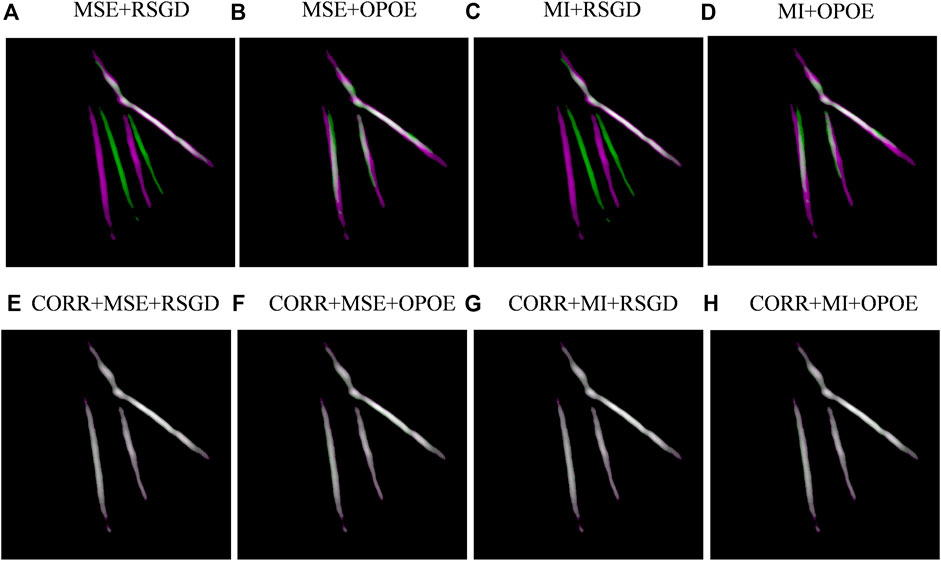
FIGURE 7. Example of image registration for dataset 9. (A–H) represents different image registration algorithms.
Three people who did not participate in the experiment were invited to evaluate the images. A score of 5 refers to the best result, and the percentage of a score of 4 or above in all datasets was used as the evaluation index. A higher percentage indicates a better result. The MOS evaluation results for different registration schemes are shown in Figure 8. Before phase correlation was applied as a rough registration, the scheme of MI with regular step gradient descent optimizer got the best registration result, which was 33.33%. After using phase correlation as rough registration, the overall registration quality was improved. The percentage was increased by 14.81%–48.15%. Overall, the scheme of phase correlation combined with MSE and regular step gradient descent optimizer offers the best registration results (59.26%).
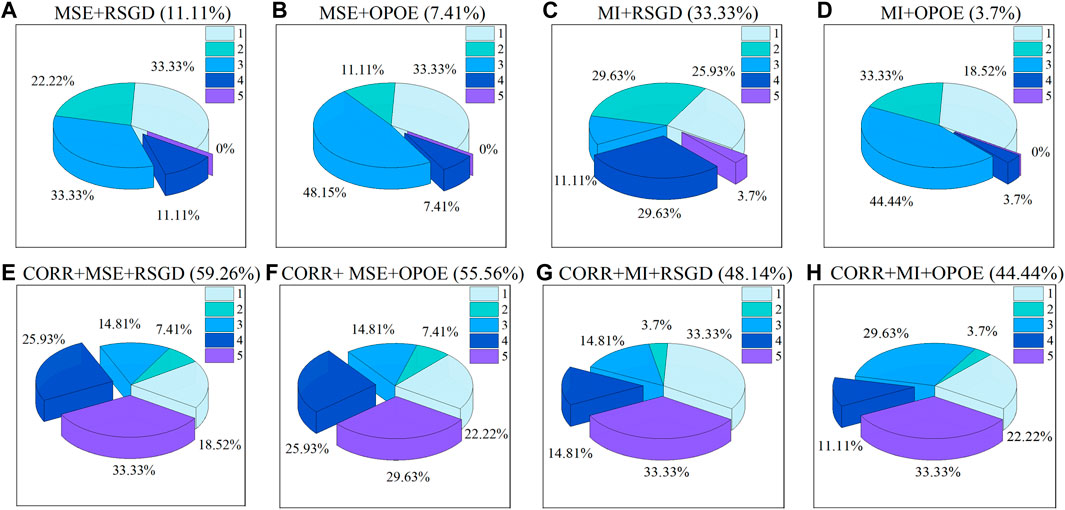
FIGURE 8. MOS evaluation of different registration methods. (A–H) represents registration schemes. The proportion of results with a score of four or above is shown in parentheses.
Figure 9 shows the time consumption of the eight registration schemes with different datasets. We repeated the experiments five times for each dataset with each registration method and plotted the averaged time consumption, which excludes the contingency and is representative to a certain extent. As can be seen from Figure 9, similarity measure MSE has a faster registration rate than MI when the optimizer is consistent. When the similarity measure is consistent, one-plus-one evolutionary optimizer takes less time than regular step gradient descent optimizer. Overall, whether rough registration is applied or not, the scheme of MI with regular step gradient descent optimizer takes longer. The scheme of MSE with one-plus-one evolutionary optimizer, takes the shortest time. Other schemes take about the same time.
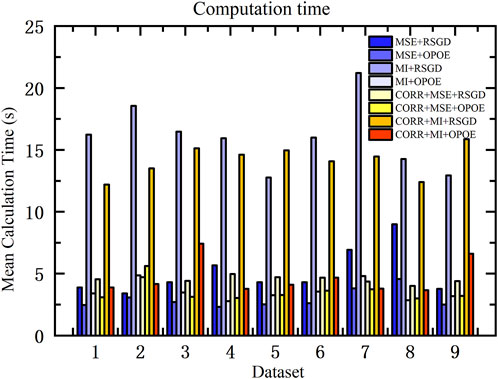
FIGURE 9. Mean computation time of 8 registration schemes in 9 groups of datasets.
The SSIM, RMSE, PSNR, and percentage of visual perception P were calculated (see Figure 10). We compared the performances with and without phase correlation rough registration across all the nine groups of datasets. In addition, we also compared the performances among the eight registration schemes in each type of datasets. Figure 10A shows the SSIM value of registration results using different registration schemes in the nine groups of datasets. After introducing phase correlation as rough registration, the total SSIM value of nine data groups did not change significantly, which means they have similar contrast and structural degradation. Comparing the eight schemes, the scheme of phase correlation combined with MSE and regular step gradient descent optimizer has good SSIM values for each type of datasets. Figure 10B shows the RMSE value. Overall, with rough registration, the registered image has a better RMSE value, indicating better registration image quality. Taken individually, phase correlation combined MSE and regular step gradient descent optimizer had high accuracy in most datasets. Figure 10C represents the PSNR of the datasets. The overall image quality is slightly improved after rough registration. Figure 10D shows the quantified percentage of visual perception. For each type of datasets, phase correlation combined MSE and regular step gradient descent optimizer has a higher value of P, in other words, it is more perceptive to the human eye. As a whole, when the optimizer is consistent, the similarity measure MSE performs better than MI. That is, it has a higher value of SSIM and PSNR, as well as a lower value of RMSE. When the similarity measure is consistent, the regular step gradient descent optimizer has a better performance than the one-plus-one evolutionary optimizer, which is also reflected in a higher value of SSIM and PSNR, and a lower value of RMSE. Moreover, this result remains unchanged after phase correlation is introduced for rough registration.
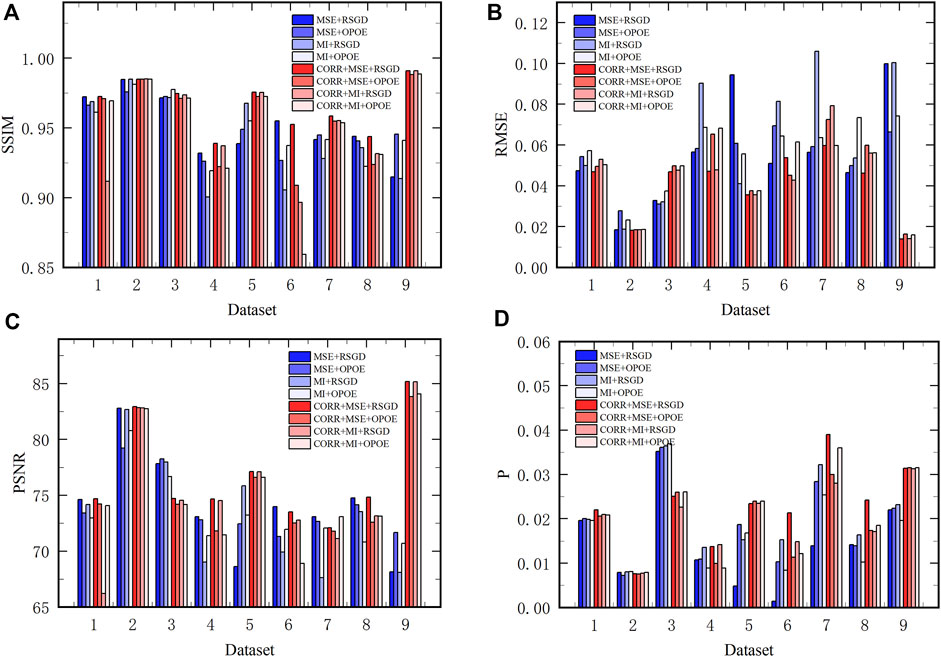
FIGURE 10. The evaluation of 9 groups of datasets using objective measures. (A–D) represent SSIM, RMSE, PSNR, and jump percentage P, respectively.
Different endogenous contrast agents have different absorption spectra. Hemoglobin is commonly used as an endogenous contrast agent, which is widely used for vascular imaging in the visible and near-infrared spectral ranges. When the wavelength is 720 nm, the absorption coefficient of HbO2 is less than that of HbR. When the wavelength is 850 nm, the absorption coefficient of HbO2 is greater than that of HbR. When the wavelength is 960 nm, more deep information can be provided [57]. In the human body, the oxygen content of arterial blood is higher than that of venous blood [58]. Therefore, when imaging at different wavelengths, veins and arteries can be effectively distinguished. These wavelengths are commonly used in vascular functional imaging [59].
Feature-based methods are widely used in image registration. However, our results show that sufficient feature points or feature pairs cannot be obtained in the PAT images of hand blood vessels, resulting in low registration efficiency. The reasons for this could be that PAT images are lack of rich curve inflection points and local curvature discontinuity points, which do not meet the corner features commonly extracted in SIFT and SURF feature extraction. Therefore, the feature-based registration method is unsuitable for registering PAT images of a small range of hand blood vessels.
Intensity-based registration is the primary registration method analyzed in this study. Different similarity measures and optimization methods turn the registration problem into an optimization problem. The grayscale calculation in a small range provides a fast computation while ensuring high accuracy. In our study, we found that among the commonly used registration methods we tested, the mean square error similarity measurement combined with the regular step gradient descent optimizer has better accuracy, but it is time-consuming. In order to improve the performance, we proposed to apply phase correlation as a rough registration to combine with the previous methods. Although the registration accuracy of phase correlation is low, it has the advantage of fast registration in simple translation. Therefore, we proposed a new scheme that divided the registration into two parts. First, the registration of large positions is completed by phase correlation, and then the registration adjustment of small errors is carried out using MSE and regular step gradient descent optimizer. The results showed a significant improvement in the overall registration performance. In addition, we found that all these registration methods showed a relatively consistent variation in performance on different types of data, which indicates that they can be applied for image registration of all the four types of PAT data. Comparing the eight registration schemes by combining MOS, time consumption, and objective evaluation measures, the proposed scheme of phase correlation combined MSE and regular step gradient descent optimizer has stable and superior performance.
Image registration must first satisfy the subjective visualization. In this study, subjective evaluations were conducted by different subjects to satisfy the qualitative visual evaluation, as well as to reduce subjectivity. When the differences are hard to identify for the visual assessment, objective evaluation measures are often applied to analyze the registration results quantitatively. The reasons for selecting SSIM, RMSE, and PSNR are as follows:1) by calculating SSIM and PSNR, we can compare the image quality of the registered images relative to reference images, including image contrast, brightness, structural degradation, and unwanted noise; 2) The error between the float image and the reference image can be measured by calculating RMSE.
Since the SSIM, PSNR, and RMSE are calculated based on pixel intensity, it is possible that these objective measures give results different from the subjective visual evaluation. When subjective visual evaluation cannot be made, it is necessary to add the measure of quantitative visual perception to reflect human visual perception. Therefore, both subjective and objective evaluation measures should be considered when judging image registration performance. Meanwhile, computation time is also worth considering. To some extent, there is a tradeoff between the computation time and registration accuracy. Our goal is to achieve high-quality fast registration. Thus, the overall computation time and accuracy also need to be considered comprehensively.
By combining the four objective measures, subjective visual evaluation, and computation time, we evaluated the performances of different combinations of the two most commonly used similarity measures and optimizers for intensity-based registration with four types of PAT datasets. We also combined phase correlation with these registration methods and evaluated the change in registration performance. The results show that by adding phase correlation, the overall performance can be greatly improved, and by combining phase correlation with MSE and regular step gradient descent optimizer, the registration gives better performance in all four categories of datasets. The results were validated using multiple sets of data for each category and were consistent.
In this study, intensity-based and feature-based automatic registration methods were investigated in the application of PAT vascular imaging using four types of human hand vascular PAT data. In addition, a new scheme with phase correlation was proposed to improve the performance of the previous registration methods. The feature-based registration methods (SIFT and SURF) did not provide good performance in our application. We had evaluated the performances of the intensity-based schemes by applying subjective visual evaluation and four objective evaluation measures SSIM, RMSE, PSNR, and jump percentage P. In addition, computation time was also considered. We found that by adding phase correlation as a rough registration, the overall registration performance can be significantly improved. From the results, we can conclude that the proposed scheme combining the phase correlation rough registration, mean square error measurement, and regular step gradient descent optimizer gives the best overall performance. This study provides a useful tool of image registration for clinical applications of PAT vascular imaging, such as vascular growth monitoring for early screening and postoperative evaluation of cancers.
The raw data supporting the conclusion of this article will be made available by the authors, without undue reservation.
The studies involving human participants were reviewed and approved by Medical Research Ethics Committee of Chongqing Medical University. The patients/participants provided their written informed consent to participate in this study.
All authors listed have made a substantial, direct, and intellectual contribution to the work and approved it for publication.
This research was supported by the Youth fund project of National Natural Science Foundation of China under grant 62201103,62101083; Project funded by China Postdoctoral Science Foundation 2020M683260; and Natural Science Foundation of Chongqing, China under grant cstc2021jcyj-msxmX0739, cstc2021jcyj-msxmX0104.
The authors declare that the research was conducted in the absence of any commercial or financial relationships that could be construed as a potential conflict of interest.
All claims expressed in this article are solely those of the authors and do not necessarily represent those of their affiliated organizations, or those of the publisher, the editors and the reviewers. Any product that may be evaluated in this article, or claim that may be made by its manufacturer, is not guaranteed or endorsed by the publisher.
1. Miller J. C., Pien H. H., Dushyant S., Gregory S. A., Thrall J. H., Imaging angiogenesis: Applications and potential for drug development. JNCI J Natl Cancer Inst (2005) 3:172–87. doi:10.1093/jnci/dji023
2. Hectors S. J., Jacobs I., Lok J., Peters J., Bussink J., Hoeben F. J., et al. mproved evaluation of antivascular cancer therapy using constrained tracer-kinetic modeling for multiagent dynamic contrast-enhanced mri. Cancer Res (2018) 78(6):1561–70. doi:10.1158/0008-5472.Can-17-2569
3. Vriens D., de Geus-Oei L. F., Heerschap A., van Laarhoven H. W., Oyen W. J., Vascular and metabolic response to bevacizumab-containing regimens in two patients with colorectal liver metastases measured by dynamic contrast-enhanced mri and dynamic 18 F-Fdg-Pet. Clin Colorectal Cancer (2011) 10(1):E1–E5. doi:10.3816/ccc.2011.n.010
4. Yang X., Review article quantifying tumor vascular heterogeneity with dynamic contrast-enhanced magnetic resonance imaging: A review Journal of Biomedicine and Biotechnology 2011 12 (2013).doi:10.1155/2011/732848
5. Chang Y. C., Huang Y. H., Huang C. S., Chang R. F., Vascular morphology and tortuosity analysis of breast tumor inside and outside contour by 3-D power Doppler ultrasound. Ultrasound Med Biol (2012) 38(11):1859–69. doi:10.1016/j.ultrasmedbio.2012.06.010
6. Cuinet C., Sarran F., Uzan-Augui J., Bonastre J., Lassau N., Coiffier B., et al. Selection of an early biomarker for vascular normalization using dynamic contrast-enhanced ultrasonography to predict outcomes of metastatic patients treated with bevacizumab. Ann Oncol 2016 27 1922, doi:10.1093/annonc/mdw280
7. Kenneth H., Heidi U., Mark L., Robbin M., Forero-Torres A., Ultrasound in medicine & biology (2015).Ultrasound imaging of breast tumor perfusion and neovascular morphology, 41 2292-302. doi:10.1016/j.ultrasmedbio.2015.04.016
8. Lassau N., Bonastre J., Kind M., Lassau N., Bonastre J., Kind M., et al. Validation of dynamic contrast-enhanced ultrasound in predicting outcomes of antiangiogenic therapy for solid tumors: The French multicenter support for innovative and expensive. Investigative Radiology (2014) 49:794–800. doi:10.1097/rli.0000000000000085
9. Lassau N., Chami L., Benatsou B., Peronneau P., Roche A., Dynamic contrast-enhanced ultrasonography (Dce-Us) with quantification of tumor perfusion: A new diagnostic tool to evaluate the early effects of antiangiogenic treatment. Eur Radiol Suppl (2007) 17(6):89–98. doi:10.1007/s10406-007-0233-6
10. Wu Z., Yang X., Chen L., Wang Z., Shi Y., Mao H., et al. Anti-angiogenic therapy with contrast-enhanced ultrasound in colorectal cancer patients with liver metastasis. other (2017)(20) e6731 96.doi:10.1097/MD.0000000000006731
11. Kim E., Stamatelos S., Cebulla J., Bhujwalla Z. M., Popel A. S., Pathak A. P., Multiscale imaging and computational modeling of blood flow in the tumor vasculature. Ann Biomed Eng (2012)(11) 40.2425-41. doi:10.1007/s10439-012-0585-5
12. Ma1 E., Ren1 A., Gao1 B., Yang1 M., Zhao1 Q., Wang1 W., et al. Roi for outlining an entire tumor is a reliable approach for quantification of lung cancer tumor vascular parameters using ct perfusion. OncoTargets & Therapy (2016).9:2377-84. doi:10.2147/OTT.S98060
13. Schmitz S., Rommel D., Michoux N., Lhommel R., Hanin F. X., Duprez T., et al. Dynamic contrast-enhanced computed tomography to assess early activity of cetuximab in squamous cell carcinoma of the head and neck. Radiol Oncol (2015) 49(1):17–25. doi:10.2478/raon-2014-0030
14. Yao J., Yang Z. G., Chen H. J., Chen T. W., Huang J., Gastric adenocarcinoma: Can perfusion ct help to noninvasively evaluate tumor angiogenesis? Abdom Imaging (2011) 36(1):15–21. doi:10.1007/s00261-010-9609-5
15. Vu T, Razansky D, Yao J, Listening to tissues with new light: Recent technological advances in photoacoustic imaging. J Opt (2019) 21(10):103001. doi:10.1088/2040-8986/ab3b1a
16. Huang P. H., Tsai J. C., Kuo L. T., Lee C. W., Lai H. S., Tsai L. K., et al. Clinical application of perfusion computed tomography in neurosurgery. J Neurosurg (2014) 120(2):473–88. doi:10.3171/2013.10.jns13103
17. Jonathan L., Maxime H., Jean L., Josserand V., Exploration of melanoma metastases in mice brains using endogenous contrast photoacoustic imaging. Int J Pharmaceutics (2017) 532:704–9. doi:10.1016/j.ijpharm.2017.08.104
18. Kumar D. M., Christos M., Michael M., Petersen C. R., Moselund P. M., Bang O., High-pulse energy supercontinuum laser for high-resolution spectroscopic photoacoustic imaging of lipids in the 1650-1850 Nm region. Biomed Opt Express (2018) 9(4):1762. doi:10.1364/boe.9.001762
19. Neuschmelting V., Lockau H., Ntziachristos V., Grimm J., Kircher M. F., Lymph node micrometastases and in-transit metastases from melanoma: In vivo detection with multispectral optoacoustic imaging in a mouse model (2016).Radiology 160191 280 doi:10.1148/radiol.2016160191
20. Sangha G. S., Phillips E. H., Goergen C. J., Vivo photoacoustic lipid imaging in mice using the second near-infrared window. Biomedical Optics Express (2017). 8: 736–742. doi:10.1364/BOE.8.000736
21. Zhang H. F., Maslov K., Stoica G., Wang L. V., Functional photoacoustic microscopy for high-resolution and noninvasive in vivo imaging. Nat Biotechnol (2006) 24:848–51. doi:10.1038/nbt1220
22. Liu Y., Zhang L., Li S., Han X., Yuan Z., Imaging molecular signatures for clinical detection of scleroderma in the hand by multispectral photoacoustic elastic tomography. J Biophotonics (2018) 11(6):e201700267. doi:10.1002/jbio.201700267
23. Shang S. S., Chen Z. J., Zhao Y., Yang S. H., Xing D., Simultaneous imaging of atherosclerotic plaque composition and structure with dual-mode photoacoustic and optical coherence tomography. Opt Express (2017) 25(2):530–9. doi:10.1364/oe.25.000530
24. Brown E., Brunker J., Bohndiek S. E., Photoacoustic imaging as a tool to probe the tumour microenvironment. Dis Model Mech (2019) 12(7):dmm039636. doi:10.1242/dmm.039636
25. Brown E. L., Lefebvre T. L., Sweeney P. W., Stolz B. J., Grohl J., Hacker L., et al. Quantification of vascular networks in photoacoustic mesoscopy. Photoacoustics (2022) 26:100357. doi:10.1016/j.pacs.2022.100357
26. Haedicke K., Agemy L., Omar M., Berezhnoi A., Roberts S., Longo-Machado C., et al. High-resolution optoacoustic imaging of tissue responses to vascular-targeted therapies. Nat Biomed Eng (2020) 4(3):286–97. doi:10.1038/s41551-020-0527-8
27. Tang J., Dai X., Jiang H., Wearable scanning photoacoustic brain imaging in behaving rats. J Biophotonics (2016) 9(6):570–5. doi:10.1002/jbio.201500311
28. Kajita H., Suzuki Y., Sakuma H., Imanishi N., Tsuji T., Jinzaki M., et al. Visualization of lymphatic vessels using photoacoustic imaging. Keio J Med (2021) 70(4):82–92. doi:10.2302/kjm.2020-0010-OA
29. Mantri Y., Tsujimoto J., Donovan B., Fernandes C. C., Garimella P. S., Penny W. F., et al. Photoacoustic monitoring of angiogenesis predicts response to therapy in healing wounds. Wound Repair Regen (2022) 30(2):258–67. doi:10.1111/wrr.12992
30. Shan T., Zhao Y., Jiang S., Jiang H., In-vivo hemodynamic imaging of acute prenatal ethanol exposure in fetal brain by photoacoustic tomography. J Biophotonics (2020) 13(5):e201960161. doi:10.1002/jbio.201960161
31. Wang P. P., Chen Z. J., Xing D., Multi-parameter characterization of atherosclerotic plaques based on optical coherence tomography, photoacoustic and viscoelasticity imaging. Opt Express (2020) 28(9):13761–74. doi:10.1364/oe.390874
32. Zhang J., Duan F., Liu Y., Nie L., High-resolution photoacoustic tomography for early-stage cancer detection and its clinical translation. Radiol Imaging Cancer (2020) 2(3):e190030. doi:10.1148/rycan.2020190030
33. Yang J., Zhang G., Wu M., Shang Q., Huang L., Jiang H., Photoacoustic assessment of hemodynamic changes in foot vessels. J Biophotonics (2019) 12(6):e201900004. doi:10.1002/jbio.201900004
34. Lin L., Wang L. H. V., The emerging role of photoacoustic imaging in clinical oncology. Nat Rev Clin Oncol (2022) 19(6):365–84. doi:10.1038/s41571-022-00615-3
35. Zhang C., Feng W., Zhao Y. J., Yu T. T., Li P. C., Xu T. H., et al. A large, switchable optical clearing skull window for cerebrovascular imaging. Theranostics (2018) 8(10):2696–708. doi:10.7150/thno.23686
36. Yang J., Zhang G., Shang Q., Wu M., Huang L., Jiang H., Detecting hemodynamic changes in the foot vessels of diabetic patients by photoacoustic tomography. J Biophotonics (2020) 13(8):e202000011. doi:10.1002/jbio.202000011
37. Zitová B., Flusser J., Image registration methods: A survey. Image Vis Comput (2003) 21(11):977–1000. doi:10.1016/s0262-8856(03)00137-9
38. Amelio L., Amelio A., Ct image registration in acute stroke monitoring. Proceedings of the 41th Jubilee International Convention on Information and Communication Technology, Electronics and Microelectronics (MIPRO) (May 2018). Opatija, Croatia (Piscataway, NJ, United States). doi:10.23919/MIPRO.2018.8400275
39. Kim K. W., Lee J. M., Klotz E., Kim S. J., Kim S. H., Kim J. Y., et al. Safety margin assessment after radiofrequency ablation of the liver using registration of preprocedure and postprocedure ct images. Am J Roentgenology (2011) 196(5):565–72. doi:10.2214/ajr.10.5122
40. Demir A., Unal G., Karaman K., editors B. Fischer, B. M. Dawant, and C. Lorenz, Anatomical landmark based registration of contrast enhanced T1-weighted mr images. Biomedical Image Registration. Berlin, Heidelberg: Springer (2010).doi:10.1007/978-3-642-14366-3_9
41. Lin W. -C., Wu C. -C., Huang T. -C., Lin W. -C., Chiu B. Y. -C., Liu R. -S., et al. Red blood cell velocity measurement in rodent tumor model: An in vivo microscopic study. J Med Biol Eng (2012) 32(2):97–102. doi:10.5405/jmbe.875
42. Matl S., Brosig R., Baust M., Navab N., Demirci S., Vascular image registration techniques: A living review. Med Image Anal (2017) 35:1–17. doi:10.1016/j.media.2016.05.005
43. Ringstad G. A., Emblem K. E., Holland D., Dale A. M., Bjornerud A., Hald J. K., Assessment of pituitary adenoma volumetric change using longitudinal mr image registration. Neuroradiology (2012) 54(5):435–43. doi:10.1007/s00234-011-0894-7
44. Dumani D. S., Yu A., Thompson W., Brecht H. -P., Ivanov V., Anastasio M. A., et al. editors. Preclinical small animal imaging platform providing Co-registered 3d maps of photoacoustic response and fluorescence. Proccedings of the Conference on photons plus ultrasound - imaging and sensing. San Francisco, CA, USA (March 2019).doi:10.1117/12.2514489
45. Farnia P., Makkiabadi B., Alimohamadi M., Najafzadeh E., Basij M., Yan Y., et al. Photoacoustic-mr image registration based on a Co-sparse analysis model to compensate for brain shift. Sensors (2022) 22(6):2399. doi:10.3390/s22062399
46. Gehrung M., Tomaszewski M., McIntyre D., Disselhorst J., Bohndiek S., Co -registration of optoacoustic tomography and magnetic resonance imaging data from murine tumour models. Photoacoustics (2020) 18:100147. doi:10.1016/j.pacs.2019.100147
47. Gonzalez E. A., Jain A., Bell M. A. L., Combined ultrasound and photoacoustic image guidance of spinal pedicle cannulation demonstrated with intact ex vivo specimens. IEEE Trans Biomed Eng (2021) 68(8):2479–89. doi:10.1109/tbme.2020.3046370
48. Ren W., Skulason H., Schlegel F., Rudin M., Klohs J., Ni R., Automated registration of magnetic resonance imaging and optoacoustic tomography data for experimental studies. Neurophotonics (2019) 6(2):1. doi:10.1117/1.NPh.6.2.025001
49. Wang W. Q., Wang W. H., Yin J., A bilateral filtering based ringing elimination approach for motion-blurred restoration image. Curr Opt Photon (2020) 4(3):200–9. doi:10.3807/copp.2020.4.3.200
50. Ranjbarzadeh R., Saadi S. B., Automated liver and tumor segmentation based on concave and convex points using fuzzy C-means and mean shift clustering. Measurement (2020) 150:107086. doi:10.1016/j.measurement.2019.107086
51. Sen A., Anderson B. M., Cazoulat G., McCulloch M. M., Elganainy D., McDonald B. A., et al. Accuracy of deformable image registration techniques for alignment of longitudinal cholangiocarcinoma ct images. Med Phys (2020) 47(4):1670–9. doi:10.1002/mp.14029
52. Kamsing P., Torteeka P., Yooyen S., An enhanced learning algorithm with a particle filter-based gradient descent optimizer method. Neural Comput Appl (2020) 32(16):12789–800. doi:10.1007/s00521-020-04726-9
53. Styner M., Brechbuhler C., Szekely G., Gerig G., Parametric estimate of intensity inhomogeneities applied to mri. IEEE Trans Med Imaging (2000) 19(3):153–65. doi:10.1109/42.845174
54. Wang H., Fan J., Li Y., Research of shoeprint image matching based on sift algorithm. J Comput Methods Sci Eng (2016) 16:349–59. doi:10.3233/JCM-160622
55. Zhu H., Jiang Y., Zhang C., Liu S., Research on mosaic method of uav low-altitude remote sensing image based on sift and surf. J Phys : Conf Ser (2022) 2203(1):012027. doi:10.1088/1742-6596/2203/1/012027
56. Streijl R. C., Winkler S., Hands D. S., Mean opinion score (mos) revisited: Methods and applications, limitations and alternatives. Multimedia Syst (2016) 22(2):213–27. doi:10.1007/s00530-014-0446-1
57. Li M. C., Tang Y. Q., Yao J. J., Photoacoustic tomography of blood oxygenation: A mini review. Photoacoustics (2018) 10:65–73. doi:10.1016/j.pacs.2018.05.001
58. Harrop G. A., The oxygen and carbon dioxide content of arterial and of venous blood in normal individuals and in patients with anemia and heart disease. J Exp Med (1919) 30(3):241–57. doi:10.1084/jem.30.3.241
Keywords: image registration, intensity-based registration, photoacoustic tomography, visual perception, photoacoustic imaging, vascular
Citation: Yu Q, Liao Y, Liu K, He Z, Zhao Y, Li F and Shan T (2022) Registration of photoacoustic tomography vascular images: Comparison and analysis of automatic registration approaches. Front. Phys. 10:1045192. doi: 10.3389/fphy.2022.1045192
Received: 15 September 2022; Accepted: 07 November 2022;
Published: 22 November 2022.
Edited by:
Hao Yang, University of South Florida, United StatesReviewed by:
Lin Huang, University of Electronic Science and Technology of China, ChinaCopyright © 2022 Yu, Liao, Liu, He, Zhao, Li and Shan. This is an open-access article distributed under the terms of the Creative Commons Attribution License (CC BY). The use, distribution or reproduction in other forums is permitted, provided the original author(s) and the copyright owner(s) are credited and that the original publication in this journal is cited, in accordance with accepted academic practice. No use, distribution or reproduction is permitted which does not comply with these terms.
*Correspondence: Tianqi Shan, dGlhbnFpQGNxbXUuZWR1LmNu; Yuan Zhao, eXVhbnpoYW9AY3FtdS5lZHUuY24=; Faqi Li, bGlmcUBjcW11LmVkdS5jbg==
Disclaimer: All claims expressed in this article are solely those of the authors and do not necessarily represent those of their affiliated organizations, or those of the publisher, the editors and the reviewers. Any product that may be evaluated in this article or claim that may be made by its manufacturer is not guaranteed or endorsed by the publisher.
Research integrity at Frontiers
Learn more about the work of our research integrity team to safeguard the quality of each article we publish.