- 1MOE Key Laboratory for Nonequilibrium Synthesis and Modulation of Condensed Matter, Shaanxi Province Key Laboratory of Quantum Information and Quantum Optoelectronic Devices, School of Physics, Xi’an Jiaotong University, Xi’an, China
- 2Department of Engineering Mechanics, SVL and MMML, Xi’an Jiaotong University, Xi’an, China
Taking advantages of high-resolution, natural color restoration, and high imaging speed, optical sectioning structured illumination microscopy (OS-SIM) plays an important role in geology, biology, and material science. However, when encountering chromatic aberration or dealing with samples with semitransparent surface, the HSV (Hue, Saturation, and Value) decoding algorithm suffers intensity deviation and fading color. In this paper, we propose a focus level correlation algorithm for 3D color image reconstruction in OS-SIM. Simulations and experiments demonstrate that the algorithm can restore color of sample authentically, and improve the image processing speed by about 45%. This new algorithm successfully improves the results and the speed of optical sectioning reconstruction, expanding the application of OS-SIM.
Introduction
Due to the advantages of noncontact and minimally invasive observation, optical microscopy plays an essential role in morphology analyzing, which is one of the most important research areas in material science and geological fields [1, 2]. However, the conventional wide-field microscopy cannot obtain optical section directly, as the image obtained by the camera is the superposition of the in-focus information and the defocused background. For this reason, many three-dimensional (3D) imaging technologies have been developed, such as confocal laser scanning microscopy (CLSM) and two photon microscopy [3–5].
CLSM is one of the most widely used technique obtaining high-resolution 3D scans of micrometer-scale specimens [3]. It uses a highly focused laser to scan the sample point by point. The reflective or fluorescence signal is filtered by the detection pinhole and collected by the photomultiplier tube. Since only the signal excited at the laser focus can pass through the detection pinhole, CLSM can reduce the out-of-focus information and obtain a background-free image [3]. However, CLSM is too time-consuming to implement scans for centimeter-scale creatures, and the focused laser is detrimental for the samples. Furthermore, CLSM ignores the color information of the specimens. Color is an essential feature in geological research, which reflects the optical properties of crystals and is the direct basis for the classification and identification of minerals [6, 7]. In this case, it is necessary to develop an imaging technology which is able to accurately present the natural color of samples with complex microstructures.
Structured illumination microscopy (SIM) is another way obtaining optical section, and has found widely applications for 3D imaging and measurement in biological, medical and geological fields due to its advantages of high spatial resolution, fast imaging speed and natural color imaging [8–11]. The structured illumination was first applied on microscopy by Neil et al. to eliminate the out-of-focus background encountered in wide-field microscopy [12]. OS-SIM uses sinusoidal fringes with different phases to illuminate the sample, which appear only near the focal plane. The contrast of the structured illumination rapidly attenuates in the out-of-focus area and become uniform wide-field illumination. With decoding algorithm, the in-focus information can be separated from the background, and a 3D image of the sample can be reconstructed from optical sections. In our previous work, a DMD (digital micromirror device) based LED-illumination SIM has been reported that is suitable for 3D imaging [13–15]. By using Hilbert transform reconstruction, the image acquisition time can be reduced by 1/3 [16]. An HSV (Hue, Saturation, and Value) decoding algorithm realized full-color optical section [17]. With this well-developed OS-SIM system, we successfully obtained numbers of full-color 3D images of typical insect samples, such as shining leaf chafer, tiger beetles and so on [18]. However, due to the dependence on modulation depth of the HSV decoding algorithm, the sectioning images often suffer from intensity deviation and residual fringes under chromatic aberration. In addition, for samples with semitransparent surface, the modulation depth of the fringes changes considerably between surfaces of different reflective properties, leading to the variation of the optical section intensity and fading color of the reconstructed 3D image.
In this paper, we propose a focus level correlation (FLC) algorithm to reconstruct 3D natural color image in OS-SIM. For samples with varying colors and semitransparent surface like minerals, the results of reconstruction are improved with authentic colors and about 45% faster speed. This new algorithm is expected to expand the application of OS-SIM.
Materials and methods
Principle of optical sectioning with structured illumination microscopy
In the conventional wide-field microscope, the targeted in-focus information is inevitably merged with an unwanted out-of-focus background because the image is limited by the depth-of-field. SIM provides an approach to extract the in-focus information from the raw images by illuminating the sample with a nonuniform structured light. Only the in-focus part is modulated by the structured illumination, and the modulation depth attenuates rapidly as the defocus distance increases. Thus, the in-focus information can be decoded by algorithms. A typical kind of structured illumination is sinusoidal fringe with light intensity distribution like
where m denotes the modulation depth, ν is the spatial frequency, and φ is the spatial phase. Under the illumination of the sinusoidal fringe, the image of the sample is
where
In addition, the wide-field image
3D color image reconstruction based on focus level correlation algorithm
The most usual way to reconstruct color image is transforming the raw images into RGB (Red, Green, and Blue) space. Results can be received after calculating the RMS of each channel with Eq. 3 and recombining three channels. However, because lights with different wavelength focus on different planes and the modulation depth is related to the focus level, the modulation depths of R, G, and B are not identical in practice. The sectioning images suffer from color distortion caused by the chromatic aberration. In theory, the intensity of the optical sectioning image is proportional to the modulation depth according to Eqs 2, 3. Therefore, the ratio of R, G, and B intensities will change compared with the raw image, leading to the color distortion.
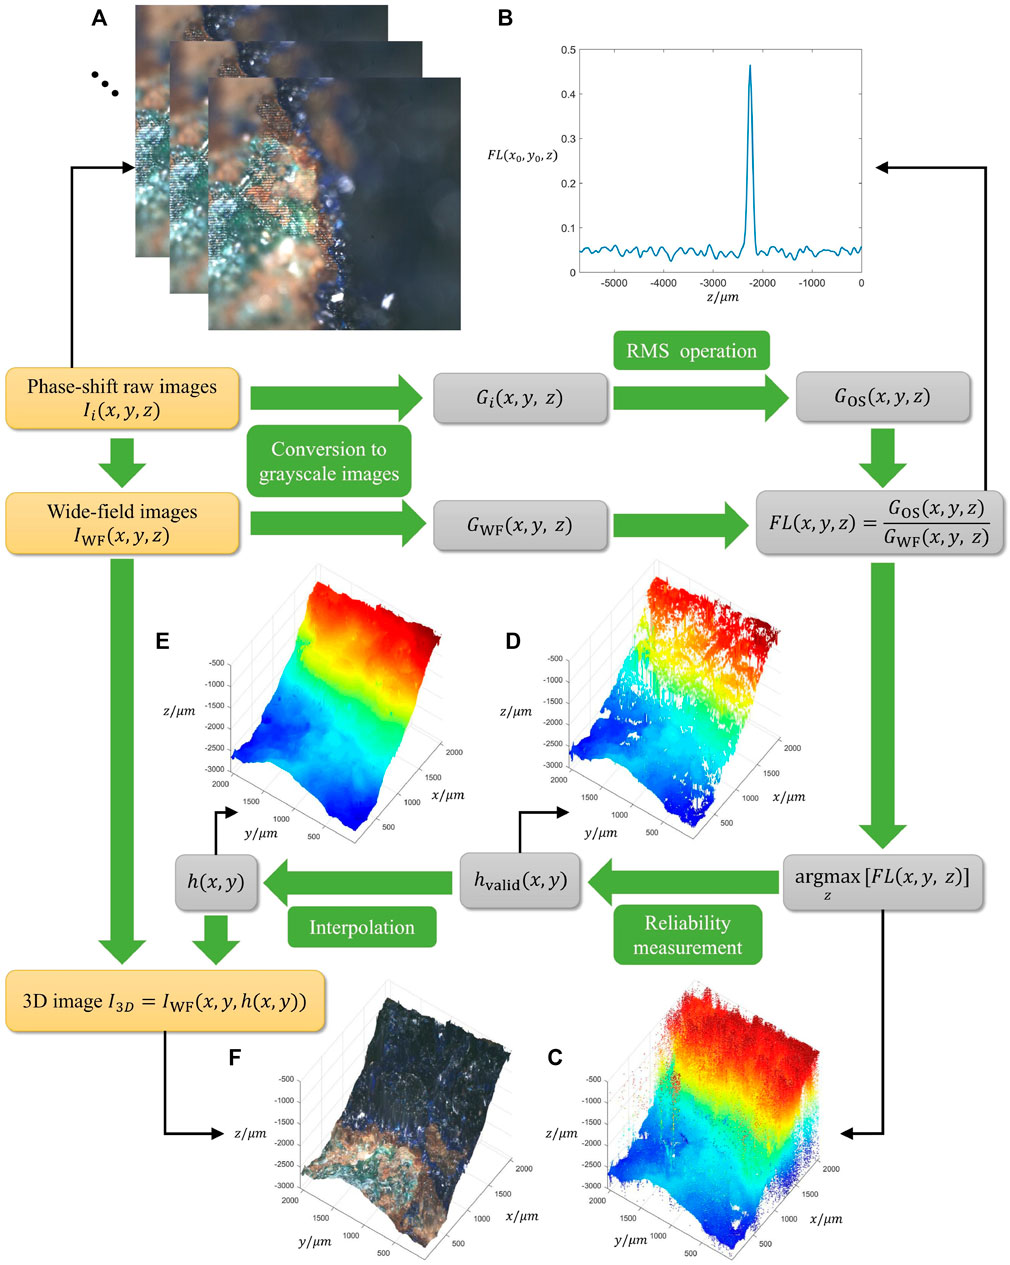
To restore the original color, a new 3D color image reconstruction algorithm named focus level correlation (FLC) is employed, whose flowchart is shown in Figure 1. With phase-shift raw images Ii(x, y, z) (i = 1, 2, 3) captured (Figure 1A), the wide-field image IWF(x, y, z) can be directly obtained by Eq. 4. Both of the raw images and wide-field images are converted to grayscale images Gi(x, y, z) and GWF(x, y, z). The optical sections GOS(x, y, z) can be obtained by RMS decoding operation, which indicate the averaged sectioning images of the three colors RGB. To calculate the focus position for each (x, y) and noticing that the intensity of optical section is maximum at the focus position, we define the focus level FL(x, y, z) as the proportion of GOS(x, y, z) and GWF(x, y, z):

FIGURE 1. Flowchart diagram of the 3D color image reconstruction algorithm based on focus level correlation. (A) Phase-shift raw images. (B) Modulation depth curve of a pixel (x0, y0). (C) Height map of maximum focus level. (D) Valid height map. (E) Height map with interpolation. (F) 3D image.
Figure 1B illustrates the focus level curve of a pixel (x0, y0), showing a distinct peak at the focal plane. The maximum of focus level along z axis and the corresponding argument are acquired for each (x, y). For pixels which have low SNR (signal-to-noise ratio) of focus level, they tend to result in wrong focus positions (Figure 1C). Therefore, a reliability measurement is implemented that the maximum of focus level along z axis has to exceed a threshold to be considered valid (Figure 1D). After interpolation on the invalid (x, y) by the valid height map hvalid(x, y), the whole height map h(x, y) can be obtained (Figure 1E). By restoring the color of wide-field images on corresponding position of height map, the 3D color image I3D can be finally reconstructed (Figure 1F).
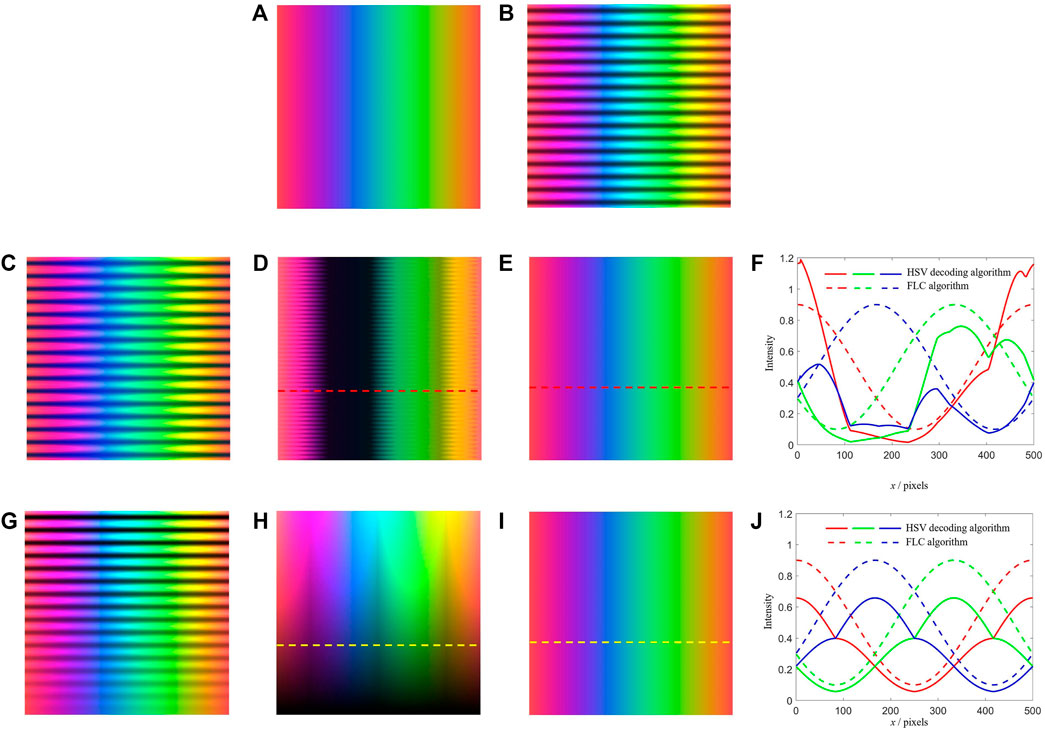
To demonstrate the color aberration in OS-SIM, we simulate the HSV decoding algorithm [17] and the FLC algorithm. The raw image (Figure 2A) is a rectangle with color gradients, generated by varying R, G, and B values to cover different colors. The image added with normal sinusoidal fringe of which modulation depth is 0.6 is shown in Figure 2B. For simulation of the chromatic aberration, the image is added with sinusoidal fringe of different R, G, and B modulation depth which is 0.9, 0.5, and 0.1 respectively (Figure 2C). As a result, the image decoded by the HSV decoding algorithm (Figure 2D) significantly deviates from the raw image in intensity and appears residual fringes. In contrast, the image decoded by the FLC algorithm (Figure 2E) restores the raw image with 100% accuracy. Figure 2F shows the intensity curve of R, G, and B along the red dashed line in Figures 2D,E for comparison. To simulate the modulation depth variation caused by varying reflective properties, the raw image is added with sinusoidal fringe with modulation depth changing from 1 to 0 (Figure 2G). As a result, the image decoded by the HSV decoding algorithm (Figure 2H) loses intensity at low modulation depth areas, while the image decoded by the FLC algorithm (Figure 2I) still restores the raw image authentically. Figure 2J shows the intensity curve of R, G, and B along the yellow dashed line in Figures 2H,I for comparison. In addition, the HSV decoding algorithm needs to compute the RMS operation in three channels H, S, and V [17], while the FLC algorithm firstly converts the color images to grayscale images and then compute the RMS operation in the single grayscale channel, thus the processing time of optical sectioning is saved by 67% theoretically.

FIGURE 2. Simulation of the HSV decoding algorithm and the FLC algorithm in this paper. (A) Raw image. (B) Image added with normal sinusoidal fringe. (C) Image added with sinusoidal fringe with chromatic aberration. (D) Image restored by the HSV decoding algorithm under chromatic aberration. (E) Image restored by the FLC algorithm under chromatic aberration. (F) Intensity curve of R, G, and B along the red dashed line in (D,E). (G) Image added with sinusoidal fringe with modulation depth variation. (H) Image restored by the HSV decoding algorithm under modulation depth variation. (I) Image restored by the FLC algorithm under modulation depth variation. (J) Intensity curve of R, G, and B along the yellow dashed line in (H,I).
Natural color optical sectioning structured illumination microscopy system
The natural color OS-SIM system is same as our previous work [11, 19]. The LED (SOLIS-3C, Thorlabs Inc.) light enters the total internal reflected (TIR) prism and is then reflected onto the DMD (V7000, ViALUX GmbH, Germany) to be modulated into a binary grating. After that, the light is collimated by an achromatic collimating lens (f = 200 mm), passes through a 50/50 beam-splitter, and is focused by the objective lens (×4, NA 0.2, Thorlabs Inc., United States) to illuminate the sample. Volume data of the sample can be obtained by axially moving the translation stage (3-M-122.2DD1, 25 mm travel range, Physik Instrumente GmbH and Co., KG, Germany), while moving in landscape orientation enables the extension of the field of view (FOV). A color sCMOS camera (pco.edge 5.5 CLHS, 100 fps at 2,560 × 2,160 pixels, PCO AG, Germany) is used to capture the 2D images. DMD patterns generation, stage movement and image record are controlled by custom software programmed in C++ to implement hardware synchronization.
Results
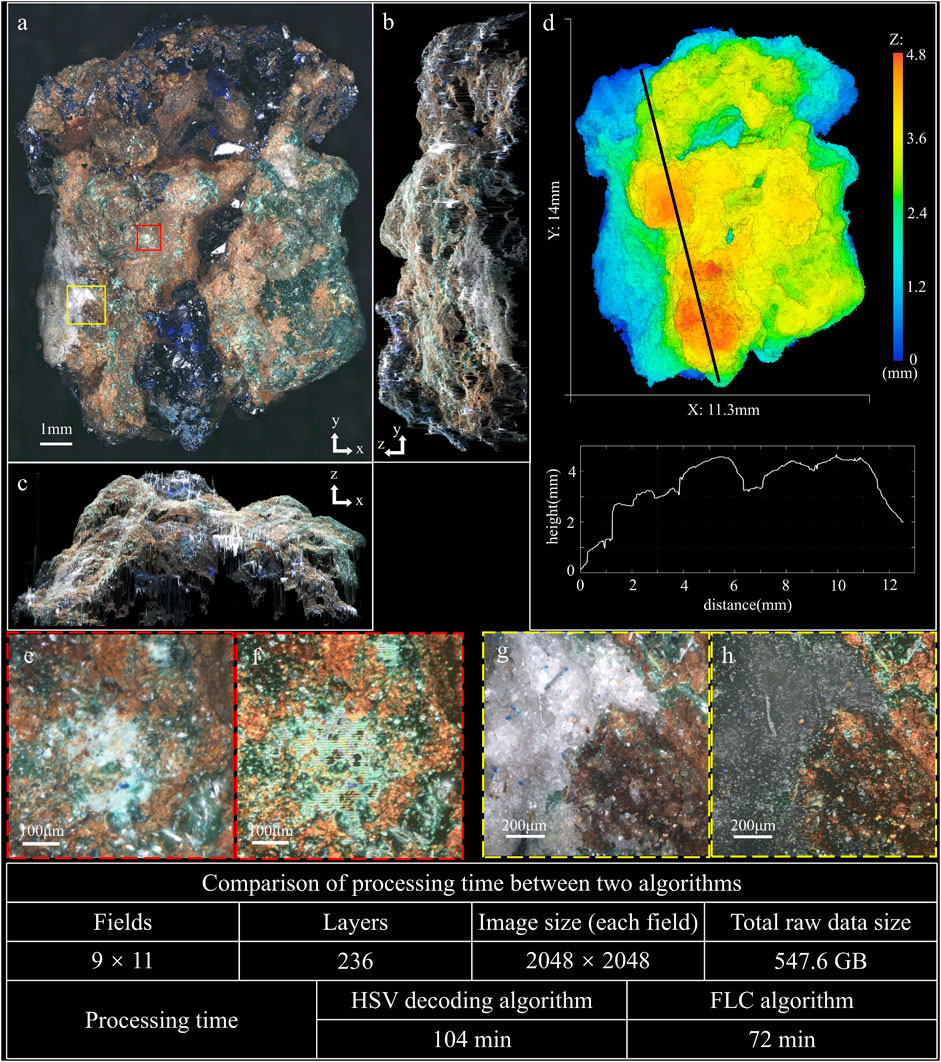
To demonstrate the better color restoration capability of the FLC algorithm, we capture images of two mineral samples with varying natural colors. The first mineral sample is a piece of azurite with rich colors, which consists of dark blue and semitransparent crystal, accompaning with green malachite in the brown oxidized zone of copper lodes. Figure 3 shows the imaging result of the azurite, and Supplementary Video S1 presents its reconstructed 3D image. The max intensity projection (MIP) images along z, x, and y axis are shown in Figures 3A–C, respectively. Figure 3D shows the height map of the sample with the profile along the black line-scan. Figure 3E shows a detail on the malachite, and Figure 3F shows the corresponding image restored by the HSV decoding algorithm. It can be seen that the HSV decoding algorithm arises residual fringes while the FLC algorithm is not affected. Figure 3G shows a detail on the white crystal, and Figure 3H shows the corresponding image restored by the HSV decoding algorithm. The HSV decoding algorithm fails to restore the color on the white crystal that the brightness loses seriously. The whole 3D image is stitched from 99 data sets (9 rows and 11 columns) with 236 layers at 20 μm axial intervals and 2,048 × 2,048 pixels for each field, which means the total raw data is 547.6 GB, and the whole 3D volume is 11.3 mm × 14 mm × 4.7 mm. The total image processing time of the HSV decoding algorithm and the FLC algorithm are 104 min and 72 min, which means the processing speed is improved by 44% (Windows 10, 32GB RAM, Intel Xeon W-2123 at 3.6 GHz, MATLAB R2017a).

FIGURE 3. 3D imaging result of azurite (see Supplementary Video S1). (A) MIP image along z axis. (B) MIP image along x axis. (C) MIP image along y axis. (D) Height map of the sample, with the profile along the black line-scan. (E) Detail image of the malachite in (A). (F) Image restored by the HSV decoding algorithm corresponding to the region of (E). (G) Detail image of the white crystal in (A). (H) Image restored by the HSV decoding algorithm corresponding to the region of (G).
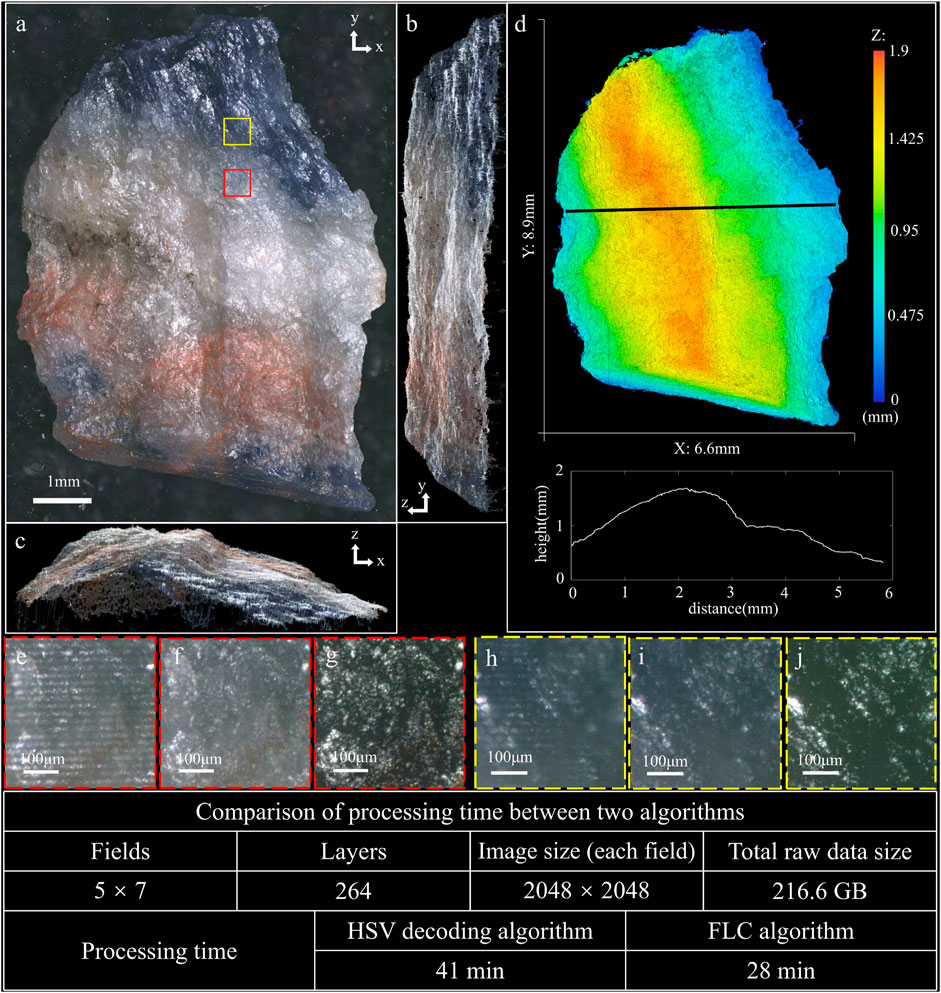
Another mineral sample is blue-veins stone, with mixed colors of blue, white and red. Its blue surface is semitransparent, on which the modulated fringe is difficult to be projected. Figure 4 shows the imaging result of the blue-veins stone, and Supplementary Video S2 presents its reconstructed 3D image. The MIP images along z, x, and y axis are shown in Figures 4A–C, respectively. Figure 4D shows the height map of the sample with the profile along the black line-scan. Figures 4E,H, respectively show the raw images of the white area and blue area with focused modulated fringe, that the modulation depth of fringe in Figure 4H is quite lower than that in Figure 4E. As a result, the HSV decoding algorithm restores the image of the white area fairly well (Figure 4G) compared to the image restored by the FLC algorithm (Figure 4F). However, the color of blue area restored by the HSV decoding algorithm (Figure 4J) fades a lot due to the low modulation depth of fringe, while the FLC algorithm still restores the raw blue color (Figure 4I). The whole 3D image is stitched from 35 data sets (5 rows and seven columns) with 264 layers at 7 μm axial intervals and 2,048 × 2,048 pixels for each field, which means the total raw data is 216.6 GB, and the whole 3D volume is 6.6 mm × 8.9 mm × 1.8 mm. The total image processing time of the HSV decoding algorithm and the FLC algorithm are 41 min and 28 min, which means the processing speed is improved by 46%.

FIGURE 4. 3D imaging result of blue-veins stone (see Supplementary Video S2). (A) MIP image along z axis. (B) MIP image along x axis. (C) MIP image along y axis. (D) Height map of the sample, with the profile along the black line-scan. (E) Raw image of the white area with focused modulated fringe. (F) Image restored by the FLC algorithm corresponding to the region of (E). (G) Image restored by the HSV decoding algorithm corresponding to the region of (E). (H) Raw image of the blue area with focused modulated fringe. (I) Image restored by the FLC algorithm corresponding to the region of (H). (J) Image restored by the HSV decoding algorithm corresponding to the region of (H).
Discussion and conclusion
The RMS operation in Eq. 3 determines that the intensity of optical sections is proportional to the modulation depth. The HSV decoding algorithm is aimed to solve the color distortion caused by chromatic aberration, but it still does not get rid of the dependence on modulation depth and performs poorly when the surface is weakly modulated. The FLC algorithm abandons direct computation of the color optical sections, but firstly figures out the height map through the focus level and then restores the color from wide-field images which are not affected by the modulation depth. Therefore, it thoroughly solves the color restoration problem.
In addition, the FLC algorithm also improves the axial resolution of the reconstructed 3D image. The optical section of traditional OS-SIM has a depth corresponding to the full width at half maximum (FWHM) of spatial frequency intensity distribution [14], leading to unclear profile of its 3D image. However, the FLC algorithm condenses each pixel in the 3D image to its focus position, so the 3D image can precisely display the surface of the sample. Moreover, the 3D image reconstructed by traditional OS-SIM often contains wrong focused pixels (Figure 1C) which appear to be noises and decline the 3D image quality, while the reliability measurement in FLC algorithm eliminates and replaces them, ensuring the accuracy and fineness of the 3D image.
In summary, we present a focus level correlation algorithm for 3D color image reconstruction in OS-SIM, proved to restore color authentically and without affected by chromatic aberration or modulation depth variation, and improve the reconstruction speed by about 45%. Capability of high precision height map measurement and natural color restoration allows OS-SIM to apply in 3D imaging on various kinds of minerals. This technique may find potential applications in geology, material science, and biology, especially analyzing translucent and colorful samples.
Data availability statement
The original contributions presented in the study are included in the article/Supplementary Material, further inquiries can be directed to the corresponding authors.
Author contributions
MW conceived the idea and finished the manuscript. TZ and ML gave guidance and supervised the project. All the authors contributed to the discussion on this manuscript.
Funding
This work was supported by the Natural Science Foundation of China (NSFC) (62135003, 62205267, 62005208, and 62205265), Innovation Capability Support Program of Shaanxi (Program No. 2021TD-57), and Natural Science Basic Research Program of Shaanxi (2022JZ-34, 2020JQ-072, 2022JQ-069, 2022JM-321).
Conflict of interest
The authors declare that the research was conducted in the absence of any commercial or financial relationships that could be construed as a potential conflict of interest.
Publisher’s note
All claims expressed in this article are solely those of the authors and do not necessarily represent those of their affiliated organizations, or those of the publisher, the editors and the reviewers. Any product that may be evaluated in this article, or claim that may be made by its manufacturer, is not guaranteed or endorsed by the publisher.
Supplementary material
The Supplementary Material for this article can be found online at: https://www.frontiersin.org/articles/10.3389/fphy.2022.1041577/full#supplementary-material
References
1. Stoops G, Delvigne J. Morphology of mineral weathering and neoformation. II neoformations. Dev Soil Sci (1990) 19:483–92. doi:10.1016/S0166-2481(08)70363-5
2. Kanouo NS, Zaw K, Yongue RF, Sutherland FL, Meffre S, Njonfang E, et al. Detrital mineral morphology and geochemistry: Methods to characterize and constrain the origin of the Nsanaragati blue sapphires, south-western region of Cameroon. J Afr Earth Sci (2012) 70:18–23. doi:10.1016/j.jafrearsci.2012.05.002
3. Michels J. Confocal laser scanning microscopy: Using cuticular autofluorescence for high resolution morphological imaging in small crustaceans. J Microsc (2007) 227:1–7. doi:10.1111/j.1365-2818.2007.01787.x
4. Conchello JA, Lichtman JW. Optical sectioning microscopy. Nat Methods (2005) 2:920–31. doi:10.1038/nmeth815
5. Helmchen F, Denk W. Deep tissue two-photon microscopy. Nat Methods (2005) 2:932–40. doi:10.1038/nmeth818
6. Aligholi S, Lashkaripour RG, Khajavi R, Razmara M. Automatic mineral identification using color tracking. Pattern Recognit DAGM (2017) 65:164–74. doi:10.1016/j.patcog.2016.12.012
7. Baykan NA, Yılmaz N. Mineral identification using color spaces and artificial neural networks. Comput Geosci (2010) 36:91–7. doi:10.1016/j.cageo.2009.04.009
8. Winter PW, Chandris P, Fischer RS, Wu Y, Waterman CM, Shroff H. Incoherent structured illumination improves optical sectioning and contrast in multiphoton super-resolution microscopy. Opt Express (2015) 23:5327–34. doi:10.1364/OE.23.005327
9. Karadaglić D, Wilson T. Image formation in structured illumination wide-field fluorescence microscopy. Micron (2008) 39:808–18. doi:10.1016/j.micron.2008.01.017
10. Krzewina LG, Kim MK. Single-exposure optical sectioning by color structured illumination microscopy. Opt Lett (2006) 31:477–9. doi:10.1364/ol.31.000477
11. Wang ZJ, Feng K, Yang F, Liang YS, Yun X, Tihelka E, et al. Breathing colour into fossils: A tomographic system for reconstructing the soft tissue microstructure of amber inclusions. Opt Lasers Eng (2022) 148:106775. doi:10.1016/j.optlaseng.2021.106775
12. Neil MA, Juskaitis R, Wilson T. Method of obtaining optical sectioning by using structured light in a conventional microscope. Opt Lett (1997) 22:1905–7. doi:10.1364/ol.22.001905
13. Dan D, Lei M, Yao BL, Wang W, Winterhalder M, Zumbusch A, et al. DMD-based LED-illumination Super-resolution and optical sectioning microscopy. Sci Rep (2013) 3:1116. doi:10.1038/srep01116
14. Dan D, Yao BL, Lei M. Structured illumination microscopy for super-resolution and optical sectioning. Chin Sci Bull (2014) 59:1291–307. doi:10.1007/s11434-014-0181-1
15. Ren FF, Wang ZJ, Qian J, Liang YS, Dang SP, Cai YN, et al. Multi-view object topography measurement with optical sectioning structured illumination microscopy. Appl Opt (2019) 58:6288–94. doi:10.1364/AO.58.006288
16. Zhou X, Lei M, Dan D, Yao BL, Qian J, Yan SH, et al. Double-Exposure optical sectioning structured illumination microscopy based on Hilbert transform reconstruction. PLoS One (2015) 10:e0120892. doi:10.1371/journal.pone.0120892
17. Qian J, Lei M, Dan D, Yao BL, Zhou X, Yang YL, et al. Full-color structured illumination optical sectioning microscopy. Sci Rep (2015) 5:14513. doi:10.1038/srep14513
18. Qian J, Dang SP, Wang ZJ, Zhou X, Dan D, Yao BL, et al. Large-scale 3D imaging of insects with natural color. Opt Express (2019) 27:4845–57. doi:10.1364/OE.27.004845
Keywords: structured illumination microscopy, optical sectioning, natural color, 3D image, focus level correlation algorithm
Citation: Wang M, Zhao T, Wang Z, Feng K, Ren J, Liang Y, Wang S and Lei M (2022) Three-dimensional natural color imaging based on focus level correlation algorithm using structured illumination microscopy. Front. Phys. 10:1041577. doi: 10.3389/fphy.2022.1041577
Received: 11 September 2022; Accepted: 03 October 2022;
Published: 17 October 2022.
Edited by:
Liwei Liu, Shenzhen University, ChinaReviewed by:
Juanjuan Zheng, Xidian University, ChinaLei Gong, University of Science and Technology of China, China
Copyright © 2022 Wang, Zhao, Wang, Feng, Ren, Liang, Wang and Lei. This is an open-access article distributed under the terms of the Creative Commons Attribution License (CC BY). The use, distribution or reproduction in other forums is permitted, provided the original author(s) and the copyright owner(s) are credited and that the original publication in this journal is cited, in accordance with accepted academic practice. No use, distribution or reproduction is permitted which does not comply with these terms.
*Correspondence: Tianyu Zhao, emhhb3RpYW55dUB4anR1LmVkdS5jbg==; Ming Lei, bWluZy5sZWlAbWFpbC54anR1LmVkdS5jbg==
†These authors have contributed equally to this work
 Mengrui Wang
 Tianyu Zhao
 Zhaojun Wang
 Kun Feng
 Jingrong Ren
 Yansheng Liang
 Shaowei Wang
 Ming Lei