 Taiyuan Zhang
 Yuanyuan Guo2
 Yong Deng
95% of researchers rate our articles as excellent or good
Learn more about the work of our research integrity team to safeguard the quality of each article we publish.
Find out more
ORIGINAL RESEARCH article
Front. Phys. , 21 October 2022
Sec. Optics and Photonics
Volume 10 - 2022 | https://doi.org/10.3389/fphy.2022.1037224
This article is part of the Research Topic Physical Model and Applications of High-Efficiency Electro-Optical Conversion Devices, volume II View all 11 articles
As a new type of reflective display technology with paper-like display performance, electrowetting display (EWD) can realize ultra-low power consumption, wide viewing angle and fast response speed. In order to apply the EWD to the large-size display field, an extensible driving model for multiple grayscales colorful EWDs was proposed in this paper. The proposed driving model consisted of a grayscale model, a colorful display model and an extensible driving model. With the grayscale model and the colorful display model, the driving waveform of the colorful grayscale display was designed based on limited output voltage levels of a general-purpose graphic driver chip. And then, the extensible driving model was used to realize the large-size display large-scale display based on a matrix of small-size EWD panels. In addition, an experimental platform, which was composed of the display panel and the driving board with a data interface, was designed based on the proposed models. Experimental results showed that it could realize an 18-bit colorful dynamic display on the extended display matrix with a resolution of 48*16. It was indicated that the display matrix could be used for multiple grayscales and colorful dynamic displays by applying the proposed driving models. The research has brought about a way of enlarging the size of the EWD, which is conducive to broadening the scope of application of EWDs.
With a fast response speed, and electrical reproducibility, electrowetting on dielectrics (EWOD) [1] was increasingly used in microsystems. In particular, it has attracted a lot of attention in the areas of digital microfluidics (DMF) [2–4], lab-on-chip [5, 6], micro-lens [7–9], and EWDs [10]. As a novel type of reflective display technology [11], the EWD has ultra-low power consumption [12] and broad viewing angle. In addition, the EWD does not cause a series of environmental pollution problems. In the past few years, the EWD has made numerous achievements in the fields of display materials [13], driving waveforms [14–16] and component designs [17]. These achievements would be beneficial for the implementation of commercial products or applications, such as E-readers, mobile phones and other mobile terminal devices. However, limited by the current manufacturing process conditions, it is difficult to produce large-size EWD panels which could accommodate the requirements of outdoor billboards and other application scenarios.
In terms of the manufacturing process, a full‐color reflective electrowetting displays with diagonals larger than 6 was presented [18]. At the same time, there were many studies on electrowetting grayscale display, color display and video playback. For an active-matrix display, a large range of brightness levels was obtained by using a limited number of grayscales [19]. In addition, a driving scheme was proposed for obtaining multiple grayscales and quick response on a 6-in. SVGA EWD [20]. A portable driving scheme which could display 4-bit grayscale dynamic video was realized by using an active matrix electrowetting display [21]. What’s more, the optimization of driving waveform [22] is one of the important ways to improve the display performance of electrophoretic displays (EPDs), as well as the EWDs. Research on optimization of driving waveforms [23], response time [24, 25] and display performance provided a guarantee for grayscale display and video refresh for large-size EWD panels in outdoor scenarios. However, these studies were based on small-scale EWDs in indoor application scenarios.
In order to apply EWDs to outdoor advertisement and other fields requiring large-size displays, an extensible driving model for multi-color EWDs based on digital multiplex (DMX) protocol was provided in this paper. The proposed driving schema consisted of a device cascading section and an EWD driving section. In the device cascading section, a Cortex-M3 processor was used as the host controller to parse the image data frame by frame from the DMX protocol. In the driving section, each EWD panel was driven by a dot matrix liquid crystal graphic column driver chip. According to the parsed image data, the control signal for the driver chip was generated by the host controller to display target images.
For EWDs, the structure of pixel consists of glass substrate, indium tin oxide (ITO), hydrophobic insulating layer, pixel wall, colored oil, and conductive liquid. The contact angle of the colored oil on the insulating layer can be controlled by the external electric field applied between a common electrode and a pixel electrode. The relationship between the contact angle and the applied electric field can be described by Young-Lippmann equation [26] which is shown in Equation 1.
Where
Under the action of the electric field, the original equilibrium state in the liquid system may be broken by the change of external electrical field, thus making the droplet on the insulating substrate to deform or displace. When no electric field is applied between the common electrode and the pixel electrode, oil droplets spread naturally into an oil film on the hydrophobic insulating layer. At this point, the pixel is covered with colored oil film to form an “off” state when viewed from the above. When a certain electric field is applied, the oil film is shrunk to a corner of a pixel. Then, a transparent “on” state is formed at this situation. The pixel state under different applied electric fields is shown in Figure 1. By adjusting the applied electrical field, pixels are in different “on” states, grayscales can be obtained. The degree of “on” states depends on the external voltage applied to the pixel electrodes. The small white point in the pixel is an extra pinning structure (EPS) [27], which is used to guide the oil contraction direction and accelerate the switching on process.
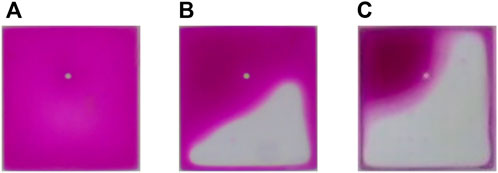
FIGURE 1. The state of pixels under different applied electric fields. (A) When no electric field is applied, the pixel shows the color of oil film. (B,C) are “on” states of a pixel when an electric field is applied. (C) When a maximum voltage is applied, the pixel approaches the most transparent state and the color of the white substrate is displayed.
In EWDs, the degree of colored oil spreading depends on the contact angle according to Young–Lippmann equation. Hence, a grayscale display can be obtained by varying the applied external voltage to change the aperture ratio of pixels. The aperture ratio can be defined as the ratio of the aperture area to the total area of a pixel grid. When the applied voltage is between the breaking voltage and the maximum voltage, the aperture ratio will increase with the increase of voltage. When the applied voltage is between the breaking voltage and the maximum voltage, the opening ratio will increase with the increase of voltage. However, the relationship between the opening ratio and the driving voltage is nonlinear. Therefore, it is necessary to adjust the opening ratio through a well-controlled voltage to achieve more accurate grayscale levels. Most general-purpose graphic driver chips are capable of providing limited voltage levels. For example, HD66204FTL is a dot matrix liquid crystal graphic display column driver with 80-channel outputs. And each channel can output one of the four voltage levels V1, V3, V4 or VEE, as shown in Figure 2A, depending on the combination of the M signal and display data D, as shown in Figure 2B.
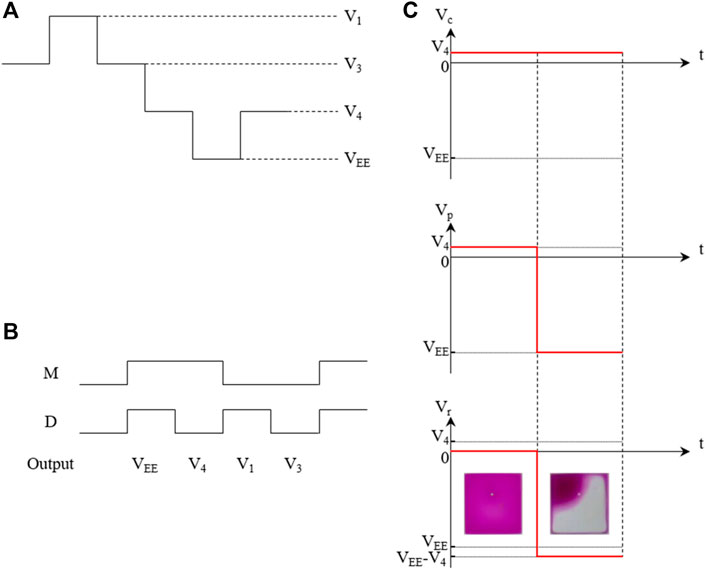
FIGURE 2. The relationship between various voltages. (A) Different power supply voltage levels for the display driver. (B) Selection of the output voltage level. (C) The relationship between pixel state and the voltage applied to the pixel electrode and the common electrode at the time t.
As shown in Figure 2C, if the common electrode voltage Vc is fixed at V4, and the state of the pixel can be switched by changing the pixel electrode voltage Vp. When the voltage Vp is V4, the voltage difference Vr between the pixel electrode and the common electrode is 0. At this point, the pixel can remain “off” state. If the voltage Vp is VEE, and then the voltage difference Vr is VEE-V4. At this situation, the pixel can switch to the “on” state.
A model for multiple grayscale display based on two voltage levels is presented in Figure 3. In the proposed model, the driving cycle of each pixel was divided into 256 subframes. The visual display of the functional relationship is shown in Figure 3A. In addition, Figure 3A also shows actual driving waveforms applied to the pixel in one driving cycle for each grayscale. Figure 3B and Figure 3C show the grayscale display diagrams of single-color and multi-color pixel, respectively.
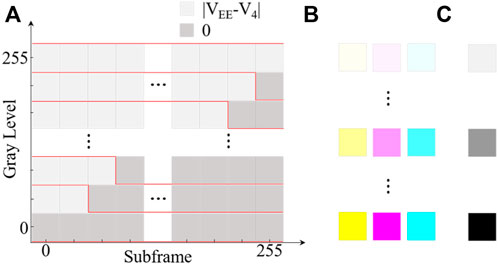
FIGURE 3. Schematic diagram of the model for realizing the multiple grayscales display. (A) The voltage difference between the pixel electrode and the common electrode and the equivalent driving waveform in one refresh period under different grayscales. (B) Multiple grayscales display diagram of a single-color pixel. (C) Multiple grayscale display diagram of a multi-color pixel superimposed by three layers.
In the one driving cycle, the common electrode voltage
In Formula 3,
It can be seen from Formula 4 that 256 different voltage levels are generated based on
In contrast to the active light-emitting display technology, the subtractive primary color system was adopted by EWDs. First of all, this is because the EWD is a reflective technology, and the EWD panel does not emit light. Secondly, Secondly, the subtractive primary color system is conducive to reducing the loss of light energy in the three-layer stack structure of EWD. As shown in Figure 4A, the subtractive primary color system contains three primary colors: yellow, cyan and magenta. Figure 4B shows the display of yellow, cyan and magenta panels and the display effect after being superposition.
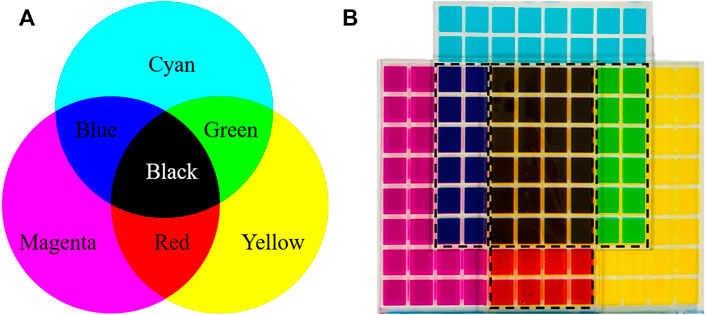
FIGURE 4. Subtractive primary color system. (A) Schematic diagram of three primary colors and their mixing effects in the subtractive primary color system. (B) The subtractive primary color system in EWDs.
When primary colors are mixed in different proportions, other colors in the color system can be displayed. In the colorful EWD panel, the proportion of each primary color in the mixture is controlled by the grayscale of the pixel. For three primary colors of EWD panels, they have different response curves of aperture ratio with voltage. As a result, they cannot be driven to the same grayscale level by the same voltage. Therefore, a lookup table (LUT) containing the voltage levels corresponding to all grayscales should be built for each color of the panel. Assuming that an 18-bit colorful display is to be implemented, the LUT for three color panels can be defined by Formula 5 ∼ Formula 7.
Where
Where elements
In the extensible driving model, every single colorful panel with the data interface is assigned a module address by an address encoder. With the proposed extensible driving model, the colorful panels can be organized in an orderly manner by the address to achieve large-size displays. Figure 5 shows a schematic diagram of the proposed model. The colorful display module is composed of cyan, magenta and yellow panels. The colorful EWD panel used in the model can be regarded as an image with three channels cyan, magenta and yellow. Each pixel of the module needs 3 bytes of data. The data can be obtained using mature data protocols such as DMX. As shown in Figure 5, the mapping relationship between the grayscale of the pixel in a certain position and the data stream can be described by Formula 10.
In Formula 10,
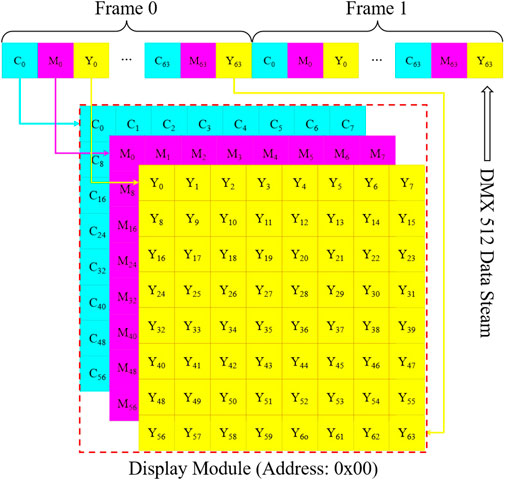
FIGURE 5. An extensible driving mode for large-size display. The mapping relationship between pixel points and DMX data streams. It shows the mapping relationship between grayscale data of colorful display panels and data stream.
The experimental platform was mainly composed of a colorful display module and a driving board, which is shown in Figure 6. The colorful display module was composed of three-color panels cyan, magenta and yellow. In the driving section, in order to establish the mapping relationship between the grayscales of pixel and data stream, an address code was assigned to each display module via an address encoder. The Cortex-M3 processor would acquire the graphic data corresponding to the pixel according to the obtained device address. And then, the image data was converted into a control signal for display drivers to drive three panels. The output of the amplifier provided input reference voltages for display drivers. And the final output of the display driver depended on the control signal.
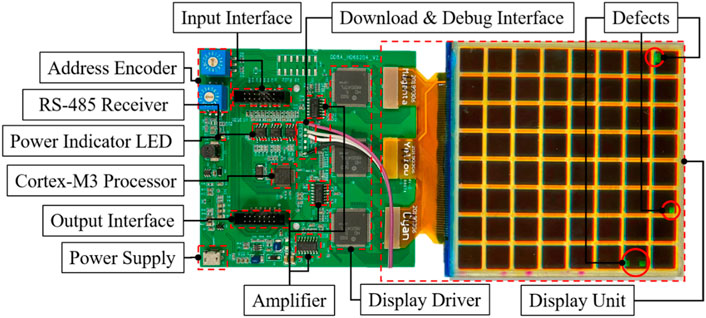
FIGURE 6. The architecture and details of the experimental platform. The experimental platform consisted of a driving board and a display unit. The driving board provided input and output interfaces for DMX signals for the expansion of the display module. It was also responsible for controlling the output voltage applied to pixel electrodes based on the received image data. The display unit had a three-layer color structure. Each panel of the display unit was driven by a graphic driver chip.
The input interface and output interface not only provided an access to data streams but also could be used to provide power for the display module. The display module could also be powered directly through the USB port by accessing an external power supply. To simplify wire connections between display modules, either of the two methods of power supply could be selected flexibly. Yellow, magenta and cyan panels were laminated together to form a display unit for color display. Each color panel contained a pixel matrix with 8 rows and 8 columns.
In the driving board, the Cortex-M3 processor played a very important role in the driving system. Consequently, the design of the program had a direct impact on the display performance of panels. The program could be divided into three parts according to the function of the program: the main program and two interrupt service programs. In the main function, the general-purpose input-output (GPIO), timer, direct memory access (DMA), universal asynchronous receiver transmitter (UART) and other peripherals were initialized in the device startup phase. It was also necessary to enable a timer interruption and a DMA interruption to wait for interrupts. Then, the program entered the main loop to continuously update the DMA buffer based on the received DMX data. When the interrupt was triggered, the program entered the interrupt service runtime (ISR) entry to execute the interrupt service function. Since the DMX data received by the display module was address-dependent, the timer interrupts service function was used to read the device address periodically at a frequency of once per second. In addition, based on our previous research on charge trapping [28], a periodic reset signal was introduced to suppress the impact of oil backflow [29] caused by charge trapping. And the reset signal was also generated in the timer interrupt function. In the external interrupt function of GPIOs, the PA7 pin was used to detect the mark after break (MAB) signal and BREAK signal in the DMX protocol to determine the start and end point of the DMX data. And then the complete DMX data was transferred to the image buffer via DMA.
In Figure 7, panels with eight rows and eight columns were used in the experiment. Sixty-four different voltage levels generated according to the grayscale model were applied to pixel electrodes. As can be seen from experimental results, both the single-color panel and the colorful panel showed several obvious grayscales. It was indicated that the required voltage level for grayscale display could be equivalent to just two different voltage levels with the proposed grayscale model. It should be noted that the voltage difference should be as close as possible to the driving voltage of the EWD panel. If the difference between two voltages was too low, the aperture ratio of the pixel could not reach the maximum, or even the pixel could not be opened at all. Conversely, if the difference between the two voltages was too high, it may cause permanent damage to the pixel structure. Limited by the upper limit and the non-linear characteristics of the aperture ratio, it was difficult to achieve 256 level grayscale display as expected.
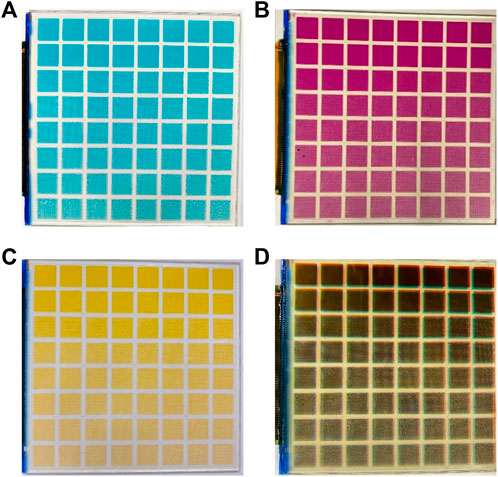
FIGURE 7. The grayscale display of the single-color panel and the colorful panel. (A) Cyan panel. (B) Magenta panel. (C) Yellow panel. (D) Colorful panel with a three-layer color structure.
When the grayscale of pixels in each single-color panel was controlled according to the grayscale model, the three-color panels were superimposed together to form a colorful display based on the subtractive primary color system. In Figure 8, the colorful image displayed on the EWD panel at a different moment in the dynamic display was displayed. Images of displayed scenes were generated by the host software such as DMX controller software. And then, the data stream of images was transferred to display modules via the input interface. Finally, display driver chips were controlled by the driving board to generate the desired driving waveform in real time according to the color display model. In this way, dynamically changing colorful images were constantly displayed on the EWD panel.
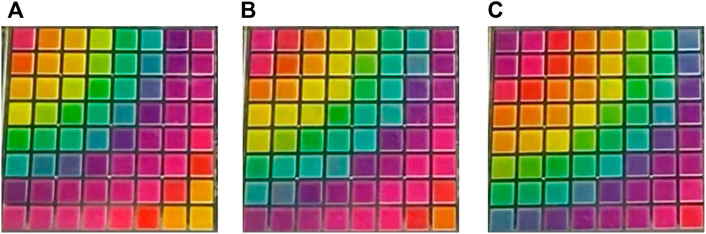
FIGURE 8. The colorful dynamic display of the EWD panel. In the experiment, a dynamic picture of color gradient was played on the panel, (A), (B,C) were colorful images displayed on the EWD panel at different moments in dynamic display.
In Figure 9, the image displayed on the extended EWD was one of figures contained in the dynamic scene. The extended display was a display matrix assembled by twelve display modules. The current resolution of the extended screen was 48*16. Of course, it was also possible to assemble a higher resolution extended screen with more display modules according to the mentioned driving model. The images displayed on the screen were updated in real-time according to scenes created in advance with the DMX controller software.
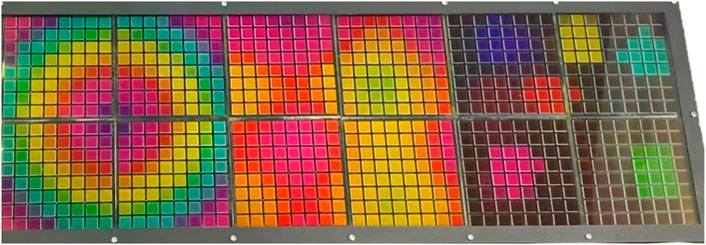
FIGURE 9. The colorful image displayed on the extended EWD is composed of a dozen display modules.
In this paper, the grayscale model, colorful display model and extensible model were proposed based on a small-size EWD panel. By applying the proposed display models and the driving model, the grayscale display, 18-bit colorful dynamic display and large-size display were realized on the experimental platform. In addition, the reset signal was introduced into the proposed models to improve the display performance. The proposed driving schema has the advantages of simple implementation, low cost, and high scalability due to a mature communication protocol and a common EWDs panel, and it could be applied to other types of display fields.
The raw data supporting the conclusions of this article will be made available by the authors, without undue reservation.
TZ contributed to the conceptualization, investigation, experiment, data analyses and wrote the manuscript. YG performed a part of experiment and the data analyses. YD helped perform the analysis with constructive discussions. HS contributed to the conception, funding acquisition, resources and supervision. All authors discussed the results and contributed to the final version of the manuscript.
This research was funded by the National Key Research and Development Program of China (No. 2021YFB3600601), Science and Technology Program of Guangzhou (No. 2019050001), Program for Guangdong Innovative and Enterpreneurial Teams (No. 2019BT02C241), National Natural Science Foundation of China (Nos. 22008156, 12004119), Guangdong Provincial Key Laboratory of Optical Information Materials and Technology (No. 2017B030301007), Guangzhou Key Laboratory of Electronic Paper Displays Materials and Devices (201705030007), MOE International Laboratory for Optical Information Technologies and the 111 Project.
YG and YD were employed by the Company Shenzhen Guohua Optoelectronics Technology Co., Ltd.
The remaining authors declare that the research was conducted in the absence of any commercial or financial relationships that could be construed as a potential conflict of interest.
All claims expressed in this article are solely those of the authors and do not necessarily represent those of their affiliated organizations, or those of the publisher, the editors and the reviewers. Any product that may be evaluated in this article, or claim that may be made by its manufacturer, is not guaranteed or endorsed by the publisher.
1. Berge B. Electrocapillarity and wetting of insulator films by water. Comptes Rendus de l'Academie des Sci - Ser Math (1993) 317:157–63.
2. Gong J, Kim C. All-electronic droplet generation on-chip with real-time feedback control for ewod digital microfluidics. Lab Chip (2008) 8(6):898–906. doi:10.1039/b717417a
3. Samiei E, Tabrizian M, Hoorfar M. A review of digital microfluidics as portable platforms for lab-on a-chip applications. Lab Chip (2016) 16(13):2376–96. doi:10.1039/c6lc00387g
4. Feng H, Yi Z, Yang R, Qin X, Shen S, Zeng W, et al. Designing splicing digital microfluidics chips based on polytetrafluoroethylene membrane. Micromachines (2020) 11(12):1067. doi:10.3390/mi11121067
5. Srinivasan V, Pamula V, Fair R. An integrated digital microfluidic lab-on-a-chip for clinical diagnostics on human physiological fluids. Lab Chip (2004) 4(4):310–5. doi:10.1039/b403341h
6. Torabinia M, Asgari P, Dakarapu U, Jeon J, Moon H. On-chip organic synthesis enabled using an engine-and-cargo system in an electrowetting-on-dielectric digital microfluidic device. Lab Chip (2019) 19(18):3054–64. doi:10.1039/C9LC00428A
7. Yang S, Krupenkin T, Mach P, Chandross E. Tunable and latchable liquid microlens with photopolymerizable components. Adv Mater (2003) 15(11):940–3. doi:10.1002/adma.200304745
8. Berge B. Liquid lens technology: Principle of electrowetting based lenses and applications to imaging. In: Proceedings of the 18th IEEE International Conference on Micro Electro Mechanical Systems; 30 January 2005 - 03 February 2005; Miami Beach, FL, USA (2005). p. 227–30. doi:10.1109/MEMSYS.2005.1453908
9. Hu X, Zhang S, Qu C, Zhang Q, Lu L, Ma X, et al. Ionic liquid based variable focus lenses. Soft Matter (2011) 7(13):5941–3. doi:10.1039/C1SM05585B
10. Hayes R, Feenstra B. Video-speed electronic paper based on electrowetting. Nature (2003) 425(6956):383–5. doi:10.1038/nature01988
11. Bai P, Hayes R, Jin M, Shui L, Yi Z, Wang L, et al. REVIEW of PAPER-LIKE display technologies (invited review). Prog Electromagnetics Res (2014) 147:95–116. doi:10.2528/PIER13120405
12. Li W, Wang L, Zhang T, Lai S, Liu L, He W, et al. Driving waveform design with rising gradient and sawtooth wave of electrowetting displays for ultra-low power consumption. Micromachines (2020) 11(2):145. doi:10.3390/mi11020145
13. Lee P, Chiu C, Lee T, Chang T, Wu M, Cheng W, et al. First fabrication of electrowetting display by using pigment-in-oil driving pixels. ACS Appl Mater Inter (2013) 5(13):5914–20. doi:10.1021/am401840b
14. Chen Y, Chiu Y, Lee Y, Liang C. 56.3: A charge trapping suppression method for quick response electrowetting displays. SID Symp Dig (2010) 41(1):842–5. doi:10.1889/1.3500607
15. Zhang T, Deng Y. Driving waveform design of electrowetting displays based on a reset signal for suppressing charge trapping effect. Front Phys (2021) 9:672541. doi:10.3389/fphy.2021.672541
16. Yi Z, Zhang H, Zeng W, Feng H, Zhang C, Liu L, et al. Review of driving waveform for electrowetting displays. Front Phys (2021) 9:728804. doi:10.3389/fphy.2021.728804
17. Yi Z, Feng H, Zhou X, Shui L. Design of an open electrowetting on dielectric device based on printed circuit board by using a parafilm M. Front Phys (2020) 8:193. doi:10.3389/fphy.2020.00193
18. Feenstra J, Schram I, Evans M, Vermeulen P, Cometti C, Weert M, et al. 33.2: Large size full-color ereader displays based on electrowetting. SID Symp Dig (2012) 41(1):480–3. doi:10.1889/1.3500499
19. Dijk R, Feenstra B, Hayes R, Camps I, Boom R, Wagemans M, et al. 68.3: Gray scales for video applications on electrowetting displays. John Wiley & Sons, Ltd (2012) 37(1):1926–9. doi:10.1889/1.2433427
20. Chiu Y, Liang C, Chen Y, Lee W, Chen H, Wu S. Accurate-gray-level and quick-response driving methods for high-performance electrowetting displays. J Soc Inf Disp (2011) 19(11):741. doi:10.1889/jsid19.11.741
21. Zhi J, Wei N, Lin W, Xie S, Zhou G. Portable multi-gray scale video playing scheme for high‐performance electrowetting displays. J Soc Inf Disp (2016) 24(4-6):345–54. doi:10.1002/jsid.444
22. Yi Z, Zeng W, Ma S, Feng H, Zeng W, Shen S, et al. Design of driving waveform based on a damping oscillation for optimizing red saturation in three-color electrophoretic displays. Micromachines (2021) 12(2):162. doi:10.3390/mi12020162
23. Lai S, Zhong Q, Sun H. Driving waveform optimization by simulation and numerical analysis for suppressing oil-splitting in electrowetting displays. Front Phys (2021) 9:720515. doi:10.3389/fphy.2021.720515
24. Yi Z, Huang Z, Lai S, He W, Wang L, Chi F, et al. Driving waveform design of electrowetting displays based on an exponential function for a stable grayscale and a short driving time. Micromachines (2020) 11(3):313. doi:10.3390/mi11030313
25. Zeng W, Yi Z, Zhao Y, Zeng W, Zhou G, Zhou X, et al. Design of driving waveform based on overdriving voltage for shortening response time in electrowetting displays. Front Phys (2021) 9:642682. doi:10.3389/fphy.2021.642682
26. Wikramanayake E, Bahadur V. Characterization of oscillation amplitude of contact angle during ac electrowetting of water droplets. J Phys Commun (2020) 4(6):065016. doi:10.1088/2399-6528/ab9ea1
27. Dou Y, Tang B, Groenewold J, Li F, Yue Q, Zhou R, et al. Oil motion control by an extra pinning structure in electro-fluidic display. Sensors (2018) 18(4):1114. doi:10.3390/s18041114
28. Wu H, Dey R, Siretanu I, Ende D, Shui L, Zhou G, et al. Electrically controlled localized charge trapping at amorphous fluoropolymer–electrolyte interfaces. Small (2019) 16(2):1905726. doi:10.1002/smll.201905726
Keywords: electrowetting display (EWD), driving model, multiple grayscales, driving waveform, dynamic display
Citation: Zhang T, Guo Y, Deng Y and Sun H (2022) An extensible driving model for multiple grayscales colorful electrowetting displays. Front. Phys. 10:1037224. doi: 10.3389/fphy.2022.1037224
Received: 05 September 2022; Accepted: 10 October 2022;
Published: 21 October 2022.
Edited by:
Feng Chi, University of Electronic Science and Technology of China, ChinaReviewed by:
Qingming Chen, Sun Yat-sen University, ChinaCopyright © 2022 Zhang, Guo, Deng and Sun. This is an open-access article distributed under the terms of the Creative Commons Attribution License (CC BY). The use, distribution or reproduction in other forums is permitted, provided the original author(s) and the copyright owner(s) are credited and that the original publication in this journal is cited, in accordance with accepted academic practice. No use, distribution or reproduction is permitted which does not comply with these terms.
*Correspondence: Hailing Sun, aGFpbGluZy5zdW5AbS5zY251LmVkdS5jbg==
Disclaimer: All claims expressed in this article are solely those of the authors and do not necessarily represent those of their affiliated organizations, or those of the publisher, the editors and the reviewers. Any product that may be evaluated in this article or claim that may be made by its manufacturer is not guaranteed or endorsed by the publisher.
Research integrity at Frontiers
Learn more about the work of our research integrity team to safeguard the quality of each article we publish.