 Hongxiang Xue1,2
 Jinxin Chen1,2Qi’an Ding1,2Yuwen Sun1,2Mingxia Shen2,3*Longshen Liu2,3Xudong Chen4Junyi Zhou4
- 1School of Engineering, Nanjing Agricultural University, Nanjing, China
- 2Key Laboratory of Breeding Equipment, Ministry of Agriculture and Rural Affairs, Nanjing, China
- 3School of Artificial Intelligence, Nanjing Agricultural University, Nanjing, China
- 4Sheyang County Bureau of Agriculture and Rural Affairs, Yancheng, China
Estrus detection is an essential operation in the breeding of sows, and accurate estrus detection is immensely important to maintain the productivity and reproductive performance of sow. However, traditional sow estrus detection relies on the manually back-pressure test, which is time-consuming and labor-intensive. This study aimed to develop an automatic method to detect estrus. In this study, a model based on the optimized yolov5s algorithm was constructed to detect the four sow postures of standing, sitting, sternum, lateral, and calculated the frequency of posture change in sows. Based on this, we studied the behavior of sows before and after estrus. The method embedded a convolutional block attention module into the backbone network to improve the feature extraction capability of the model. In addition, the object box judgment module was used to avoid interference from other sows in the detection region. Accelerate the optimized model on the TensorRT platform, ensuring that the embedded graphics card can run the model with lower latency. The result shows that the precision of estrus detection is 97.1%, and the accuracy of estrus detection is 94.1%. The processing time of a single image on the embedded graphics card is 74.4 ms, and this method could better meet the estrus detection demand in sow production.
1 Introduction
Estrus detection is an important link in reproductive management of sows, and the accuracy and timeliness of estrus detection directly affect the judgments of swine farm workers on ovulation time in post-weaning sows [1]. Behavioral expression of sow is a reflection of dynamic changes of hormone levels [2]. In estrus, sow rest time decreased, frequency and duration of activity, and standing time increased. Real-time detection of the sow posture helps to automatically monitor their estrus status and health status [3].
Some scholars have done some studies about sow’s visits to boars or bionic boars. Houwers 1988) [4] used a ‘ticket-window’ to monitor the frequency of boar visits, and the results showed that when sows were estrus, the frequency of sow visits gradually increased significantly. However, when multiple sows were present in the detection area, the system could not detect the estrus status of the sows. In order to solve the above problems, Bressers et al 1995) improved the ‘ticket-window’ and divided the data into subsets according to time, the accuracy rate of the proposed method was over 90%, and the false negative rate was less than 5% [5]. On this basis, Korthals 1999) comprehensively considered the sow’s behavior of visiting boars and the activity of individual sows. The sensitivity and accuracy of the model were further improved, but the response time of the system was slow [6]. To reduce response time and the number of false alarms, Ostersen et al (2010) modeled separately the duration and frequency of sow visits, and then fused the two models. The results showed that the model was more specific than this previous study [7]. The above studies are all based on the ‘ticket window’ of boars, but few studies have been reported based on the ‘contact window’ of bionic boars. Lei et al (2021) used bionic boar and image acquisition device to detect estrus in sows. The results showed that the interaction frequencies during the estrus period was significantly higher than that of sows during the non-estrus period [8]. In summary, the use of boars or bionic boars to detect estrus is an effective method. However, in recent years, with the outbreak of African swine fever, large-scale pig farms have begun to reduce the use of boars.
In order to solve the problem mentioned above, many scholars began to try to find some reliable alternative methods. Bressers 1993) used an accelerometer and set activity thresholds to detect estrus in sows. Findings showed that the acceleration change range of sows during the estrus period was significantly higher than that of sows during the non-estrus period [9]. However, due to some factors such as service life, wearable sensors cannot be popularized and applied in large-scale pig farms. Freson et al 1998) used infra-red sensor to continuously monitor the body activity of the sows. According to the results, when using the daily body activity of sows as the model parameters, the accuracy rate of the estrus of sows was 86% [10]. This study is the first published literature on estrus detection in individually housed sows. Jeong et al (2013) used the wireless sensor network to measure the activity in real time, and found that sows in estrus increase in activity [11]. Wang et al (2020) put posture sensors on the neck of the sows to collect the posture data, the results showed that when the recognition time of estrus behavior was 30 min, the recognition error rate was 13.43%, the recall rate was 90.63%, and the specificity was 81.63% [12]. However, the device used in this study needs to be worn on the neck of the sow and cannot work for long periods of time. According to the above, it is feasible to predict the estrus time of a sow through detecting the frequency of posture change in sows.
With the development of the deep learning theories and edge-computing device, the convolutional neural network (CNN) has been widely applied in image classification, image segmentation, object detection [13]. However, most traditional CNN is limited by hardware resource, and made it difficult to be deployed in the edge device or mobile terminal. Lightweight design is the major Frontier to improve the detection speed and minimize expenditures [14, 15]. At present, lightweight CNN has been gradually applied in space target detection, unmanned aerial systems (UAS) and so on [16].
In modern sow production, estrus detection in sows still rely largely on workers’ experience. After stimulation of the ribs, abdomen and vulva, the estrus state is determined according to the back-pressure test. However, this method is often time-consuming and laborious and mainly depend on the experience of the breeders, which is difficult to meet the needs of real-time detection of sows in modern large-scale sow production.
In response to the above problems, this paper proposes an automatic estrus detection method based on lightweight CNN, and deploy it on a low-cost embedded GPU. This research approach is highly automated, contactless. The main contributions of this paper are presented as follows.
1) The YOLOv5s model was used as the base models, and added a convolutional block attention module (CBAM) for feature fusion.
2) The estrus status of sows was analyzed according to the frequency of posture change in sows.
3) The posture change characteristics of different types of abnormal estrus sows was further explored.
2 Materials and methods
All experimental design and procedures of this study were approved by the Animal Care and Use Committee of Nanjing Agricultural University, in compliance with the Regulations for the Administration of Affairs Concerning Experimental Animals of China (Certification No. SYXK [Su]2011-0036).
2.1 Animals, housing, data acquisition
The data were collected at the Shangbao pig farm, Yancheng City, Jiangsu Province, from 15 September 2021 to 12 January 2022.72 sows (Yorkshire × Landrace). We used 72 empty sows (Yorkshire × Landrace) that were second or third parity sows. They were transferred to gestation crates (2.2 m × 0.8 m × 0.7 m) after lactation. House temperature was maintained at 24–27 °C, and the relative humidity was 66–82%.
The video acquisition system was mainly composed of three parts: the camera, the wireless, the embedded graphics card (GPU). The system designed for this study is shown in Figure 1. The RGB camera (DS-2CD3346WD-I, HIKVISION, Hangzhou, China) was installed 2.3 m above the gestation crate. Each camera was connected to an embedded GPU (Jetson Nano 4 GB Developer Kit, Navidia, America) via an ethernet cable. For the image acquisition device, the acquisition frequency was set to 1,500 fps, and the resolution was 2,560 (horizontal resolution) ×1,440 (Vertical resolution). The wireless is used for data transmission, and the embedded GPU is used for data processing. During the experiment, the estrus of sows was detected by artificial estrus check and hormone determination. The estrus frequency was checked twice a day, at 9:00 a.m. and 3:00 p.m.
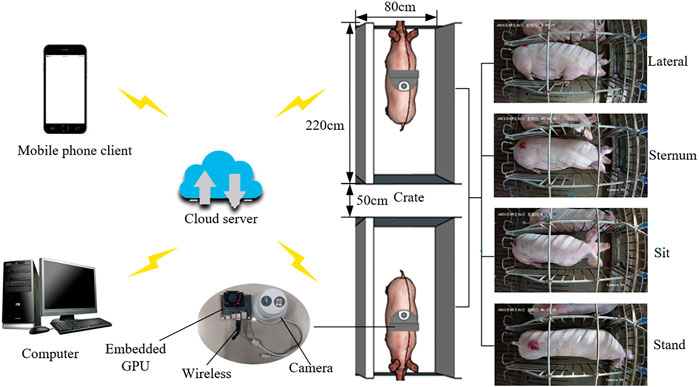
FIGURE 1. Sketch of video acquisition.
2.2 Data set realization
Compared with the sows in non-estrus, most sows in estrus are more active. In order to compare the activity of sows in estrus and non-estrus, the postures were divided into four categories, including lateral, sternum, sit, stand. The definition of each posture is shown in Table 1.
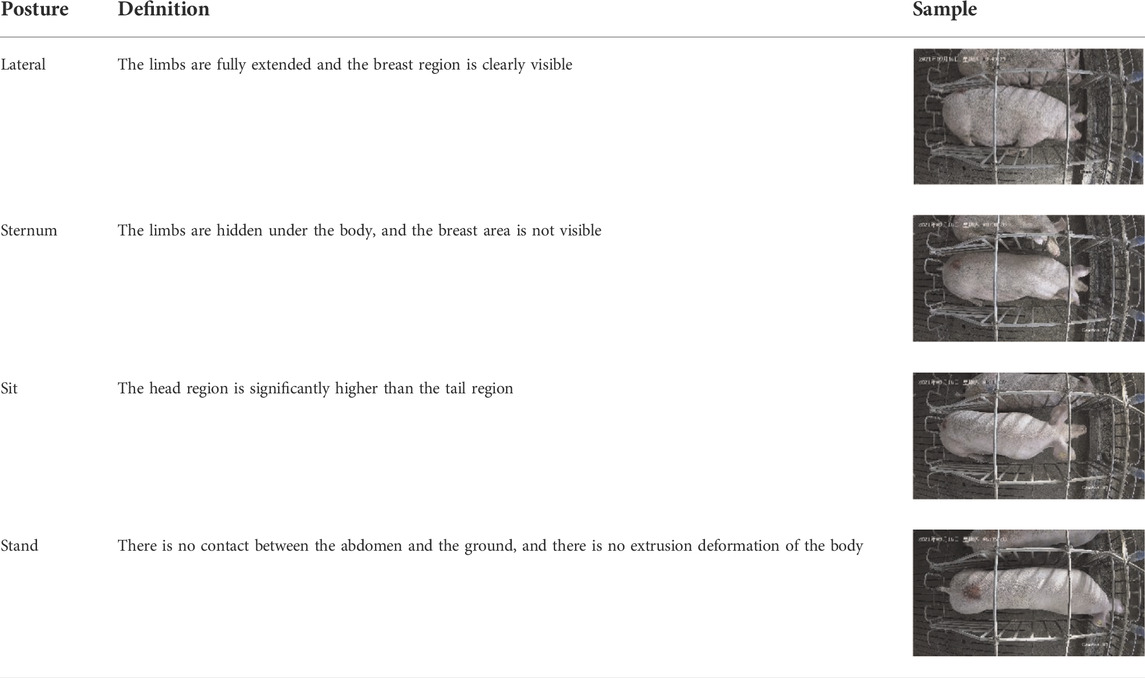
TABLE 1. Definition of different sow postures.
In order to improve the generalization ability of the model and ensure that the dataset could cover different times, 6,000 pictures were selected as data samples. Furthermore, the images with high similarity were removed, and a total of 5,863 pictures were saved. In these pictures, sows in four different postures (stand, sit, sternum, lateral) were annotated using LabelImg software. The dataset is randomly partitioned into three subsets: 80% of them as the training set, 10% as the validation set, and the remaining 10% as the testing set.
2.3 Model building
This study developed a new method for estrus detection in sows. The flow of the estrus detection algorithm is presented in Figure 2. First, the images of the sows were captured regularly using an embedded GPU. Second, use the optimized yolov5 algorithm to detect the posture of the sow. Third, the object box judgment module determines the coordinates of the sow to be tested and outputs the posture with the highest confidence. Fourth, according to the results of sow posture detection, the frequency of posture transition before and after the sow estrus and the activity characteristics of abnormal estrus sows were analyzed. There are four types of abnormal estrus sows studied in this paper, namely silent estrus, persistent estrus, repeating estrus and postpartum anestrus. The silent estrus sows are reduced feed intake and restlessness, but no significant changes in vulva color and shape. The persistent estrus sows remain depressed or excited, and their estrus go exceeded the normal period, even for more than 10 days. The estrus duration of repeating estrus sows is short, and it heat up again a few days later. The postpartum anestrus sows have no change in feed intake, no estrus symptoms, and no estrus within 10 days after weaning.
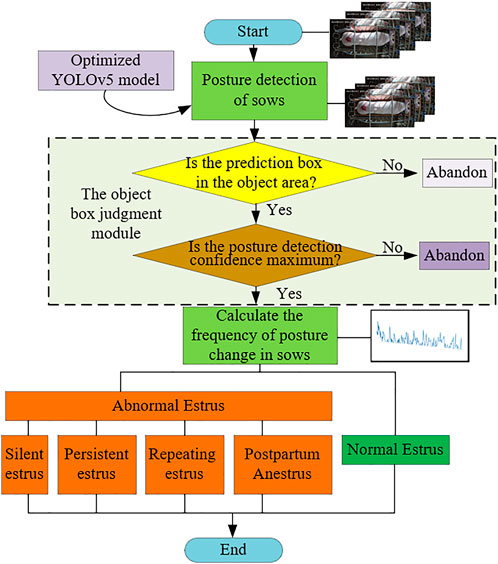
FIGURE 2. The flow of the estrus detection algorithm.
2.3.1 Program environment and training parameter
The model of this paper relies on the Pytorch1.6 deep learning framework. The processor model of the test platform is Intel® CoreTM i7 - 11700 k, the graphics card model is NVIDIA GTX3090, and the graphics card memory is 24G. The deep learning environments such as Python3.8, CUDA11.4, and Opencv4.5.1 are configured on the Ubuntu18.04. Optimized model applied to embedded GPU. The number of epochs was set to 300 to allow adequate time for model convergence.
2.3.2 Basic model
YOLOv5 was selected to work as the base model in this study. According to different network depth and width, YOLOv5 can be divided into four basic network structures: YOLOv5s, YOLOv5m, YOLOv5l and YOLOv5x [17]. The model is mainly composed of four modules: the input module, the backbone module, the neck module, the prediction module. The input module is used to input the image of sow posture, the backbone module for sow posture image feature extraction, the neck module for sow posture image feature fusion, and the prediction module for sow position prediction [18].
In input module, to improve generalization of the model, image mosaic is used to enhance the datasets [19]. In backbone module, it mainly includes the focus structure and the cross stage partial Network (CSPNet). Among them, the focus structure is mainly used to complete the slice operation, to extract the posture features more fully, and effectively to reduce the loss of data in the down-sampling process. The CSPNet is mainly used to reduce the computational bottleneck and memory overhead. Optimizing the core network with CSPNet can improve the model detection performance, enhance the learning ability of CNN, and fully reduce the computation and inference time. In neck module, it mainly includes the feature pyramid network (FPN) and the path augmentation network (PAN). Among them, FPN uses a top-down architecture to fuse the feature of high-level layers. Conversely, PAN uses a down-top architecture to transfer strong location features. In prediction module, to improve location precision and recognition accuracy, we used the generalized intersection over union (GIoU _loss) as the loss foundation [20].
The performance evaluation indicators of the sow posture classification model mainly include model size, precision, recall, f1score, detection speed, parameters, The calculation method of precision is shown in Eq. 1, the calculation method of recall is shown in Eq. 2, and the calculation method of f1score is shown in Eq. 3.
2.3.3 The object box judgment module
The accurate detection of sow posture to be tested is the basis of analyzing sow estrus status. Since multiple sows appear in the region to be tested, we set a rectangular bounding box surrounded by four pixels [150,350], [2,380,350] [150,1,020], and [2380,1020]. Furthermore, due to the existence of transition posture, a single sow has multiple output results. To solve this issue, a judgment module was added after the prediction module, and this ensured that the output is the highest degree of confidence score.
2.3.4 CBAM module
Due to the influence of sow body pollution and poor light conditions, it is difficult to extract the characteristics of limbs, breast region and abdominal areas. Using the attention mechanism can suppress the redundant background information, enhance the feature representation of the sow limb parts in the image, and improve the recognition performance of the posture detection model. The channel attention and spatial attention are combined in the reverse residual block to highlight the target features in the feature graph generated by the deep convolution and improve the recognition performance of the model [21, 22]. The output feature map of the CBAM module acting on the deep convolution. CBAM is a simple and efficient attention module for feed-forward CNN, which takes a given feature map in turn along the channel attention module (CAM) and the spatial attention module (SAM). CBAM can assist the sow posture detection model to locate the region of interest and suppress useless information. The overall flow of the CBAM module is shown in Figure 3.
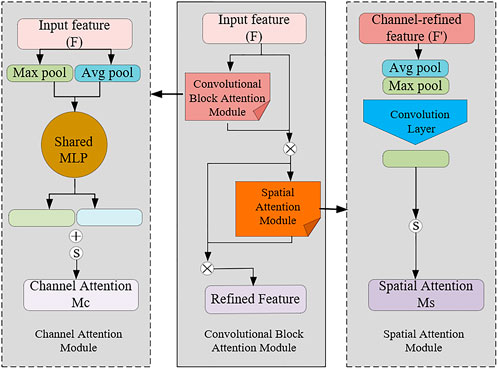
FIGURE 3. CBAM structure.
In Figure 3, MC represents channel attention in the Convolutional Block Attention Model, and MS represents spatial attention model. The Mc calculation formula is shown as in Eq. 4, The MS calculation formula is shown as in Eq. 5.
In Eq. 4, MLP is a Multi-Layer Perceptron Neural network [23], Avg pool () represents the module averaging pooling of the feature graph, Max pool () means the module maximizing pooling of the feature graph, and
In Eq. 6: Cat represents the connection operation,
2.3.5 Model lightweight
To achieve rapid inference of the posture classification model, the CNN model was optimized. First, to ensure that the embedding can run this model with higher throughput and lower latency, we remove the useless output layer in the model. Second, to achieve the vertical integration of the network structure, the three layers of CONV, BN, and Leaky Relu were integrated into one CBL layer. Third, to achieve a horizontal combination of the network structures, the three 1 × 1 CBL layers were fused into one 1 × 1 CBL layer. Fourth, to reduce the transmission throughput, the contact layers in the network structure were removed. After completing the above steps, the model was deployed to the embedded GPU. The model lightweight procedure is shown in Figure 4.
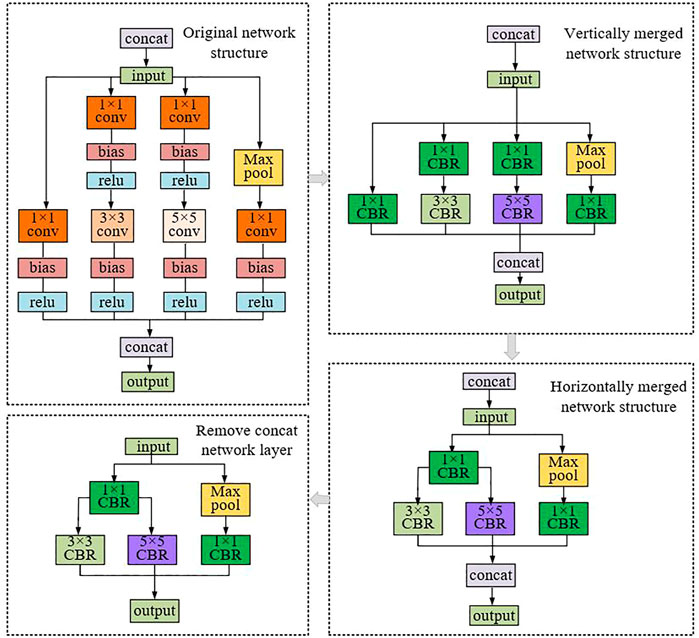
FIGURE 4. The lightweight process of the model.
2.3.6 Contrast models
In order to select the optimal model, this study compared the detection performance of different size YOLOv5 models (YOLOv5x, YOLOv5l, YOLOv5m, YOLOv5s), multiple attention mechanisms, including CAM, efficient channel attention module (ECA), and squeeze and excitation module (SE) [25, 26]. In addition, this study compared the optimization effect of the bidirectional feature pyramid network and the attention mechanism. Furthermore, we compared the proposed model with some representative lightweight object detection models, including MobileDets, NanoDet. MobileDets is a model based on the extended search space series, which can achieve a better balance between delay and accuracy on mobile devices [27]. NanoDet is an ultra-fast and lightweight mobile Anchor-free object detection model, and it is also convenient for training and transplantation [28, 29].
3 Results and Discussion
In Section 3.1, this study analyzes the training and testing results of the model. In Section 3.2, Section 3.3 and Section 3.4, the sow posture detection performance of different models is compared. In Section 3.5, the detection performance of the model on night and daytime data is tested. In Section 3.6, the characteristics of the frequency of posture change in empty sows before and after estrus are analyzed and tested. In Section 3.7, the characteristics of the frequency of posture change in abnormal estrus sows were explored. In Section 3.8, The shortcomings of the study are analyzed.
3.1 Training and testing results
The loss curve for posture detection model is shown in Figure 5A. Train/Box_loss, Train/Obj_loss, Train/Cls_loss represent the position coordinate prediction loss, confidence prediction loss, and category prediction loss of the training dataset, respectively. Val/Box_loss, Val/Obj_loss, Train/Cls_loss represent the position coordinate prediction loss, confidence prediction loss, and category prediction loss of the validation dataset set, respectively. In the initial stage, the loss value decreases rapidly, and then gradually stabilizes, which means that the model gradually converges.
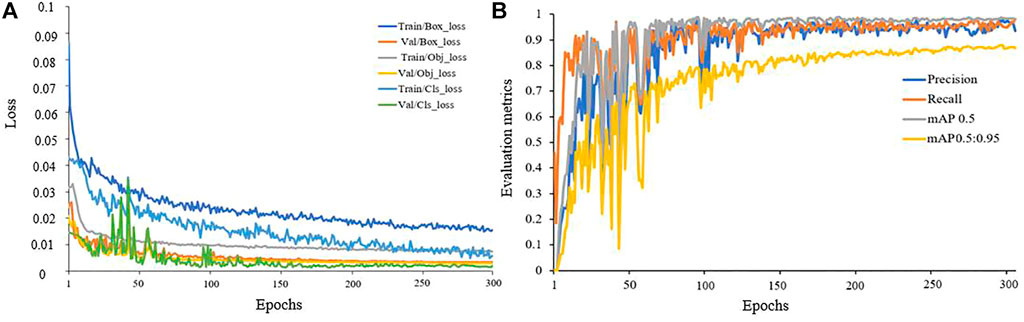
FIGURE 5. Training and test results for the sow posture detection model. (A) Loss curve (B) Evaluate metrics curve.
Figure 5B shows the test results of the sow posture detection model. Where mAP 0.5 is the mean average precision (mAP) of IoU (Intersection over Union) at 0.5, mAP 0.5:0.95 is the average of IoU in the threshold range [0.5,0.95] (the average precision is calculated every 0.05). As can be seen from the four curves, the model can converge quickly and has high detection performance.
To evaluate the detection performance of the model, we plotted and analyzed the PR curve, The PR curve is formed by the precision and recall rate of the model. Among them, the recall (R) is the x-axis, and the precision (P) is the y-axis. It can be seen from Figure 6 that as the recall continues Increase, precision gradually decreases, and gradually reaches a balance point. At this time, recall and precision are both above 95%, which shows that the model has better performance for sow posture detection.
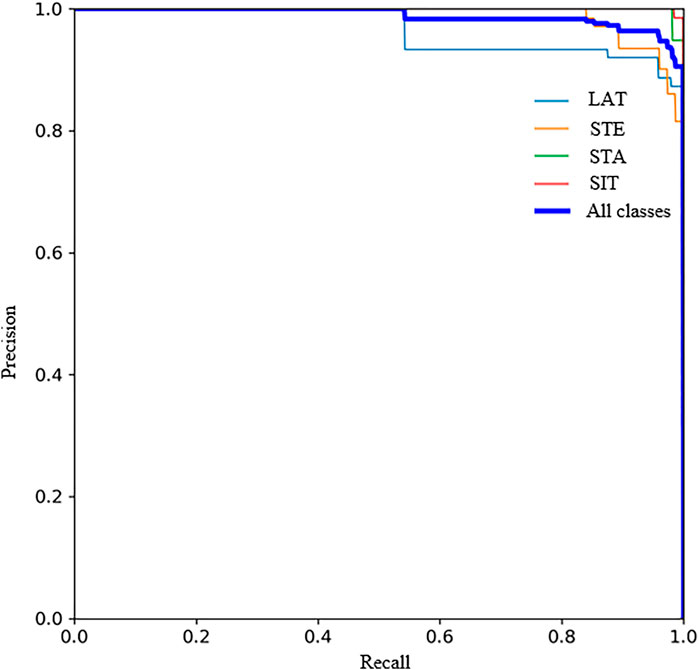
FIGURE 6. P-R curve.
3.2 Results of YOLOv5
Test results for different sizes of YOLOv5 are shown in Table 2. YOLOv5s is the network with the smallest depth and the smallest width of the feature map in the YOLOv5 series. Although the detection accuracy is slightly lower than YOLOv5l, and the recall rate is slightly lower than that of YOLOv5m, it still can maintain a high F1score, and the number of parameters and the detection times are greatly reduced. The model size is only 14.4 MB, which can meet the deployment and use of embedded GPU. Therefore, YOLOv5s is selected for further optimization in this paper.
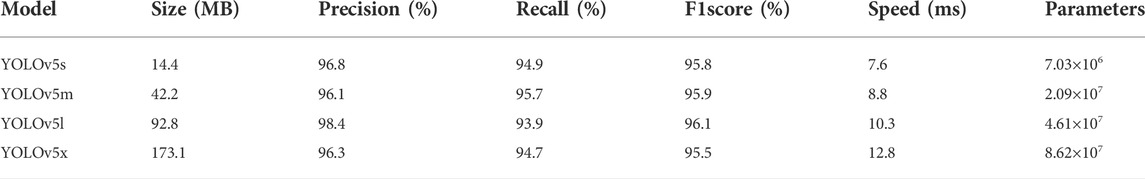
TABLE 2. Experimental results of YOLOv5 with different sizes.
3.3 Results of optimization methods
The test results of different optimization methods are shown in Table 3. The Bi-FPN network has the best effect on improving the precision of model detection, but with slightly lower recall. Among the optimization methods based on attention mechanism, ECA module has the best effect on improving the precision of the model, and SE module has the best effect on improving the precision of the model. Based on different evaluation indexes, CBAM module has the best comprehensive improvement effect on sow posture detection.
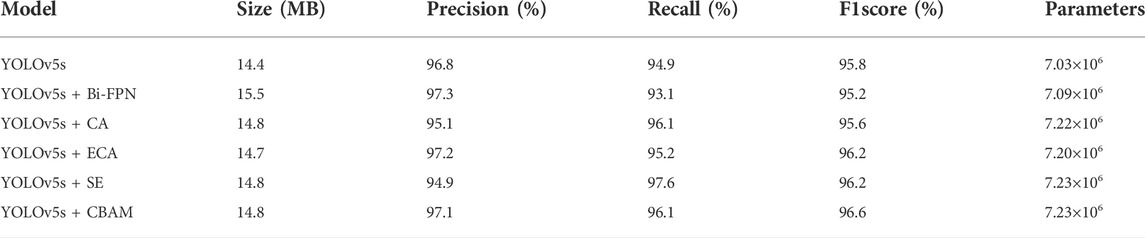
TABLE 3. Experimental results of different optimization methods.
3.4 Contrast model
The test results of different lightweight models are shown in Table 4. Compared with the optimized model, MobileDets can achieve faster detection of sow posture, but precision and recall are lower than the optimized model. The precision and detection speed of Nanodet model are slightly faster than that of the optimized model, but the recall is far lower than that of the optimized model. Combining precision, recall, f1score and detection speed, the optimized model has the best detection performance. The test results show that the processing time of a single picture on the embedded GPU is 74.4 ms, which can meet the needs of real-time detection.
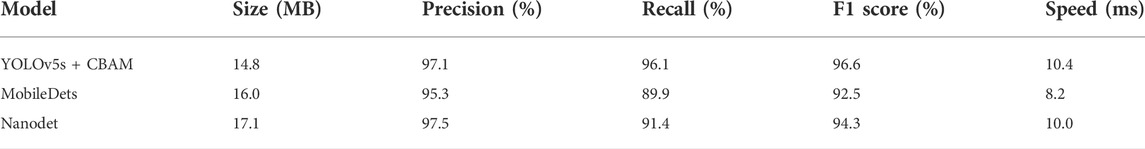
TABLE 4. Experimental results of different lightweight models.
3.5 Model testing
To further test the performance of the model for sow posture detection, 100 images of each of the four postures were selected and tested. Among them, there are 50 images collected at night and 50 during the day, for a total of 400 images. The detection results of different sow posture are shown in Figure 7. Below the white segmentation line is the manually marked sow posture (blue line), and above the white segmentation line is the model automatic detection result (orange line), the night image annotation and identification results are gray background area, and the daytime image annotation and identification results are white background area. According to Figure 7, The model classified stand, sit and lateral postures more well, but a little inferior for sternum, that is because the inter class gap between sternum and the others is smaller than that between stand, lateral, and sit. Furthermore, there are a few missed detections, which is caused by changes in light. Overall, the model is able to accurately detect daytime and nighttime sow posture.
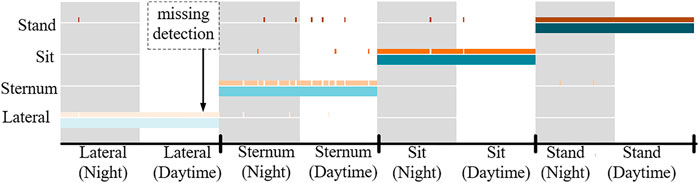
FIGURE 7. Different sow posture detection results.
3.6 Estrus analysis
To explore the daily patterns of empty sow behavior, this study analyzed the frequency of posture change in 52 empty sows within 7 days after lactation. The study selected the remaining 20 sows as test samples. For a fifth day estrus sow (sow-2), the statistical results are shown in Figure 8. The study divides a day into three time periods: Time-1, Time-2, and Time-3. Time-1 is 0–5 am, Time-1 is 6 am-6 pm, and Time-3 is the remaining time.
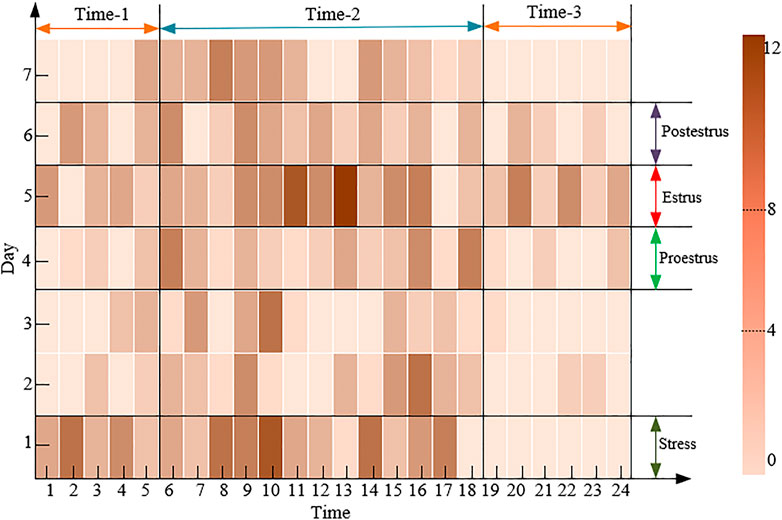
FIGURE 8. The frequency of posture change in sow (sow-2) within 7 days after lactation.
The frequency of posture change in sow-2 on the first day remained high after lactation, which is caused by the stress of transfer group. At time-1, the average frequency of posture change in sow was up to 6.98 times per hour. When sows changed from stress to proestrus, the frequency of posture change was significantly reduced, with the average frequency of posture change in the sow decreased to 1.43 times per hour. When the sow was in estrus, its frequency of posture change in the sow increased significantly. With the average frequency of posture change in sows up to 6.14 times per hour, which generally increased 3-4 times compared with proestrus. When the sow ends in the estrus period, its average PTF will gradually increase, with the average frequency of posture change in sows decreasing to 5.69 times per hour, generally down by 0.2–0.3 from the estrus period. However, this trend is not statistically significant for time-2 or time-3. The study further analyzed the time of each posture after stress, and the results are shown in Figure 9. It can be seen that when an empty sow is estrus, the stand and sternum time increases and the lateral time decreases. This is consistent with the conclusion of Lee et al [30].
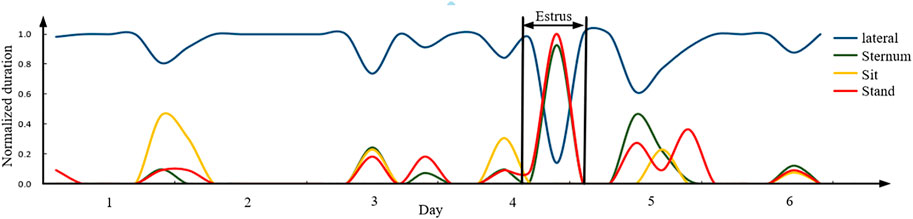
FIGURE 9. The time of each posture at 1–6 days after the end of the stress phase.
Based on the above conclusions, the remaining 20 sows were selected for testing in this study. Among the 20 sows, including 3 with abnormal estrus sows and 17 with normal estrus sows. The test results showed that among the remaining 17 sows, only one with estrus was wrongly detected, and 94.1% of estrus sows could be accurately detected.
3.7 Abnormal estrus analysis
Due to nutrition, disease, sow house environment and other factors, some sows are unable to estrus and ovulate normally after weaning [31]. Abnormal estrus sows were placed into five main categories: silent estrus, persistent estrus, repeating estrus and postpartum anestrus, accounting for 12.5% of the experimental sows. The frequency of posture change of different types of empty sows is shown in Figure 10. Sow-1 is normal estrus sow, sow-2 is silent estrus sow, sow-3 is persistent estrus sows, sow-4 is repeating estrus sow, and sow-5 is postpartum anestrus sow. For silent estrus (sow-2) or postpartum anestrus sow (sow-5), the frequency of posture change remained relatively low. In the Time-1, the average frequency of posture change of two kinds of sows is less than 1.63 times per hour. For persistent estrus sows (sow-3), the frequency of posture change is at high levels. In the time-1, the average frequency of posture change of this kind of sows is higher than 11.74 times per hour, significantly lower than those in normal estrus. However, for postpartum anestrus sows, the average frequency of posture change of this kind of sows fluctuates up and down irregularly, which is usually caused by sow malnutrition or ovarian dysfunction.
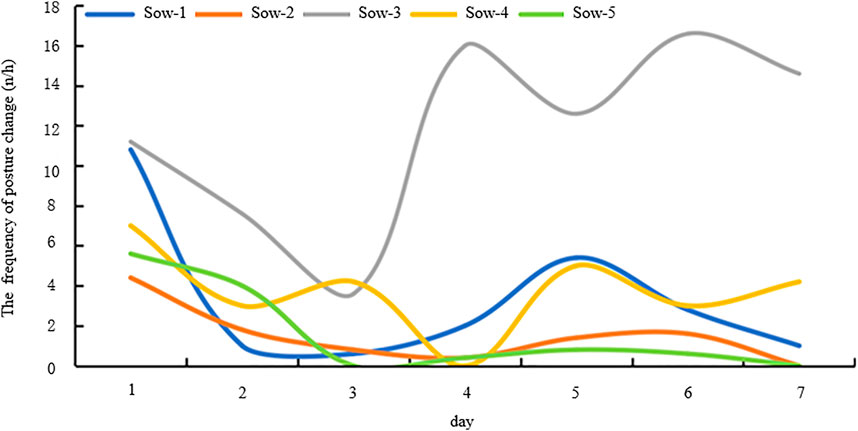
FIGURE 10. The frequency of posture change in different types of sows.
3.8 Current deficiencies and subsequent studies
For this study, although the preliminary method for detection of estrus had been achieved, there are still shortcomings in this study. It was found that the light condition had some influence on the sow posture detection. The feature map of the five light conditions, including normal light, nighttime light, uneven light, overexposure, underexposure, were visualized, and class activation maps (CAM) were generated, as shown in Figure 11. In normal light, nighttime, overexposure, the model can accurately identify the sow object and classify its postures. However, in uneven light, the model can accurately predict sow position, but there is some false detection of posture. Through testing, it was found that due to the dim light in the breast area of some sow images, the model could not accurately distinguish between the lateral and sternum. In uneven light, the model had difficulty in identifying sows. In the next phase of the study, we will synthesize the dynamic detection results of the video data to further improve the posture detection precision of the model.
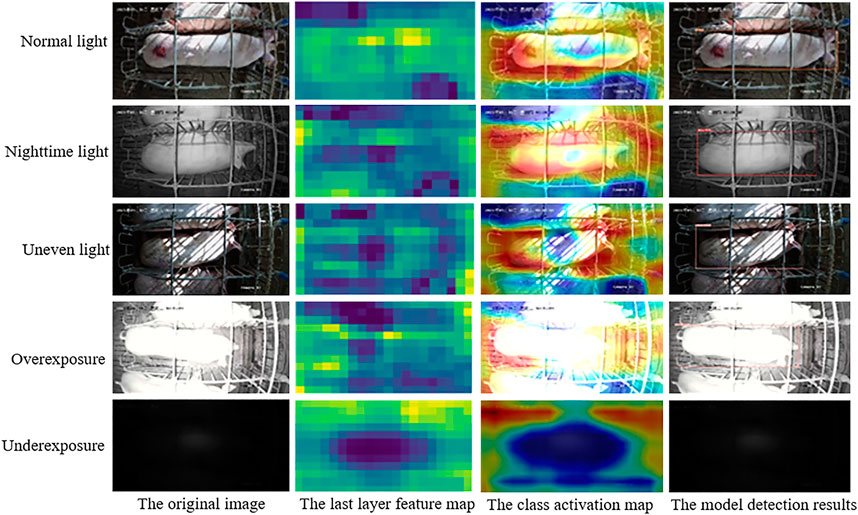
FIGURE 11. Detection results in different light.
4 Conclusion
In this past study, we proposed an algorithm for sow posture detection based on optimized YOLOv5s and used it for activity analysis of sows in estrus. It could be concluded from the testing results and discussions that:
1) Combining a CBAM module with the YOLOv5 model helped in the detection of sow postures. This method could be used to continuously and automatically monitor sow behavior.
2) The study found that when empty sows reached in estrus, the frequency of posture change in most sows increased. The standing and sternum time of sows increased, and the lateral time decreased compared with the non-estrus period.
3) This study compared the frequency of posture change in abnormal estrus abnormal estrus sows. In the follow-up study, the testing range of abnormal estrus sows will be further expanded
Data availability statement
The raw data supporting the conclusion of this article will be made available by the authors, without undue reservation.
Ethics statement
The animal study was reviewed and approved by The Committee of Animal Research Institute.
Author contributions
HX completed data collection, model construction, and paper writing. JC and QD completed the labeling of the data. YS participated in the feasibility analysis, and MS directed the data collation and writing. LL directed the paper revision. XU and JZ helped validate the model.
Funding
This research was funded by the National Key Research and Development Program of China (Grant No. 2021YFD2000800) and the Jiangsu Provincial Key Research and Development Program (Grant No: BE2021363).
Acknowledgments
Thanks to Ruqian Zhao and Professor Wen Yao for their guidance on the experiment.
Conflict of interest
The authors declare that the research was conducted in the absence of any commercial or financial relationships that could be construed as a potential conflict of interest.
Publisher’s note
All claims expressed in this article are solely those of the authors and do not necessarily represent those of their affiliated organizations, or those of the publisher, the editors and the reviewers. Any product that may be evaluated in this article, or claim that may be made by its manufacturer, is not guaranteed or endorsed by the publisher.
References
1. McGlone JJ, Garcia A, Rakhshandeh A. Multi-Farm analyses indicate a novel boar pheromone improves sow reproductive performance. Animals (2019) 9(2):37. doi:10.3390/ani9020037
2. Liang G, Yan J, Guo J, Tang Z. Identification of ovarian circular RNAs and differential expression analysis between MeiShan and large white pigs. Animals (2020) 10(7):1114. doi:10.3390/ani10071114
3. Zhang Y, Cai J, Xiao D, Li Z, Xiong B. Real-time sow behavior detection based on deep learning. Comput Electron Agr (2019) 163. 104884 doi:10.1016/j.compag.2019.104884
4. Houwers H. “Locality registration as a way of oestrus detection in an integrated group-housing for sows,” in: UnshellJ, Van PuttenG, ZeebK, EkesboI, editors Proceedings of the international congress on applied ethology in farm animals. (Skara, Sweden) (1988). p. 44–55.
5. Bressers H, Te Brake J, Noordhuizen J. Automated oestrus detection in group-housed sows by recording visits to the boar. Livestock Prod Sci (1995) 41(2):183–91. doi:10.1016/0301-6226(94)00053-A
6. Korthals RL. The effectiveness of using electronic identification for the identification of estrus in swine. ASAE CSAE SCGR Annu Int Meet (1999) 18(21):10.
7. Ostersen T, Cornou C, Kristensen AR. Detecting oestrus by monitoring sows' visits to a boar. Comput Electron Agric (2010) 74(1):51–8. doi:10.1016/j.compag.2010.06.003
8. Lei K, Zong C, Du X, Teng G, Feng F. Oestrus analysis of sows based on bionic boars and machine vision technology. Animals (2021) 11(6):1485. doi:10.3390/ani110618510.3390/ani11061485
9. Bressers HPM. Monitoring individual sows in group-housing: Possibilities for automation. Wageningen, Netherlands: Wageningen University and Research (1993), 139–48.
10. Freson L, Godrie S, Bos N, Jourquin J, Geers R. Validation of an infra-red sensor for oestrus detection of individually housed sows. Comput Electron Agric (1998) 20(1):21–9. doi:10.1016/S0168-1699(98)00005-2
11. Jeong H, Yoe H (2013). “A study on the estrus detection system of the sow using the wireless sensor network,” in Proceedings of the international conference on wireless networks (Suncheon, South korea: Department of Information and Communication Engineering, Sunchon National University), 101–8.
12. Wang K, Liu C, Duan Q. Identification of sow estrus behavior based on MFO-LSTM. Trans CSAE (2020) 36(14):211–9. doi:10.11975/j.issn.1002-6819.2020.14.026
13. Li X, Luo M, Ji S, Zhang L, Lu M. Evaluating generative adversarial networks based image-level domain transfer for multi-source remote sensing image segmentation and object detection. Int J Remote Sensing (2020) 41(19):7343–67. doi:10.1080/01431161.2020.175778210
14. Moini S, Alizadeh B, Emad M, Ebrahimpour R. A Resource-Limited hardware accelerator for convolutional neural networks in embedded vision applications. IEEE Trans Circuits Syst Express Briefs (2017) 64:1217–21. doi:10.1109/TCSII.2017.2690919
15. Ghimire D, Kil D, Kim SH. A survey on efficient convolutional neural networks and hardware acceleration. Electronics (2022) 11(6):945. doi:10.3390/electronics11060945
16. Nousi P, Mademlis I, Karakostas I, Tefas A, Pitas I (2019). “Embedded UAV Real-Time visual object detection and tracking,” in Proceedings of the IEEE international conference on real-time computing and robotics, Irkutsk, Russia, 04-09 August 2019 (IEEE), 708–13. doi:10.1109/RCAR47638.2019.9043931
17. Zhou F, Zhao H, Nie Z (2021). “Safety helmet detection based on YOLOv5,” in Proceedings of the IEEE international conference on power electronics. Computer Applications, Shenyang, China, 22-24 January 2021 (IEEE), 6–11. doi:10.1109/ICPECA51329.2021.9362711
18. Zhao Z, Yang X, Zhou Y, Sun Q, Ge Z, Liu D. Real-time detection of particleboard surface defects based on improved YOLOV5 target detection. Sci Rep (2021) 11(1):1–15. doi:10.1038/s41598-021-01084-x
19. Niu J, Chen Y, Yu X, Li Z, Gao H (2020). “Data augmentation on defect detection of sanitary ceramics,” in Proceedings of the 2021 IEEE international conference on power electronics, Computer Applications, Singapore, 18-21 October 2020 (IEEE), 5317–22. doi:10.1109/IECON43393.2020.9254518
20. Rezatofighi H, Tsoi N, Gwak J, Sadeghian A, Reid I, Savarese S (2019). “Generalized intersection over union: A metric and a loss for bounding box regression,” in Proceedings of the IEEE/CVF conference on computer vision and pattern recognition, Long Beach, CA, USA, 15-20 June 2019 (IEEE), 658–66. doi:10.1109/CVPR.2019.00075
21. Jiang M, Song L, Wang Y, Li Z, Song H. Fusion of the YOLOv4 network model and visual attention mechanism to detect low-quality young apples in a complex environment. Precision Agric (2022) 23(2):559–77. doi:10.1007/s11119-021-09849-0
22. Zhu L, Geng X, Li Z, Liu C. Improving YOLOv5 with attention mechanism for detecting boulders from planetary images. Remote Sensing (2021) 13(18):3776. doi:10.3390/rs1318377610.3390/rs13183776
23. Desai M, Shah M. An anatomization on breast cancer detection and diagnosis employing multi-layer perceptron neural network (MLP) and Convolutional neural network (CNN). Clin Ehealth (2021) 4:1–11. doi:10.1016/j.ceh.2020.11.002
24. Lakshmi B, S.Parthasarathy S. Human action recognition using median background and max pool convolution with nearest neighbor. Int J Ambient Comput Intelligence (Ijaci) (2019) 10(2):34–47. doi:10.4018/IJACI.2019040103
25. Gao R, Wang R, Feng L, Li Q, Wu H. Dual-branch, efficient, channel attention-based crop disease identification. Comput Electron Agr (2021) 190:10641. doi:10.1016/j.compag.2021.106410
26. Zakir Ullah M, Zheng Y, Song J, Aslam S, Xu C, Kiazolu GD, et al. An Attention-Based convolutional neural network for acute lymphoblastic leukemia classification. Appl Sci (2021) 11(22):10662. doi:10.3390/app112210662
27. Xiong Y, Liu H, Gupta S, Akin B, Bender G, Wang YZ, et al. (2021). “MobileDets: Searching for object detection architectures for mobile accelerators,” in Proceedings of the IEEE/CVF conference on computer vision and pattern recognition, Nashville, TN, USA, June 20 2021 to June 25 2021 (IEEE), 3824–33. doi:10.11.09/CVPR46437.2021.00382
28. Zhou Z, Hu Y, Deng X, Huang D, Lin Y (2021). “Fault detection of Train height valve based on nanodet-resnet101,” in Proceedings of the 2021 36th youth academic annual conference of Chinese association of automation. YAC), Nanchang, China, 28-30 May 2021 (IEEE), 709–14. doi:10.1109/YAC53711.2021.9486540
29. Sim I, Lim JH, Jang YW, You JH, Oh ST, Kim YK, et al. Developing a compressed object detection model based on YOLOv4 for deployment on embedded GPU platform of autonomous system. arXiv (2021). doi:10.48550/arXiv.2108.00392
30. Lee JH, Lee DH, Yun W, Oh HJ, An JS, Kim YG, et al. Quantifiable and feasible estrus detection using the ultrasonic sensor array and digital infrared thermography. J Anim Sci Technol (2019) 61(3):163–9. doi:10.5187/jast.2019.61.3.163
Keywords: sow, posture, estrus, machine vision, YOLOv5
Citation: Xue H, Chen J, Ding Q, Sun Y, Shen M, Liu L, Chen X and Zhou J (2022) Automatic detection of sow posture and estrus based on convolutional neural network. Front. Phys. 10:1037129. doi: 10.3389/fphy.2022.1037129
Received: 05 September 2022; Accepted: 26 September 2022;
Published: 11 October 2022.
Edited by:
Leizi Jiao, Beijing Academy of Agriculture and Forestry Sciences, ChinaReviewed by:
Huaibo Song, Northwest A&F University, ChinaGuofeng Han, Jiangsu Academy of Agricultural Sciences (JAAS), China
Copyright © 2022 Xue, Chen, Ding, Sun, Shen, Liu, Chen and Zhou. This is an open-access article distributed under the terms of the Creative Commons Attribution License (CC BY). The use, distribution or reproduction in other forums is permitted, provided the original author(s) and the copyright owner(s) are credited and that the original publication in this journal is cited, in accordance with accepted academic practice. No use, distribution or reproduction is permitted which does not comply with these terms.
*Correspondence: Mingxia Shen, bWluZ3hpYUBuamF1LmVkdS5jbg==