 Yu Wang
 Quanhu Zhang
 Qingxu Yao
- Xi’an Research Inst of Hi-Tech, Xi’an, China
As a rapid and automatic method, multiple radionuclide identification using deep learning has drawn wide interest from researchers in the field of nuclear safety and nuclear security. However, the network model in deep learning often appears in the form of a black box, which makes it difficult for people to understand its decision-making basis. It is necessary to develop an interpretable deep learning model for multiple nuclide identification. In the work on nuclide identification using deep learning, very few interpretable studies have been conducted. In this paper, channel attention weights are used for interpretable radionuclide identification for the first time. We propose a multiple radionuclide identification method using deep learning with channel attention module and visual explanation. A dataset of gamma spectra simulated by Geant4 was created, containing 256 combinations of 8 radionuclides. These gamma spectra were used to train using a convolutional neural network (CNN) with a channel attention module. The obtained accuracies on training, validation, and test sets are 97.8%, 97.6%, and 97.1%, respectively. The result of interpretation of spectral features show that based on the channel attention module, the CNN can make full use of the feature information of the photoelectric peak and Compton edge and suppress the background and noise interference. In addition, the t-distributed stochastic neighbor embedding (t-SNE) method was used to visualize the inner working process of the CNN and visually illustrate the correctness of feature extraction. This research will promote the application of artificial intelligence algorithms in nuclide identification instruments.
Introduction
Airborne radionuclide identification is an important technology in the Comprehensive Nuclear-Test-Ban Treaty [1, 2]. In order to improve the coverage and efficiency of the monitoring, it is necessary to analyze the gamma-ray spectrum measured in a short period of time. With this limit, the counting fluctuation error of the spectrum is large, and the photoelectric peak is easily overwhelmed by the background. In addition, the calibration of detector is prone to deviation due to temperature changes. In this case, it is difficult to identify radionuclides by traditional methods.
Some of the latest works with machine learning methods for nuclide identification have achieved rapid, real-time, and automatic results. Intelligent nuclide identification methods have received more and more attention. Bayesian inference [3], support vector machines [4], and artificial neural networks [5–11] are applied to nuclide identification and quantification. Based on artificial neural networks, some variants of neural networks, such as convolutional neural network (CNN) [12–15], hybrid neural network [16], and generative adversarial network [17], have been applied to nuclide identification. The performance of these methods on nuclide identification tasks is better than that of traditional methods.
However, intelligent identification methods, especially deep learning models, have a problem that plagues researchers because of their “black box” features. It is difficult for deep neural networks to give a basis for decisions, which leads to a lack of trust for researchers [18, 19]. Although CNN has the ability to extract features, it must be ensured that the network can correctly and effectively utilize the extracted key features from the gamma spectrum. Among the deep learning studies related to radionuclide identification, few works have investigated the interpretability of neural networks for gamma spectral analysis. The interpretability can help people understand the process about how a neural network processes the gamma spectrum and increase people’s interest and confidence in using neural networks for nuclide identification.
Attention mechanism has become a research hotspot in the field of deep learning in recent years. The idea of the attention mechanism comes from the attention mechanism of the human brain. The human brain will consciously ignore unimportant information and focus on information closely related to the target. Applying attention to the CNN structure can improve the ability of feature maps to encode key information and improve the learning effect of the middle layer [20, 21]. The use of attention mechanisms to explain the internals of neural networks is a hot research topic.
In this study, we propose a CNN model with a channel attention module [20]. A gamma spectroscopy dataset was established for multiple radionuclide identification. We try to explain and understand how CNN processes features using channel attention. By using the t-distributed stochastic neighbor embedding (t-SNE) [22] dimensionality reduction algorithm, the inner working process of the neural network is visualized.
The main contributions of the paper are listed here:
The proposed model
Convolutional neural network model
The proposed model of the neural network is mainly composed of an input layer, an output layer, three convolution modules, and a channel attention module, as shown in Figure 1.
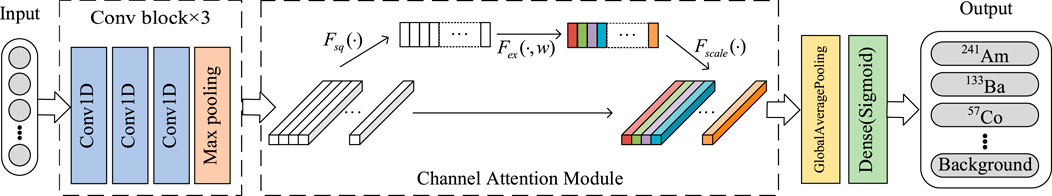
FIGURE 1. Schematic diagram of the proposed model.
The input to the neural network is the entire gamma spectrum
The number of convolution kernels increases with the deepening of the network. In fact, processing gamma spectra with a one-dimensional convolution kernel can be regarded as a filtering operation, and different convolution kernels correspond to the features of different channel outputs. Different features are of different importance to the identification of radionuclides. The features that are more representative of the characteristics of nuclides should be paid attention to. Considering the above reasons, a channel attention module is added after the highest convolutional module.
Channel attention module
The inspiration for using the channel attention module comes from Squeeze-and-Excitation Networks [20]. The channel attention module can calculate the importance of features extracted by different convolution kernels. In general, it is divided into three steps: squeeze, excitation, and reweight. Specifically, data compression is first performed on the data of each channel, and the one-dimensional data output by each channel is compressed into a single value, corresponding to
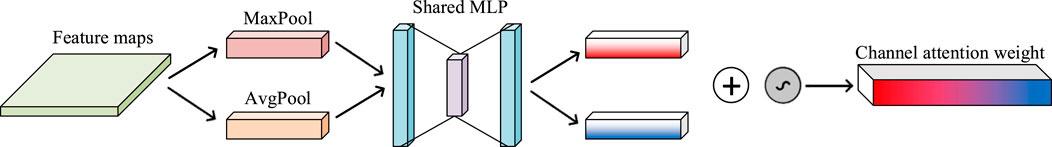
FIGURE 2. Schematic diagram of channel attention operation.
Finally, the channel attention weights are multiplied by each feature to get the features with the channel attention weights. The output layer follows the global average pooling layer. It consists of 9 neurons, whose output value is between 0 and 1 due to the limitation of the sigmoid activation function. Its physical meaning is the probability of the existence of 8 nuclides and the related background.
Determination of hyperparameters
The neural network model proposed in this paper has the following hyperparameters: The number of filters, the size of the kernel, the activation function, the initial learning rate, the batch size, and the number of neurons of the shared MLP. A reasonable setting of hyperparameters is conducive to better performance of the neural network. After some experience attempts, more suitable hyperparameters are explored. The final neural network hyperparameters are shown in Table 1. Table 2 is a model summary of the network.
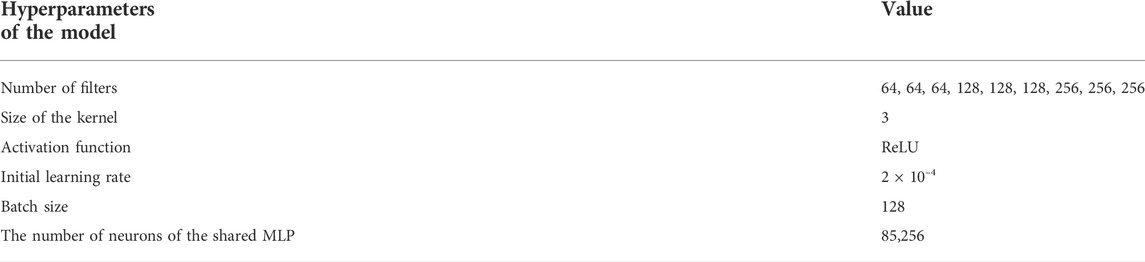
TABLE 1. Hyperparameters of the proposed neural network.
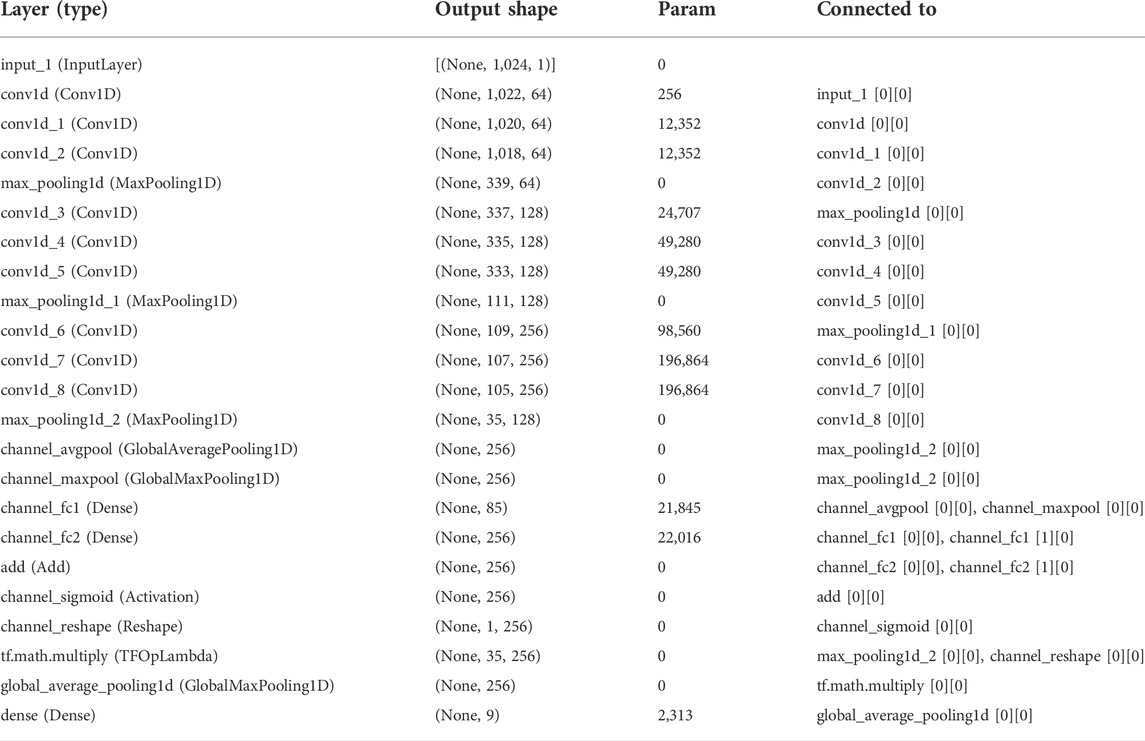
TABLE 2. Model summary of the CNN with channel attention module.
The loss function of the neural network is the categorical cross-entropy function. The neural network weights are updated iteratively based on the training data using the Adam optimizer. The running environment of the program is python3.8.12 and tensorflow2.5.0-GPU [23].
Creation of the dataset
Geant4 simulation
The deep learning model requires a large amount of data for training. The Geant4 simulation toolkit [24] was used to create the data, i.e., the gamma-ray spectra. First, a
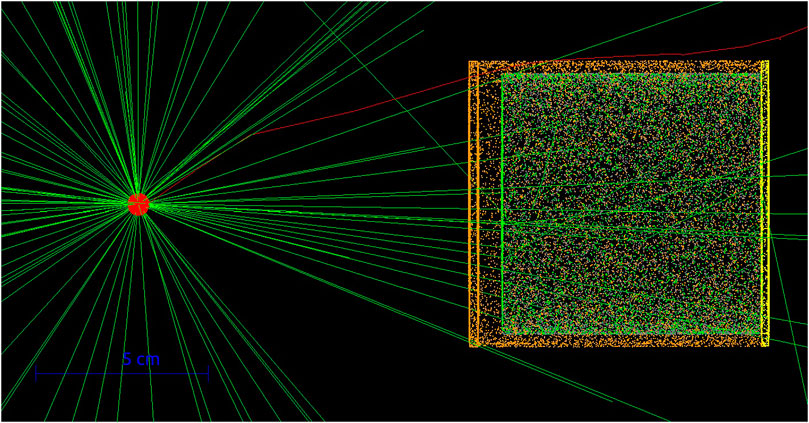
FIGURE 3. Detector model established with Geant4.
The total number of channels is 1,024, and the step size is 2 keV. For 137Cs, the energy resolution at 0.662 keV is 7.5%. The G4EmStandardPhysics was added to the physis list to simulate the physical process of photoelectric reaction. The G4RadioactiveDecayPhysics and G4DecayPhysics were added to the physis list to simulate the physical process of the decay of radioactive sources.
Gaussian broadening
Geant4 can only obtain the deposition energy of particles in the detector and cannot simulate the response process of the detector. The energy deposition simulated by Geant4 is very different from the energy actually measured and recorded by the detector. The energy deposition simulated by Geant4 is processed with Gaussian broadening, and Eqs 1, 2 are the broadening formulas.
Where FWHM is the full width at half maximum.
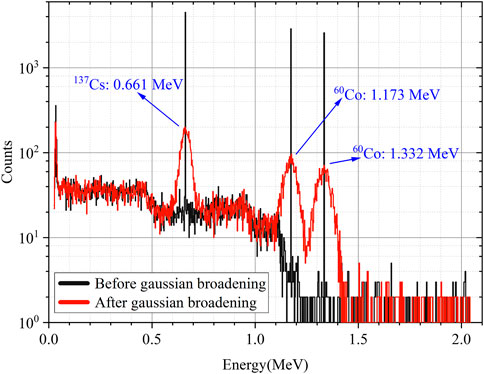
FIGURE 4. Gamma spectra before and after Gaussian broadening.
Referring to the four types of common radioisotopes listed in the IAEA technical guidance reference manual for nuclear security [25], a dataset of gamma spectra simulated by Geant4 was created. It contains 256 combinations of 8 radionuclides, they are, 241Am, 133Ba, 57Co, 60Co, 137Cs, 131I, 40K, and 235U. A background gamma-ray spectrum obtained from a long-term measurement is used as a template. The background gamma-ray spectrum is simulated based on this template, as shown in Figure 5.
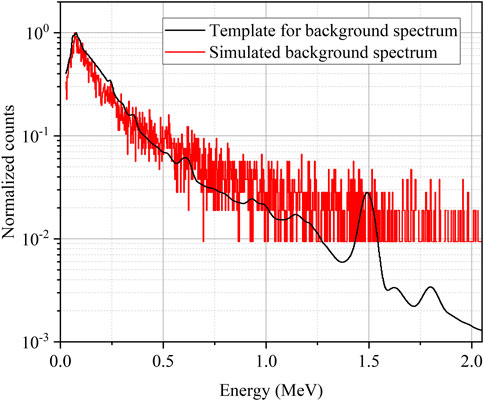
FIGURE 5. Template for sampling simulation and simulated background spectrum.
Data augmentation
The dataset needs to contain gamma spectra simulated in different situations to prevent overfitting when the neural network training data. In deep learning, this practice is called data augmentation. It was realized with three methods: Randomize the gross counts, randomize the radionuclide activity ratio, and perform the spectrum shift.
Figure 6 shows the comparison of 60Co and 137Cs mixed nuclide gamma-ray spectra after data augmentation. Specifically, first, the gross counts of the gamma-ray spectrum were randomly selected between
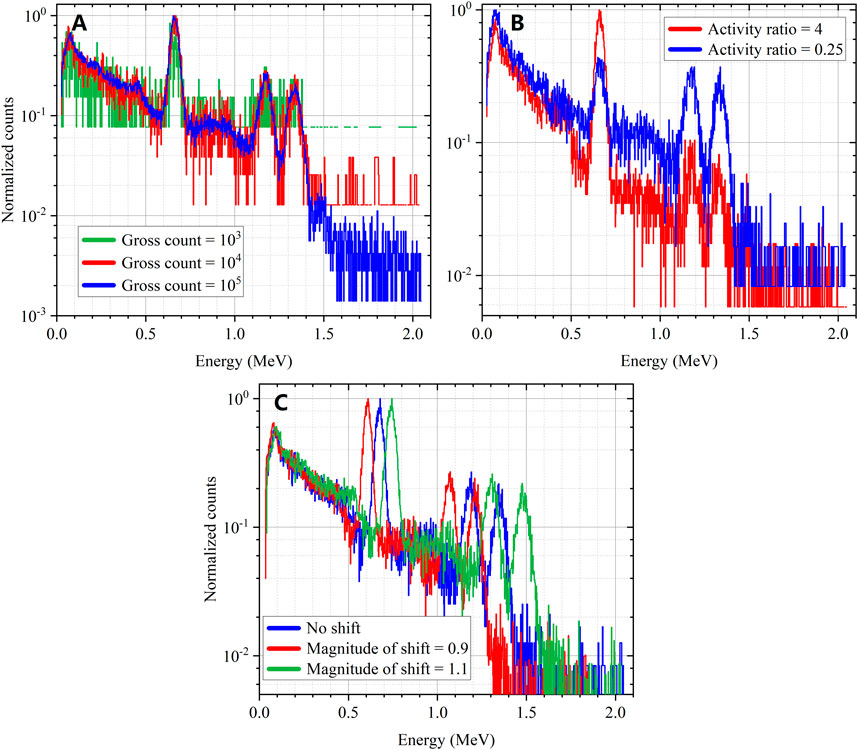
FIGURE 6. Example of the data augmentation; (A) spectra with different gross counts, (B) spectra with different radionuclide activity ratios, (C) spectra with different magnitude of shift.
For each combination of radionuclides, 1,000 spectra were simulated. Referring to the proportion of the small sample dataset [26], the dataset were divide into training set, validation set, and test set according to the ratio of 3:1:1.
Results and discussion
Training results of neural networks
Only when all existing nuclides are accurately identified, and no excess nuclides are incorrectly identified can the neural network be considered to have successfully completed the identification. TensorFlow’s own metrics, such as accuracy and binary_accuracy, do not meet our requirements. So, we define our own metrics. To describe our own defined metrics, we use Table 3 as an example. Table 3 lists the labels of the three gamma spectra for a certain combination and the identification output of spectra. The three gamma spectra have the same labels and are named spectrum a, spectrum b, and spectrum c respectively. Then use different metrics to calculate the accuracy to illustrate the difference between different metrics.
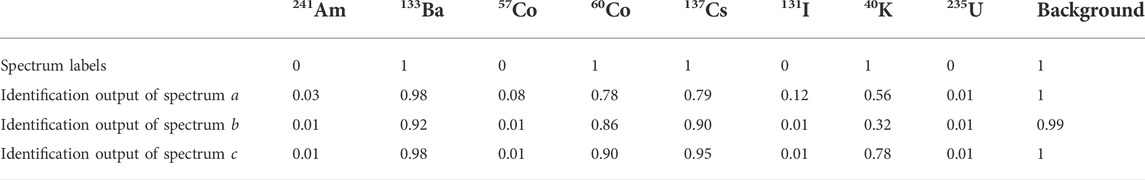
TABLE 3. Labels and identification output for the three gamma spectra.
We set 0.5 as the threshold for the network to judge the existence of nuclides. When the output value of a certain output channel is greater than 0.5, the network considers that the nuclide exists. Among the identification output of spectra, for the identification output of spectrum b, the neural network did not recognize the existence of 40K, but the rest of the prediction results were correct. According to the metrics we defined, the accuracy should be 66.6% at this time. However, the binary_accuracy that comes with tensorflow will calculate the accuracy for each output channel separately. At this time, the accuracy is
The training accuracy and verification accuracy of each epoch of training in the training process are shown in Figure 7. The accuracy of training increases rapidly in the early stage and reaches saturation in the late stage. During training, the learning rate was halved every 20 epochs. This allows us to quickly adjust the neural network parameters at the beginning of training and fine-tune the parameters at the end of training. In the later stage of training, it is necessary to slow down the speed of neural network updating weights to make the accuracy reach a stable value. This is the reason why the fluctuation of accuracy in the early training period is larger than that in the late training period, as shown in Figure 7.
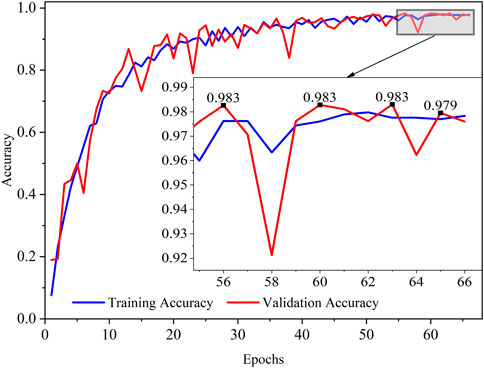
FIGURE 7. Training accuracy and validation accuracy during model training.
The basis for stopping training is that the accuracy of the validation set no longer increases for 10 consecutive epochs. In the local magnification of Figure 7, the accuracy of the validation set does not grow after the 56th epoch. The accuracy of the validation set was no more than 98.3% in epochs 56 to 66, so the training was stopped at epoch 66 to prevent overfitting.
To highlight the role of the channel attention module. We train the network without adding channel attention. During training, we still use the metrics we defined. Table 4 shows Training accuracy and validation accuracy of CNN with channel attention and without channel attention at the end of the training. Compared with the CNN without channel attention module, the CNN with channel attention module improves the training accuracy and validation accuracy.
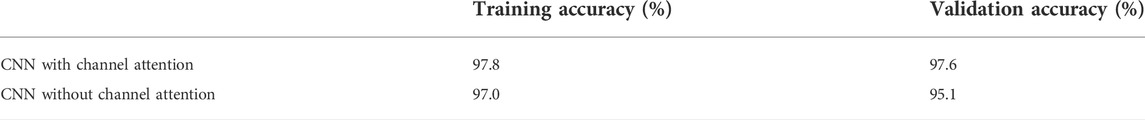
TABLE 4. Training accuracy and validation accuracy of CNN with channel attention and without.
In total, gamma-ray spectra for 256 combinations were simulated. Let the number of existing nuclides is
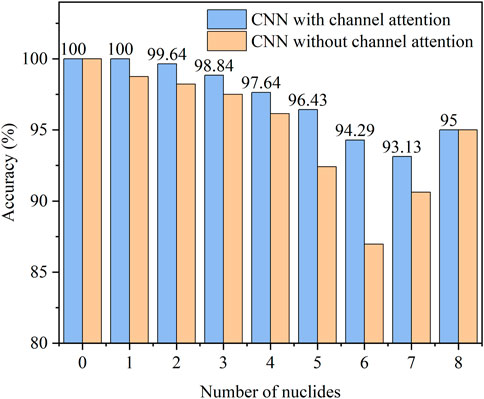
FIGURE 8. Identification accuracy of the spectra with different numbers of nuclides in the test set.
The network is trained and tested on a notebook PC with AMD Ryzen 7 5800H, a Nvidia GeForce RTX 3060 Laptop GPU and 16 GB RAM in 64-bit Windows 11. In the test set, the average time to identify each spectrum is 0.285 ms. The proposed method is a rapid and automatic method for nuclide identification.
Interpretation of spectral features by channel attention weights
CNN relies on convolutional layers to extract features from spectral data. The deeper the convolutional layers, the more abstract the features are. These features may represent different spectral peaks, including but not limited to photoelectric peaks, Compton edges, and background. We hope that through the channel attention module, the neural network can assign different attention weights to these features so as to better utilize the features that are beneficial to nuclide identification.
Figure 9 shows several feature maps of gamma spectroscopy for several different convolution kernels in the highest convolutional layers. Figure 9A is the original gamma spectrum input to the neural network. Figures 9B–D are several feature maps, which are named feature maps 1, 2, and 3, respectively. Although they do not include all feature maps, they are still representative. These feature maps may be abstract to people, but they are still understandable. In Figure 9B, one may see the characteristics of the photoelectric peaks of 137Cs and 60Co. In Figure 9C, one may perceive not only the characteristics of the photoelectric peaks of 137Cs and 60Co, but also the related Compton edge. In Figure 9D, the main features come from the background. In addition, comparing Figures 9A,C, Figure 9C does not have the noise of the statistical fluctuation distribution in Figure 9A, which is due to the automatic noise filtering operation in the neural network. Neural networks can extract features such as photoelectric peaks, Compton edges, and backgrounds in gamma spectra, but what is more important may be how to use these features in a targeted manner.
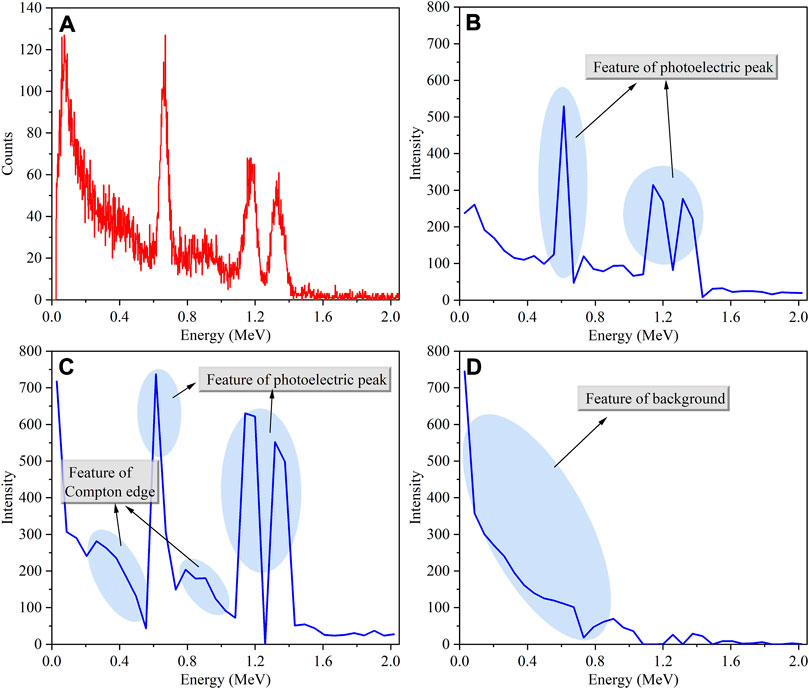
FIGURE 9. Examples of mixed nuclides of 60Co and 137Cs; (A) original gamma-ray spectrum, (B) feature map 1, (C) feature map 2, (D) feature map 3.
Table 5 shows the channel attention weights of the neural network for these three features. Due to the limitation of the sigmoid activation function, the attention weights are constrained to be between 0 and 1. The channel attention weight of feature map 1 and feature map 2 is 1, and the weight of feature map 3 is 0. This indicates that the neural network considers photoelectric peaks and Compton edges to be important information for nuclide identification. Background information is interfering information which does not require the attention of the neural network. This is in line with the logic of people identifying nuclides. People mainly rely on photoelectric peaks to identify nuclides rather than relying on the characteristics of the background. Here, the neural network automatically completes the gamma spectrum analysis work. Only spectra and labels are input, then the neural network completes the nuclide identification work that is consistent with people’s cognitive logic.
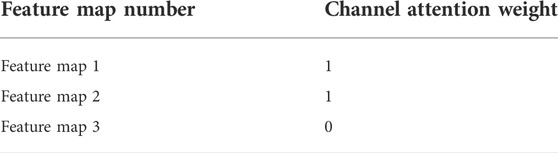
TABLE 5. Channel attention weights corresponding to different feature maps.
Feature visualization using t-distributed stochastic neighbor embedding
In order to further analyze the process of feature extraction by the neural network, the features of the gamma spectra of four nuclide combinations in the test set were selected for visualization. Each combination contains two nuclides, they are, 241Am + 133Ba, 57Co+60Co, 137Cs + 131I, 40K + 235U. t-SNE is a nonlinear dimensionality reduction method. Despite the high computational cost, t-SNE is still effective for visualizing high-dimensional data containing multiple manifolds simultaneously. The t-SNE algorithm was used to convert gamma spectral features in high-dimensional space into vector data in two-dimensional space. The transformed two-dimensional vector preserves the structure of the high-dimensional space.
The data distribution of the average pooling layer before the channel attention, the global average pooling layer after the channel attention, and the output layer of the neural network were analyzed. Figures 10A–C correspond to the outputs of channel_maxpool, global_average_pooling1d and dense in Table 2, respectively. For each combination of nuclides, there are 200 gamma spectra as test samples, corresponding to 200 discrete points for each color in Figure 10. The 2D vector data after t-SNE dimensionality reduction were normalize, so the coordinates on the graph were constrained to be between 0 and 1. In general, the closer the points of the same color are on the graph, the better the classification performance of the neural network. Compared to the data distributions in Figure 10A, all points of the same color are clustered together in Figure 10B, which proves the effectiveness of the channel attention module. The data distribution in Figure 10C visually shows the recognition results of the neural network. Figure 10A–C visually shows the process of processing data inside the neural network.
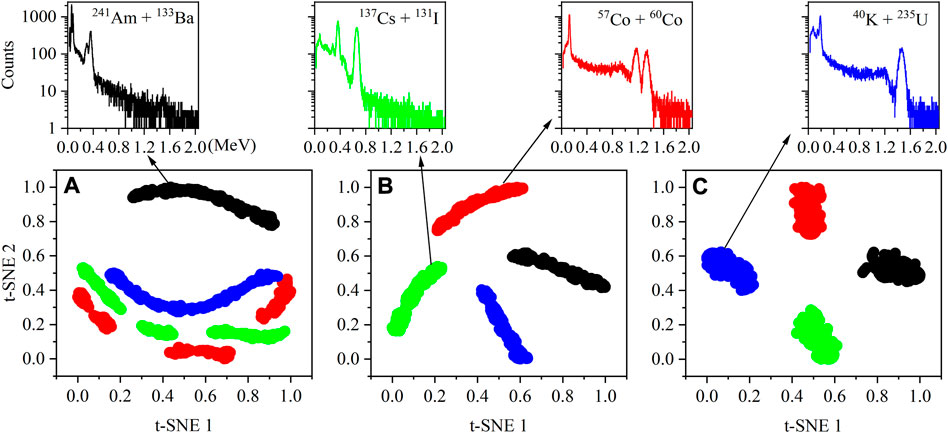
FIGURE 10. Results of feature visualization using t-SNT; (A) Visualization of the outputs of channel_maxpool in Table 2, (B) global_average_pooling1d in Table 2, (C) dense in Table 2.
Conclusion
This paper proposes a convolutional neural network with a channel attention module for multiple radionuclide identification. The NaI detector model was modeled by Geant4. The gamma-ray spectra of multiple nuclides were simulated. Data augmentation is achieved by randomizing the gross counts, randomizing the radionuclide activity ratio, and performing the spectrum shift. With the data augmentation, a gamma-ray spectral dataset that can be used for multiple radionuclide identification has been obtained. During training, a gradually decreasing learning rate method was used to stabilize the training results and an early stopping method to prevent overfitting. We strictly define metrics to calculate accuracy. Only when all the nuclides present are accurately identified and no redundant nuclides are misidentified can the neural network be considered to have successfully completed the identification. The obtained accuracies on training, validation, and test sets are 97.8%, 97.6%, and 97.1%, respectively.
To the best of our knowledge, this paper is the first to use the channel attention module for multiple radionuclide identification. It is proved that the channel attention weights are able to explain how the neural network analyses the gamma-ray spectrum. The CNN extracts the features of the gamma spectrum through convolutional layers, which contain information such as photoelectric peaks, Compton edges, and background. The channel attention module allows the neural network to make full use of the characteristic information, such as the photoelectric peak and Compton edge of the spectrum while suppressing the background and noise interference. This is in line with people’s basic logical knowledge when identifying nuclides because people mainly rely on the photoelectric peaks in the spectrum to identify different nuclides. Furthermore, t-SNE was used to visualize feature extraction. By visualizing the feature data distribution, one may find that using the channel attention module is able to enhance the training effect, and also the process of processing the data inside the neural network is explainable. These results vividly illustrate the correctness of feature extraction.
Future work will build a database on measured gamma-ray spectra, which is a long-term effort. With the development of deep learning, more and more new neural network models have appeared. It is interesting work to explore whether new network models are suitable for nuclide identification. Future work may include the use of transformer models and reinforcement Learning represented by Q-learning [28–30] for nuclide identification.
Data availability statement
The original contributions presented in the study are included in the article/supplementary materials, further inquiries can be directed to the corresponding author.
Author contributions
YW Simulated the data and drafted the manuscript. YW and YL performed the analysis. QZ Guided the study and analyzed the results. QY and YW designed the research. YH and MZ reviewed the manuscript. All authors have read and approved the content of the manuscript.
Conflict of interest
The authors declare that the research was conducted in the absence of any commercial or financial relationships that could be construed as a potential conflict of interest.
Publisher’s note
All claims expressed in this article are solely those of the authors and do not necessarily represent those of their affiliated organizations, or those of the publisher, the editors and the reviewers. Any product that may be evaluated in this article, or claim that may be made by its manufacturer, is not guaranteed or endorsed by the publisher.
References
1. Aarnio PA, Ala-Heikkilä JJ, Hakulinen TT, Nikkinen MT. The nuclide identification system SHAMAN in the verification of the comprehensive nuclear-test-ban treaty. J Radioanal Nucl Chem (2001) 248:587–93. doi:10.1023/A:1010607820953
2. Aarnio PA, Ala-Heikkilä JJ, Ansaranta TK, Hakulinen TT. Analysis pipeline for air filter gamma-ray spectra from the CTBT verification network. J Radioanal Nucl Chem (2005) 263:253–7. doi:10.1007/s10967-005-0045-x
3. Kim J, Lim KT, Kim J, Kim Y, Kim H, Cho G. Quantification and uncertainty analysis of low-resolution gamma-ray spectrometry using Bayesian inference. Nucl Instr Methods Phys Res Section A: Acc Spectrometers, Detectors Associated Equipment (2020) 953:163144. doi:10.1016/j.nima.2019.163144
4. Hata H, Yokoyama K, Ishimori Y, Ohara Y, Tanaka Y, Sugitsue N. Application of support vector machine to rapid classification of uranium waste drums using low-resolution γ-ray spectra. Appl Radiat Isot (2015) 104:143–6. doi:10.1016/j.apradiso.2015.06.030
5. Aitkenhead MJ, Owen M, Chambers DM. Use of artificial neural networks in measuring characteristics of shielded plutonium for arms control. J Anal Spectrom (2012) 27:432–9. doi:10.1039/C2JA10230G
6. Bobin C, Bichler O, Lourenço V, Thiam C, Thévenin M. Real-time radionuclide identification in γ-emitter mixtures based on spiking neural network. Appl Radiat Isot (2016) 109:405–9. doi:10.1016/j.apradiso.2015.12.029
7. Kamuda M, Stinnett J, Sullivan CJ. Automated isotope identification algorithm using artificial neural networks. IEEE Trans Nucl Sci (2017) 64:1858–64. doi:10.1109/TNS.2017.2693152
8. Van Hiep C, Hung DT, Anh NN, Giang NN, Khang PD, Hai NX, et al. Nuclide identification algorithm for the large-size plastic detectors based on artificial neural network. IEEE Trans Nucl Sci (2022) 69:1203–11. doi:10.1109/TNS.2022.3173371
9. Qi S, Wang S, Chen Y, Zhang K, Ai X, Li J, et al. Radionuclide identification method for NaI low-count gamma-ray spectra using artificial neural network. Nucl Eng Techn (2022) 54:269–74. doi:10.1016/j.net.2021.07.025
10. Kim J, Park K, Cho G. Multi-radioisotope identification algorithm using an artificial neural network for plastic gamma spectra. Appl Radiat Isot (2019) 147:83–90. doi:10.1016/j.apradiso.2019.01.005
11. Zhang C, Hu G, Luo F, Xiang Y, Ding G, Chu C, et al. Identification of SNM based on low-resolution gamma-ray characteristics and neural network. Nucl Instr Methods Phys Res Section A: Acc Spectrometers, Detectors Associated Equipment (2019) 927:155–60. doi:10.1016/j.nima.2019.02.023
12. Liang D, Gong P, Tang X, Wang P, Gao L, Wang Z, et al. Rapid nuclide identification algorithm based on convolutional neural network. Ann Nucl Energ (2019) 133:483–90. doi:10.1016/j.anucene.2019.05.051
13. Daniel G, Ceraudo F, Limousin O, Maier D, Meuris A. Automatic and real-time identification of radionuclides in gamma-ray spectra: A new method based on convolutional neural network trained with synthetic data set. IEEE Trans Nucl Sci (2020) 67:644–53. doi:10.1109/TNS.2020.2969703
14. Koo BT, Lee HC, Bae K, Kim Y, Jung J, Park CS, et al. Development of a radionuclide identification algorithm based on a convolutional neural network for radiation portal monitoring system. Radiat Phys Chem (2021) 180:109300. doi:10.1016/j.radphyschem.2020.109300
15. Ryu J, Park C, Park J, Cho N, Park J, Cho G. Development of neural network model with explainable AI for measuring uranium enrichment. IEEE Trans Nucl Sci (2021) 68:2670–81. doi:10.1109/TNS.2021.3116090
16. Galib SM, Bhowmik PK, Avachat AV, Lee HK. A comparative study of machine learning methods for automated identification of radioisotopes using NaI gamma-ray spectra. Nucl Eng Techn (2021) 53:4072–9. doi:10.1016/j.net.2021.06.020
17. Wu S, Tang X, Gong P, Wang P, Liang D, Li Y, et al. Peak-searching method for low count rate γ spectrum under short-time measurement based on a generative adversarial network. Nucl Instr Methods Phys Res Section A: Acc Spectrometers, Detectors Associated Equipment (2021) 1002:165262. doi:10.1016/j.nima.2021.165262
18. Gomez-Fernandez M, Wong W-K, Tokuhiro A, Welter K, Alhawsawi AM, Yang H, et al. Isotope identification using deep learning: An explanation. Nucl Instr Methods Phys Res Section A: Acc Spectrometers, Detectors Associated Equipment (2021) 988:164925. doi:10.1016/j.nima.2020.164925
19. Wang Y, Yao Q, Zhang Q, Zhang H, Lu Y, Fan Q, et al. Explainable radionuclide identification algorithm based on the convolutional neural network and class activation mapping. Nucl Eng Techn (2022). doi:10.1016/j.net.2022.08.011
20. Hu J, Shen L, Albanie S, Sun G, Wu E. Squeeze-and-excitation networks. arXiv (2019). doi:10.48550/arXiv.1709.01507
21. Woo S, Park J, Lee J-Y, Kweon IS. Cbam: Convolutional block Attention module (2022). In: V Ferrari, M Hebert, C Sminchisescu, and Y Weiss, editors. Computer vision – ECCV 2018 lecture notes in computer science. Cham: Springer International Publishing. p. 3–19. doi:10.1007/978-3-030-01234-2_1
22. van der Maaten LJP, Hinton GE. Visualizing high-dimensional data using t-SNE. J Machine Learn Res (2008) 9:2579–605.
23. Abadi M, Agarwal A, Barham P, Brevdo E, Chen Z, Citro C, et al. TensorFlow: Large-scale machine learning on heterogeneous distributed systems. arXiv (2016). doi:10.48550/arXiv.1603.04467
24. Agostinelli S, Allison J, Amako K, Apostolakis J, Araujo H, Arce P, et al. Geant4—A simulation toolkit. Nucl Instr Methods Phys Res Section A: Acc Spectrometers, Detectors Associated Equipment (2003) 506:250–303. doi:10.1016/S0168-9002(03)01368-8
25.IAEA. Technical and functional specifications for border monitoring equipment. Vienna: INTERNATIONAL ATOMIC ENERGY AGENCY (2006).
26.N Jankowski, W Duch, and K Gra̧bczewski, editors. Meta-learning in computational intelligence. Berlin, Heidelberg: Springer Berlin Heidelberg (2011). doi:10.1007/978-3-642-20980-2
27.JJF. Calibration specification for hand-held radiation monitors for detection and identification of radionuclides. (2018).
28. Peng Z, Luo R, Hu J, Shi K, Ghosh BK. Distributed optimal tracking control of discrete-time multiagent systems via event-triggered reinforcement learning. IEEE Trans Circuits Syst (2022) 69:3689–700. doi:10.1109/TCSI.2022.3177407
29. Peng Z, Luo R, Hu J, Shi K, Nguang SK, Ghosh BK. Optimal tracking control of nonlinear multiagent systems using internal reinforce Q-learning. IEEE Trans Neural Netw Learn Syst (2022) 33:4043–55. doi:10.1109/TNNLS.2021.3055761
Keywords: multiple radionuclide identification, deep learning, channel attention module, visual explanation, gamma-ray spectrum, nuclear safety
Citation: Wang Y, Zhang Q, Yao Q, Huo Y, Zhou M and Lu Y (2022) Multiple radionuclide identification using deep learning with channel attention module and visual explanation. Front. Phys. 10:1036557. doi: 10.3389/fphy.2022.1036557
Received: 04 September 2022; Accepted: 28 September 2022;
Published: 19 October 2022.
Edited by:
Jorge Segovia, Universidad Pablo de Olavide, SpainReviewed by:
Kaibo Shi, Chengdu University, ChinaHerun Yang, Institute of Modern Physics, Chinese Academy of Sciences (CAS), China
Xiaodong Zhang, North China Electric Power University, China
Copyright © 2022 Wang, Zhang, Yao, Huo, Zhou and Lu. This is an open-access article distributed under the terms of the Creative Commons Attribution License (CC BY). The use, distribution or reproduction in other forums is permitted, provided the original author(s) and the copyright owner(s) are credited and that the original publication in this journal is cited, in accordance with accepted academic practice. No use, distribution or reproduction is permitted which does not comply with these terms.
*Correspondence: Quanhu Zhang, emhhbmdxaF8xMDJAc2luYS5jb20=