
94% of researchers rate our articles as excellent or good
Learn more about the work of our research integrity team to safeguard the quality of each article we publish.
Find out more
ORIGINAL RESEARCH article
Front. Phys. , 07 December 2022
Sec. Medical Physics and Imaging
Volume 10 - 2022 | https://doi.org/10.3389/fphy.2022.1035539
This article is part of the Research Topic Advances in Quantitative Ultrasound Imaging: Functional Imaging and Tissue Characterization View all 6 articles
 Jasleen Birdi1,2*
 Sophie V. Heymans1,3Gonzalo Collado-Lara4Koen Van Den Abeele3Jan D’hooge1Alexander Bertrand2,5
Ultrasound contrast agents (UCAs) have broadened the scope of ultrasound imaging and therapeutic applications. One of the parameters of interest when measuring the response of UCAs to ultrasound is their frequency-dependent attenuation coefficient. The estimation of this parameter is relevant for sensing and therapeutic applications, as well as for obtaining the viscoelastic properties of the UCA’s shell. The current practice to obtain this coefficient relies on experimental measurements made both in the presence and absence of UCAs in a target medium. Not only is the microbubble-free reference measurement time-consuming, but it may also not always be feasible for in vivo applications due to lack of an appropriate reflector. To overcome these challenges, we present here a novel approach which estimates the UCA’s attenuation spectra directly from pulse-echo measurements made in the underlying UCA medium, without any reference measurement. Furthermore, despite the non-linear frequency dependency of the UCA’s attenuation profile, our approach can still benefit from a fast linear least-squares based estimation scheme, providing attenuation estimates in a single-shot, which is desirable for implementation in real-time systems. We provide an investigative study, testing the estimator’s performance on various simulated realistic attenuation profiles obtained by varying the shell parameters and the UCA’s size distribution. In all cases, the estimated attenuation profiles were in good agreement with the true ones, with a relative error
Ultrasound is one of the most widely used imaging modalities in clinical practice primarily because it is non-invasive, portable, real time and inexpensive. While ultrasound can reproduce the soft tissue anatomy with good contrast, blood, being a far less efficient scatterer than tissue, is invisible on ultrasound images. Ultrasound contrast agents (UCAs) provide a means to tackle this issue, by enhancing the intravascular contrast due to their high echogenicity and hence improving the quality of ultrasonic images. Clinically available UCAs essentially consist of coated microbubbles, administered intravenously to the patient body. They have uses in many diagnostic as well as therapeutic applications [1], including imaging blood perfusion in various organs [2, 3], lesion detection [4], assessing thyroid [5] and ovaries [6]. Moreover, targeted UCAs [7] can be used for molecular imaging [8, 9] as well as for drug delivery [10, 11].
Microbubbles have a gas core enclosed by a lipid, polymer or albumin shell [12]. Their diameter typically lies within the range of a few micrometers, allowing them to circulate in the vasculature [13]. As their gaseous core is highly compressible and leads to a high impedance mismatch with their surroundings, microbubbles are excellent scatterers [14]. The shell stabilizes microbubbles against coalescence, slows down the gas diffusion and protects them against immune clearance [15]. When driven by an ultrasound field, microbubbles undergo volumetric oscillations, and their behaviour can be assimilated to that of harmonic oscillators [16]. In practice, the response of microbubbles to an ultrasound field can be modelled by solving the differential equation of bubble motion; for free, uncoated bubbles, this corresponds to the Rayleigh-Plesset equation [16]. The presence of the microbubble shell is typically accounted for by inserting additional interfacial pressure terms, which represent the viscoelastic properties of the coating [17]. In order to accurately predict the microbubble dynamics, various shell models have been introduced in the literature [18, 19], with different approaches for thick, polymeric shells, such as the Church model [20], and for thin monolayers (i.e., phospholipidic shells), such as the de Jong model [21]. Several modifications of these models have been proposed later [22–24]. While most of these models consider small deformations in the oscillating bubble surface, the Marmottant model [25], proposed for microbubbles coated with a phospholipid monolayer, is able to mimic multiple non-linear phenomena observed experimentally, and has gained wide popularity [26–29]. In particular, when insonated at sufficiently high acoustic pressures, microbubbles oscillate non-linearly, and produce acoustic emissions containing harmonics of the transmitted frequency [15]. Moreover, their acoustic response can be maximized when driven at the resonance frequency, which depends on the bubble size [30]. Therefore, microbubbles exhibit a non-linear frequency dependent attenuation response, with a peak at resonance in the MHz range [29].
Recently, applications requiring assessment of the frequency dependency of the attenuation coefficient of microbubbles in vivo have emerged, such as to relate changes in attenuation to external factors (as in e.g., radiation dosimetry [31, 32]) or to a therapeutic payload release [33]. In addition, quantitative ultrasound applications often require real-time attenuation correction methods [34, 35]. The knowledge of the attenuation coefficient is also of relevance in studying the shell parameters, thereby gaining insights into the microbubbles dynamics in an ultrasound field. In this context, while direct methods to measure shell properties exist [36–38], the shell parameters are most commonly obtained by performing indirect acoustic or optical measurements of the microbubble dynamics [15, 30, 39–41]. A widely-used, simple technique to characterize microbubble populations consists in fitting their estimated frequency-dependent attenuation spectrum to a theoretical prediction of the attenuation obtained from the aforementioned microbubble models to estimate the shell parameters [23, 42–46]. These applications thus highlight the importance of estimating the UCA’s attenuation coefficient.
Currently, the frequency-dependency of the attenuation coefficient of microbubbles is obtained experimentally, through either a transmission measurement or a pulse-echo measurement of a reflector located beyond the microbubble sample [23]. Acquisitions both with and without microbubbles in the targeted medium have to be performed. However, in in vivo applications, the reference measurement may not always be feasible, due to the absence of an appropriate reflector. In addition, this attenuation estimation method is limited to shallow depths or cases with low attenuation, to ensure that the signal reflected by the “reference” structure remains detectable. An alternative approach could be to estimate the attenuation curve directly from the pulse-echo data, mimicking the common practice for attenuation estimation in soft tissues [47–50]. To date, the non-linear frequency dependence of the UCA’s attenuation coefficient has hindered such a usage of any of the existing soft tissue attenuation estimators for UCAs.
In the current work, we take a step forward in this direction and propose a single-shot attenuation coefficient estimation technique for UCAs. The novelty of our approach lies in the following. First, contrarily to the existing method, our approach is developed to estimate the UCA’s attenuation spectra using only the pulse-echo measurements made in the UCAs medium, without requiring any additional reference bubble-free measurement. Second, we propose to approximate the non-linear frequency-dependency of the microbubbles by an Nth order polynomial. This allows to describe the non-linear behavior with a model that is linear in its parameters, rendering the possibility to use an efficient solver for attenuation estimation. Last, motivated by the recent works for soft tissue attenuation coefficient estimation [49–52], we make use of a linear least-squares (LLS) solver aiming to fit the modelled signal to the measured one. As a result, the attenuation estimates can be obtained using a closed-form solution, which can be computed very efficiently and is attractive for real-time implementations [53]. It is worth highlighting that while the choice of the adopted LLS solver is the same as in the aforementioned works, the proposed method differs from these reported works for soft tissue in terms of the underlying (non-linear) model and therefore, present a new approach for UCA’s attenuation coefficient estimation. For performance assessment, we applied our approach on several different attenuation spectral shapes, obtained by varying the shell parameters as well as the size distribution of the microbubbles.
The outline of the manuscript is as follows. We begin by describing the proposed signal model and our approach in Section 2.1. Simulation and experimental settings considered to assess the performance of the method are detailed in Section 2.2, followed by demonstration of the obtained results in Section 3. We then discuss the potential advantages, limitations and future outlook of the proposed approach in Section 4. The concluding remarks are provided in Section 5.
For an isotropic, homogeneous medium, the ultrasound backscattered signal at a frequency f from a depth z in the medium is given by [47, 50].
assuming the diffraction effects to be negligible such as for plane wave propagation. Here, the term |P(f)| corresponds to the pulse-echo frequency spectrum as obtained by a reflector measurement1. The calibration factor G accounts for the uncertainty in the actual energy transmitted to the medium, the term e−2α(f)z represents the attenuation of the signal on its forward and backward propagation path through the medium, and B(f) is the backscatter coefficient of the medium. The terms α(f) and B(f) are determined by the properties of the medium. For instance, in the case of soft tissue, α(f) = α0 f is simply a linear frequency dependence of the attenuation coefficient α0 of the underlying tissue [54]. In the case of microbubbles, the dependence of the attenuation (and backscatter) coefficient on the frequency is highly non-linear, and cannot be described by analytical models. Without this knowledge, it becomes challenging to define a physical signal model which can then be used to solve for the attenuation coefficient. A standard way to deal with this issue is to perform a pulse-echo measurement through the bubbly medium, yielding |S(f, D)|, and compare the reflected spectrum with a reference measurement performed in the absence of microbubbles, i.e., |S(f, D)|ref , where D is the path length from the transducer till the reflector, in meters. The experimental attenuation coefficient αexp(f) of the bubbly medium, in dB/cm, for a pulse-echo measurement is then obtained as
with ln denoting the natural logarithm. As opposed to this approach, our aim here is to develop an estimator which can provide attenuation estimates without relying on time-consuming and sometimes infeasible reference measurements. Based on the fast attenuation coefficient estimation technique for soft tissues [49–52], we consider a log transformation of the signal model (1), obtaining
Here, the left-hand side, denoted by Q(f, z) = ln |S(f, z)| − ln |P(f)|, contains the measured quantities, whereas the terms on the right-hand side are unknown and need to be estimated. Further, in the absence of an analytical expression for α(f) and B(f), we propose to approximate the non-linear attenuation-frequency dependence by an Nth- order polynomial model, i.e.,
where, for i ∈ {0, N}, αi’s are the polynomial coefficients2. Similarly, the backscatter coefficient is approximated by a polynomial model, such that
where, for i ∈ {0, N}, βi’s are the corresponding polynomial coefficients. Our goal is then to estimate the coefficients of these polynomials and plug them into (4) and (5) to estimate α(f) and B(f), respectively.
Unlike the other terms in (3) and (5), ln G and
With these propositions, the log-transformed signal model (3) can be written as a matrix equation for each frequency f, q(f) = A(f) θ, where q(f) corresponds to the measurements Q(f, z) stacked over all M depth points in the medium. The matrix A(f), given in (6), relates these measurements to the vector of unknowns:
where the number of rows of A and the number of entries of q are both equal to M × F. The proposed polynomial approximations (4) and (5) thus allow the description of the measurement process as a set of linear equations (7). This offers the advantage of solving this problem efficiently, in a linear least-squares sense. This provides the main motivation behind using polynomial approximations: more specialized functions could provide more accurate approximations, but they cannot be easily integrated within the current model while keeping it linear in terms of its parameters.
The unknown vector θ in (7) can be estimated from the measured data by solving the minimization problem of the form
where the operator
We refer to our estimator as LLS (Linear Least-Squares). The estimated attenuation spectra (obtained by using the estimated polynomial coefficients from
In terms of computational complexity of the developed estimator, two important computations can be highlighted from (9). First is the computation of the matrix A (and thus
In order to assess I) the validity of the proposed Nth order polynomial approximation of the frequency-dependent attenuation profiles of realistic UCA distributions, and II) the ability of the proposed approach to estimate these attenuation profiles, the theoretical attenuation characteristics of a variety of UCA populations were evaluated using the Marmottant model [25]. Their acoustic response was subsequently simulated and fed to the LLS solver. The theoretical frequency-dependent attenuation profile was then compared to the estimations obtained with the LLS solver.
To obtain the attenuation and backscatter spectra for a range of cases, two different types of microbubble size distributions were considered: polydisperse and monodisperse, as shown in Figure 1. For the polydisperse case, we used the size distribution of SonoVue microbubbles (Bracco Imaging S. p.A., Colleretto Giacosa, Italy), which are commercially available and used in the clinic [57]. The size distribution of SonoVue microbubbles was measured experimentally, with a Coulter Counter Multisizer 3 (Beckman Coulter, Mijdrecht, the Netherlands, 50 μm aperture tube). In the absence of a commercially available monodisperse microbubble formulation, microbubbles mimicking the properties of a research-grade monodisperse contrast agent, MSB4 (Bracco Suisse S.A., Plan-les-Ouates, Switzerland) were simulated, with a mean radius of 2.5 μm [58]. To evaluate the performance of the proposed approach on different attenuation profiles, we varied the shell parameters, namely the elastic modulus χ, in N/m, the surface dilatational viscosity κs, in kg/s, and the initial surface tension σ(R0), in N/m, of the polydisperse microbubble population. This involved considering I) κs as [5, 10] × 10−9 kg/s, II) χ at steps of 0.1 within the range 0.1–1.5 N/m, III) σ(R0) as [0, 0.01, 0.02, 0.05, and 0.07] N/m, at two different acoustic pressures: [10, 20] kPa. The chosen values were in line with other investigation studies [29, 30, 42, 44, 59], and are of interest to the clinical community. For the monodisperse microbubble population, χ = 0.6 N/m and κs = 5.8 × 10⁻⁹ kg/s were used, as reported in [58]. For performance assessment purpose, we considered the bubbles at three different σ(R0) values ([0, 0.01 and 0.05] N/m) and at two different acoustic pressures (10 and 100 kPa).
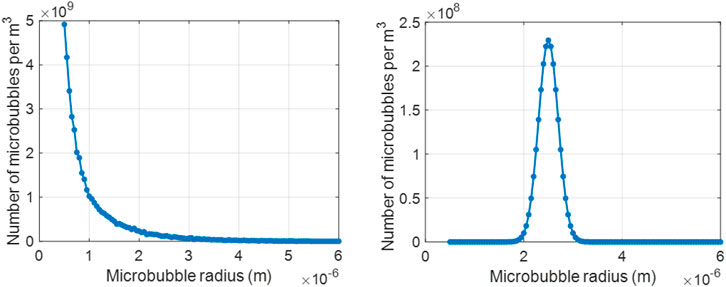
FIGURE 1. Size distribution of the UCAs used in the current work: (left) commercially available polydisperse agent, SonoVue and (right) research-grade monodisperse agent, MSB4.
The theoretical attenuation coefficient of the simulated UCA distributions was derived following the approach described in [29], using the Marmottant model, which is a modification of the Rayleigh-Plesset equation for bubble motion. Briefly, the ordinary differential equation of bubble motion was solved for the radial excursion, R(t), using the shell parameters χ, κ and σ(R0), bubble initial radii R, and acoustic pressures defined above. The acoustic excitation was modelled as a 1.2 mm long Gaussian pulse, with a center frequency of 2.25 MHz. From the obtained microbubble displacement R(t), speed
with n(R) the number of bubbles with radius R per unit volume, δtot(R) the total damping and δrad(R) the radiation damping, whose full expressions can be found in [29]. The frequency-dependent theoretical backscatter coefficient Bth(f), in cm−1ster−1, was given by:
For every combination of the bubble parameters and the acoustic pressure, the pulse-echo radiofrequency (RF) data was simulated in MATLAB from a 60 mm deep medium, consisting of a one-dimensional uniform distribution of point scatterers, and having a sound speed of 1480 m/s. The considered scatterers density was roughly 100 scatterers per mm, in accordance with the Rayleigh scattering condition [60]. Each scatterer was representative of the underlying microbubble population, associated with the ground-truth attenuation, αth(f) and backscatter, Bth(f) characteristics as obtained by solving the Marmottant model (10 and 11). The excitation pulse was set to be identical to the one used in the forward model (see above), transmitted by a single element 2.25 MHz flat transducer, with a relative bandwidth of 110%. The spectrum of the pulse, P(f) was obtained by computing its Fourier transform and it was then used along with the respective αth(f) and Bth(f) spectra to simulate the frequency domain representation of the backscattered signal as per the signal model (1). The frequency domain signal representations were transformed to the time domain by means of an inverse Fourier transform. Finally, the computed time-domain signal for all the point scatterers in the medium were coherently summed up to generate the RF lines, as reported in [50]. In total, 500 RF lines were simulated by considering different realizations of the random scatterers locations in the medium. Further, Gaussian noise was added to the simulated signals to obtain a signal-to-noise ratio of 24 dB.
For evaluation purpose, the generated data was divided into 10 batches, such that each dataset included 50 RF lines - used for a single run of the algorithm. For each RF line, the time-domain signal was partitioned into several overlapping windows (window length of 6 mm, with 75% overlap) and the Fourier spectrum was computed for each of these windows after correcting for spectral leakage using a Hanning window. The magnitude of the Fourier spectrum was averaged over the considered 50 RF lines. The obtained spectra within a usable frequency range ( ∼ 15 dB below the peak of the spectrum) was then used as the measurements to be fed to the approach, thereby providing the attenuation estimates, αLLS, by solving 9. The same process was followed for each of the 10 generated datasets (i.e., with 50 RF lines each) and in turn, for each of the generated datasets with varying underlying shell parameters, bubble size, and acoustic pressure.
Finally, for the implementation of the proposed LLS estimator on these datasets, we chose N = 10, i.e., tenth-order polynomial approximations for the attenuation (4) and backscatter (5) spectra. This choice of the order of polynomial was empirically found to provide enough modelling freedom to approximate the attenuation spectra for many different bubble parameters and for both the polydisperse and monodisperse case (we refer to Section 4 for a more detailed discussion on this aspect).
In order to validate the proposed approach on experimental data, we performed pulse-echo measurements on dispersions of SonoVue microbubbles in water. First, the SonoVue vial was activated by following the guidelines of the manufacturer (Bracco, Switzerland): after injecting 5 ml of a saline NaCl (0.9%) solution, the vial was shaken manually for 20 s. Next, the size distribution and concentration of SonoVue microbubbles was measured with a Coulter Counter Multisizer 3 (Beckman Coulter, Mijdrecht, the Netherlands), using a 50 μm aperture tube. The obtained size distribution was averaged from three measurements and used as an input for the forward modelling of the attenuation coefficient (Figure 1 (a)). Finally, the frequency-dependent attenuation of SonoVue microbubbles was determined acoustically I) by means of the reference phantom approach [29], and II) using the LLS approach developed in section 2.1. A phased array with a center frequency of 2.5 MHz (Philips ATL P4-1, 96 channels, 28.3 mm aperture) was positioned at the surface of a PMMA tank filled with water, and driven by a Verasonics Vantage research platform (Figure 2). A single ultrasound pulse (diverging wave, focused at z = −57 mm) at different pressures, with peak negative pressure values of 14, 93, and 222 kPa (measured by a hydrophone having an uncertainty of 17%), was transmitted to the medium. The backscattered RF signals were recorded in the absence (reference measurements, Figure 2 (left)) and in the presence of SonoVue microbubbles (diluted to reach a concentration of 2.1 × 10⁵ microbubbles/ml), Figure 2 (right).
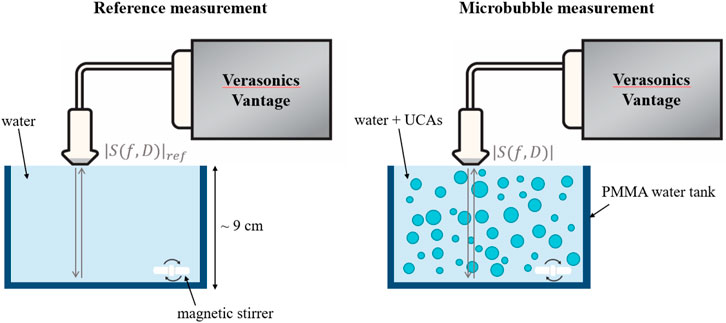
FIGURE 2. Experimental setup used to acquire the in vitro data with SonoVue microbubbles. The backscattered signals from a water phantom containing a dispersion of microbubbles were recorded using a P4-1 probe and Verasonics Vantage system. The attenuation coefficient was obtained both using the reference phantom method and using the proposed LLS approach. For the reference phantom method, the signal backscattered from the bottom wall of the water tank in the absence of microbubbles was used as a reference (left) and compared to the signal acquired in the presence of microbubbles (right). In contrast, the LLS approach only made use of the signal backscatted by the microbubble dispersion (right).
Using the reference phantom approach, the attenuation coefficient, in dB/cm, was computed as per 2, i.e., by comparing the power spectra in the frequency domain of the backscattered signals from the bottom wall of the PMMA tank, in the absence and presence of microbubbles.
For the implementation of the proposed LLS approach on this data, a similar RF data processing approach as followed for the simulated data was adopted. More precisely, the Fourier spectra was computed for overlapping time-gated windows (window length = 6 mm, window overlap = 50%) and averaged over 1000 time frames for which the data was collected for each channel. The usable bandwidth in this case was set to be 10 dB below the pulse spectrum’s peak. The pulse spectrum P(f) was computed by taking the Fourier transform of a pulse-echo reflector measurement in water. Concerning the polynomial approximation of the attenuation and backscatter spectra, N = 10 was chosen in line with the simulated data.
To assess the performance of the LLS estimator on the considered datasets, the attenuation spectra estimated by the proposed approach, αLLS(f) was compared with the benchmark spectra, αbench(f). In the case of simulated data, αbench(f) = αth(f), i.e., the ground-truth spectra obtained theoretically by solving the Marmottant model (10). In the absence of knowledge of the ground-truth spectra for in vitro data, αbench(f) = αexp(f), i.e., the experimentally obtained spectra (2). Moreover, for the simulated case, αLLS(f) was averaged over the estimates obtained with 10 datasets (each with 50 RF lines Section 2.2.1), whereas the averaging for αLLS(f) for the experimental case was done over the estimates obtained from 96 channels of the array, as the medium was homogeneous.
For a quantitative comparison, the relative error between the estimated and the reference spectra for each dataset/channel was computed as:
This section provides the results obtained by applying the proposed LLS estimator on the considered datasets.
The results on the simulated data for SonoVue with one set of shell parameters are presented in Figure 3. The attenuation and backscatter coefficients are shown in the left and right plots, respectively, with their ground-truth (i.e., obtained from the forward theoretical model), estimations by the proposed LLS approach, as well as the tenth-order polynomial best-fit to the true curve. On the one hand, accurate modelling of the true attenuation (and backscatter) profile with a polynomial approximation model can be observed from the polynomial-fitted curve overlapping the true curve. On the other hand, the LLS-estimated curves matching the true ones indicate the good estimation performance of the proposed approach. For the backscatter curve, we highlight that since its absolute value cannot be estimated (as discussed in Section 2.1), the estimated curve was scaled down to optimize the visual comparison between the spectral shapes of the true and estimated coefficient. Further, hereafter, only the results for the attenuation estimates are provided, as it is the focus of the current work.
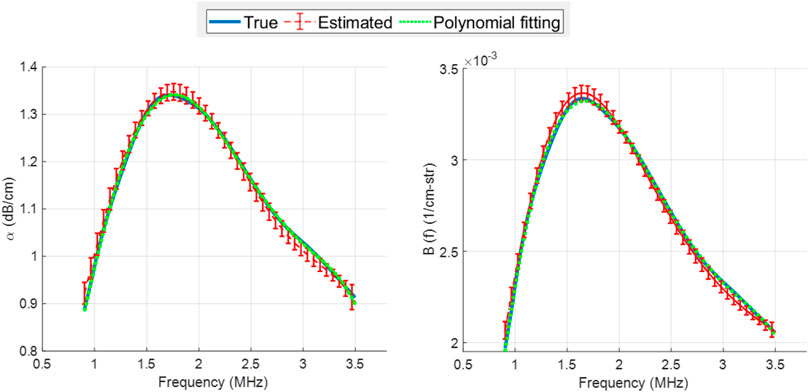
FIGURE 3. Attenuation, α (left) and backscatter, B (right) spectra for SonoVue with κs = 5 × 10⁻⁹ kg/s, χ = 0.5 N/m, σ(R0) = 0.02 N/m, at an acoustic pressure of 10 kPa. In each plot, the true curve (solid blue), LLS estimated curve (dashed red) and the tenth-order polynomial fitting to the true curve (dotted green) are displayed. The estimated curve is the mean computed over the estimator’s results on 10 different datasets, with errorbars denoting the standard deviation.
Figure 4 and Figure 5 display the true (top row) and LLS estimated attenuation spectra (bottom row) for different values of the shell elasticity. These two figures differ in the shell viscosity value, and each column represents a different initial surface tension value. For all cases, even small changes in the attenuation profiles induced by a change in the shell elasticity could be detected accurately by our proposed approach. Moreover, by varying the initial surface tension values, pronounced differences in the underlying attenuation profiles, both in terms of the attenuation values and spectral shape, were observed and recovered accurately by the LLS estimator.
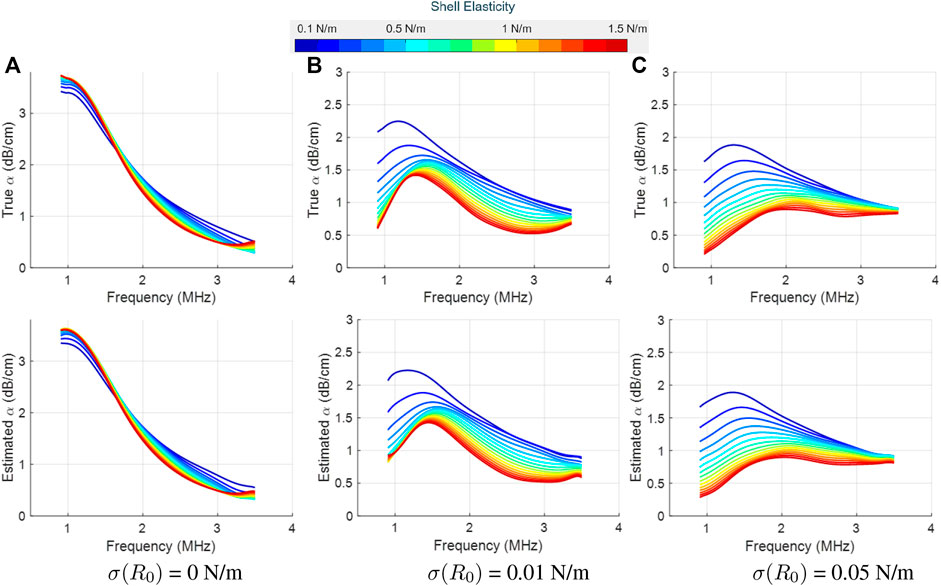
FIGURE 4. True (top row) and LLS estimated (bottom row) attenuation spectra for SonoVue with κs = 5 × 10⁻⁹ kg/s at an acoustic pressure of 10 kPa, as a function of the shell elasticity (values shown in the colorbar). Column-wise, the plots are for three different initial surface tension values: (A) σ(R0) = 0 N/m, (B) σ(R0) = 0.01 N/m, and (C) σ(R0) = 0.05 N/m. The estimated spectrum is the mean computed over the estimator’s results on 10 different datasets.
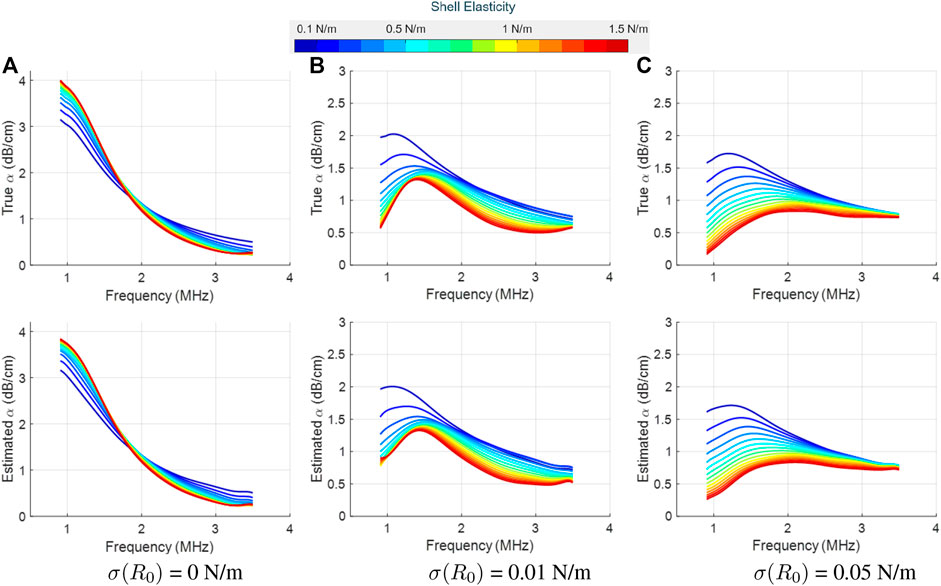
FIGURE 5. True (top row) and LLS estimated (bottom row) attenuation spectra for SonoVue with κs = 10 × 10−9 kg/s at an acoustic pressure of 10 kPa, as a function of the shell elasticity (values shown in the colorbar). Column-wise, the plots are for three different initial surface tension values: (A) σ(R0) = 0 N/m, (B) σ(R0) = 0.01 N/m, and (C) σ(R0) = 0.05 N/m. The estimated spectrum is the mean computed over the estimator’s results on 10 different datasets.
Figure 6 presents the true (solid lines) and estimated (dashed lines) attenuation spectra obtained by varying the initial surface tension values at a fixed shell elasticity χ = 1 N/m. Each plot corresponds to a specific set of the shell viscosity and acoustic pressure values. The attenuation profiles varied considerably as a function of the initial surface tension, particularly from the lowest to the highest value. Despite this, our estimator was able to accurately recover the profiles.
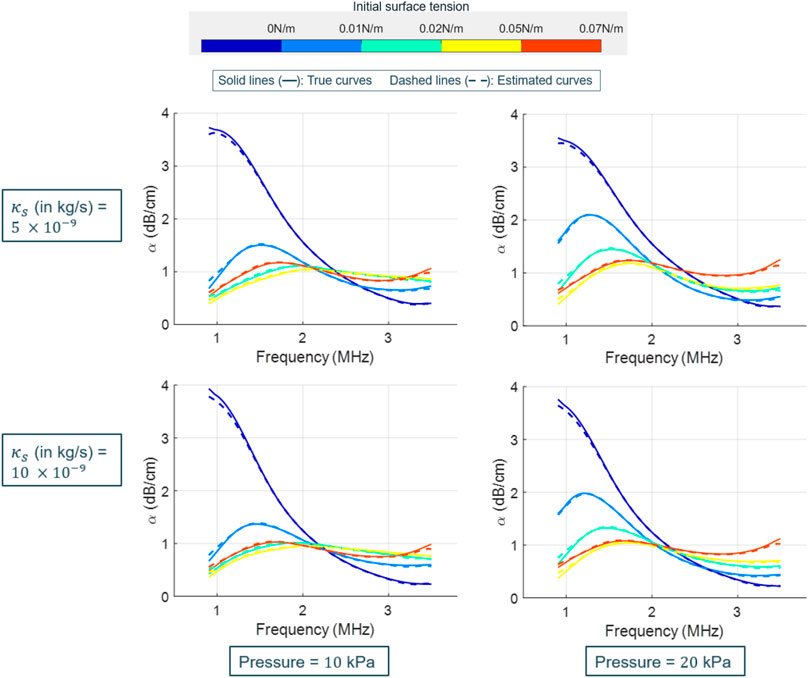
FIGURE 6. Attenuation spectra for SonoVue with χ = 1 N/m, as a function of the initial surface tension (values shown in the colorbar). In each plot, the true (solid lines) and LLS estimated (dashed lines) profiles are displayed. The shown plots are for varying shell viscosities (row-wise) and acoustic pressures (column-wise). The estimated spectra is the mean computed over the estimator’s results on 10 different datasets.
The relative errors in the attenuation estimates as a function of the shell elasticity are provided in Figure 7, for different initial surface tension values and for two shell viscosity values. The errors were found to increase with the shell elasticity values, in particular for intermediate initial surface tension values (between σ(R0) = 0 N/m and the initial surface tension of water, σ(R0) = 0.073 N/m). Overall, in all cases, the relative error of estimation was below 8%, with a mean of ∼ 4% computed over all cases.
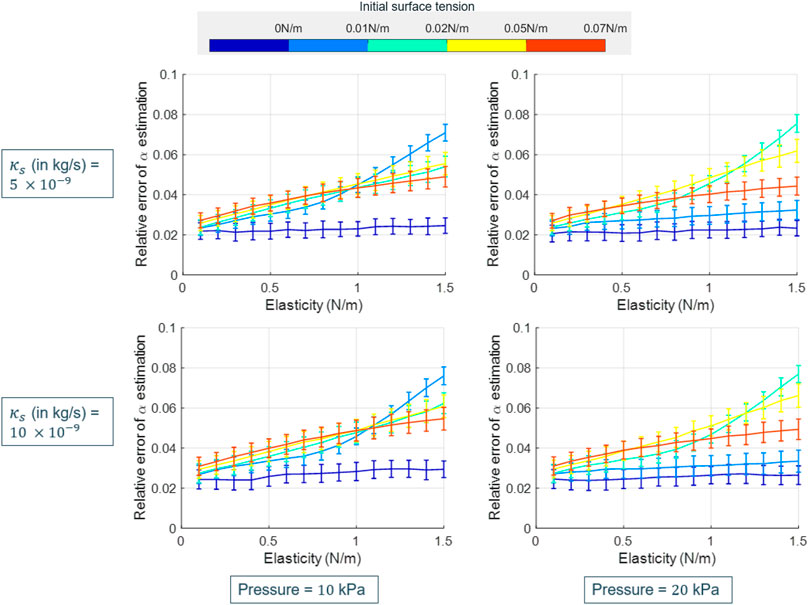
FIGURE 7. Plots for the relative error of the attenuation estimates as obtained by applying the proposed approach on the simulated SonoVue data, as a function of the shell elasticity. In each plot, the relative error curves for different initial surface tension values are displayed (values shown in the colorbar). The shown plots are for varying shell viscosity (row-wise) and acoustic pressure (column-wise), and represent the mean error values, computed over the estimator’s results on 10 different datasets, along with the associated standard deviation in the form of error bars.
Figure 8 shows the true and estimated attenuation curves for the monodisperse bubbles for various cases (column-wise: varying initial surface tension; row-wise: varying acoustic pressure). While the attenuation profiles had a more pronounced peak compared to the polydisperse case, the estimated attenuation curves were still in good agreement with the true profiles, which further highlights the accurate recovery of varying spectral shapes by our LLS estimator. Quantitatively, the relative error of attenuation estimation was found to be below 10% in all the cases.
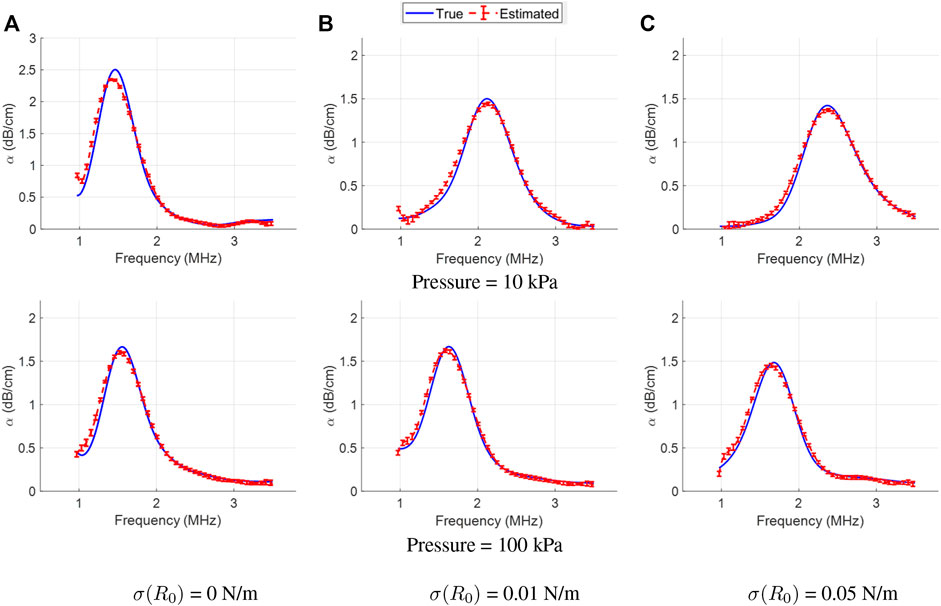
FIGURE 8. True (solid lines) and LLS estimated (dashed lines) attenuation spectra for the monodisperse bubbles, for varying acoustic pressure (row-wise) Column-wise, the plots are for three different initial surface tension values: (A) σ(R0) = 0 N/m, (B) σ(R0) = 0.01 N/m, and (C) σ(R0) = 0.05 N/m. The estimated curve is the mean computed over the estimator’s results on 10 different datasets, with errorbars denoting the standard deviation.
Figure 9 presents the results obtained by the benchmark reference phantom method (solid blue curves) and the proposed LLS estimator (dashed red curves) on the experimentally acquired SonoVue data at three different acoustic pressures. The resonance peak of the attenuation spectra of the underlying UCA was outside the usable bandwidth of the array and thus cannot be observed in these plots. Overall, the attenuation spectra from both methods had a similar shape, with a relative error
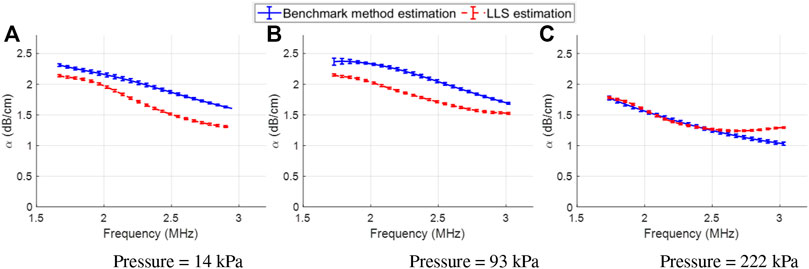
FIGURE 9. Experimentally obtained benchmark (blue curves) and LLS estimated (red curves) attenuation spectra for the SonoVue bubbles, at varying acoustic pressures (column-wise): (A) Pressure = 14 kPa, (B) Pressure = 93 kPa, and (C) Pressure = 222 kPa. For both benchmark and LLS estimated curves, the shown curves are the mean results computed across all the channels in the array, with errorbars denoting the standard deviation.
In this contribution, we developed and presented a physical attenuation model which enables a single-shot estimation of the attenuation spectra of UCAs. By approximating the UCA’s attenuation spectra with an Nth order polynomial, we were able to obtain a model that is linear in its parameters. We observed that the non-linear frequency response of the UCA’s attenuation profile can be approximated well by a tenth-order polynomial in a variety of situations. This allowed to estimate the attenuation spectra directly from pulse-echo measurements made in the UCAs medium, removing the need for a reference measurement in a bubble-free medium. Using the proposed polynomial approximation, the developed estimator’s performance was assessed on a variety of attenuation profiles, with different shapes and absolute values. These profiles were obtained by considering different size distributions of the microbubbles (polydisperse and monodisperse), and also by varying the shell parameters. More precisely, for the polydisperse case, varying the shell elasticity while keeping the other shell parameters fixed resulted in a shift in the resonance frequency and in the peak attenuation amplitude. These changes were even more pronounced when the initial surface tension was varied. As a matter of fact, by reducing the initial surface tension value down to 0 N/m, the resonance peak was shifted towards the lower frequency to an extent that it was out of the usable bandwidth of the probe. This led to a strikingly different profile for this surface tension value when compared to those obtained with higher surface tension values. Further, compared to the polydisperse case, the monodisperse bubbles had attenuation profiles with a sharply decreasing amplitude after the resonance peak. By increasing the pressure from 10 kPa to 100 kPa, a non-linear pressure-dependent shift in resonance frequency towards lower frequency values was observed [26]. While these observations are in line with the reported works in the literature [15, 17, 27, 29], it was interesting to see that the changes in the attenuation spectra, both minor and major ones, were accurately recovered by our estimator, with a relative error of estimation
The estimator’s performance was also assessed on in vitro data. In this case, the LLS estimated attenuation spectra were overall found to be matching the experimentally obtained attenuation spectra with less than 15% relative error. However, the low resonance frequency of the UCAs implied that the resonance peak could not be detected, as it laid outside of the -10 dB bandwidth of the array. To analyse whether the resonance peak could be recovered, the frequency bounds were further increased (outside of the transducer’s usable bandwidth), but at the cost of probing frequencies with poor SNR. In this case, a relative error of
Some interesting points pertain to the impact of the bubble concentration and the acoustic pressure on the performance of the proposed method. At sufficiently high bubble concentration and hence, more scattered energy, the excitation of the distal bubbles will be reduced. This would not only impact the frequency-dependent attenuation of these bubbles, but also the backscattered signal from these distal regions will have a lower power (and hence, a lower signal-to-noise ratio (SNR)). This presents a trade-off between the bubble concentration and the depth of interest with reasonable SNR over which to apply the attenuation estimator. Further, the bubble concentrations used in the presented study were sufficiently low to neglect multiple scattering effects. By increasing the concentration to the extent that multiple scattering occurs, our approach could still retrieve the attenuation coefficient. However, in this case, the estimated attenuation profile can no longer be used to estimate the bubble shell parameters as 10 and 11 are no longer valid. Concerning the acoustic pressure, the non-linearity of the microbubble response to the ultrasound field increases with pressure. Nonetheless, as long as the attenuation-frequency response has a resonant behaviour and can be fit by a polynomial approximation, our approach could work and is expected to provide attenuation estimates with reasonable accuracy (eg., the results in Figure 9C). Sufficiently high pressures can actually lead to bubble disruption [61]. Disruption will result in a decrease of the bubble concentration, which will ultimately decrease the acoustic attenuation of subsequent pulses. While our method is expected to work in this scenario, these remarks need to be experimentally tested in future studies.
As indicated earlier, the attenuation spectra obtained by acoustic measurements only provide a cumulative value over the whole acoustic path. This approach thus could not be used for the case of a heterogeneous medium (for instance, a medium with varying microbubble concentrations), where obtaining the spatial variations of the attenuation is of interest. In contrast, the proposed LLS method can be generalized to the heterogeneous case to estimate the attenuation values at each frequency and depth point [52]. This is, however, beyond the scope of this manuscript. In addition, from a computational perspective, the LLS estimator is fast (Section 2.1): for each situation, the estimation was performed in the order of few seconds with a MATLAB implementation on a personal computer with i7 processor and 8 GB RAM. To translate the estimator into clinical practice, faster implementations can be further obtained by using C/C++.
Another important discussion point is the polynomial order to be used for approximating the underlying attenuation spectra. The results presented in the current work used a tenth-order polynomial approximation for all the attenuation profiles obtained by considering different agents and varying the shell parameters. On the one hand, this polynomial approximation was found to be particularly suited to the monodisperse bubbles, giving more accurate results than smaller order polynomial approximations. On the other hand, we observed that even a fifth-order polynomial approximation for the polydisperse case was giving results similar to higher order approximation. Therefore, while the exact choice of the order of polynomial approximation depends upon the UCA under use, higher order polynomials might perform well in general for all cases, as they are able to mimic more complicated variations in the underlying profile. The increase in the polynomial order, however, comes at the cost of increased degrees of freedom, i.e., the number of polynomial coefficients to be estimated, which incurs a risk of overfitting. No appreciable overfitting behavior was observed though in the cases where a tenth-order polynomial was used. Further, a piece-wise (low-order) polynomial fitting over different segments in the spectrum can be used to get a more accurate approximation rather than a fit with a single tenth-order polynomial over the entire usable bandwidth as used currently. It would however increase the computational burden.
While giving promising results, this study has a few limitations, which are indicated below along with potential future research directions.
1) In the current work, the Marmottant model was used to obtain the theoretical attenuation spectra for UCAs. While it provided a variety of realistic attenuation profiles for validation of the proposed approach, the scope of investigation was limited. More complex shell models can further be explored to generate the attenuation profiles on which our approach can be tested.
2) The experimental data used in the current study for validation of the proposed approach could not capture the attenuation resonance peak due to the limited array bandwidth. A more extensive validation campaign of the approach on a variety of datasets would thus be desirable, including transducers with varying bandwidths as well as UCAs with different resonance frequencies. This, however, is beyond the scope of this manuscript.
3) The proposed method relies on the assumption that the diffraction effects are negligible. This hypothesis can be satisfied using plane wave propagation or imaging in the far-field of the transducer. However, even though plane wave transmissions are being increasingly implemented for ultrafast imaging applications [62], this might not be possible for all the clinically-relevant scenarios, and the presented approach cannot efficiently deal with such diffraction-affected data. In practice, a reference phantom measurement could be performed and the ratio of the power spectrum of the sample and that of the reference phantom can be taken to cancel out the diffraction effects. The proposed LLS estimator can then be used on the obtained data [50]. Another possibility is to leverage recent advances in the field of deep learning and devise an approach to correct for the diffraction effects. The work done in [63] to develop a neural network approach for attenuation estimation of soft tissue could be generalized to use the UCA’s signal model.
4) Finally, the current work considers the underlying medium to be consisting of UCAs only. While this work presents the first step towards estimating the attenuation spectra of the UCAs accurately in real time without any reference measurement, future research directions should further incorporate the attenuation characteristics jointly from a medium consisting of both UCAs and soft tissue, which is more commonly encountered. Since soft tissue exhibit linear attenuation-frequency dependence, it should be straightforward to combine their attenuation model with the proposed linearized UCAs attenuation model.
In this work, we have presented a new, fast and accurate attenuation estimation technique for ultrasound contrast agents (UCAs). One of the key points of our technique is approximating the non-linear frequency dependence of the UCAs attenuation and backscatter spectra by a polynomial model of suitable order. Thanks to this proposition, we obtained a physical signal model, which is linear in its parameters, allowing to use it in a linear least-squares (LLS) approach for the attenuation and backscatter estimation. Our approach provided the estimates in a single-shot, which were found to be in good agreement with the true ones. Moreover, as opposed to the common practice, the estimates were obtained directly from pulse-echo measurements made in the UCA’s medium, without relying on any additional reference measurements. The results obtained by the LLS estimator on both simulated data, with agents having different size distributions and shell parameters, and experimental data are promising.
Further inquiries about the data availability can be directed to the corresponding author.
JB implemented the research, performed the simulation and experimental studies, analysed the results and wrote the manuscript. SH performed the in vitro measurements, analysed the acquired data, contributed towards the results analysis and manuscript writing. GC-L performed the in vitro measurements, contributed towards revising the submitted manuscript. KV conceptualized the idea and discussed the results. JD and AB supervised this project, conceptualized the idea and contributed towards revising the submitted manuscript. All authors have read the manuscript and agreed to the submitted version of the manuscript.
This work has been supported by the European Union’s Horizon 2020 research and innovation programme under grant agreement number 766456 (project AMPHORA).
The authors declare that the research was conducted in the absence of any commercial or financial relationships that could be construed as a potential conflict of interest.
All claims expressed in this article are solely those of the authors and do not necessarily represent those of their affiliated organizations, or those of the publisher, the editors and the reviewers. Any product that may be evaluated in this article, or claim that may be made by its manufacturer, is not guaranteed or endorsed by the publisher.
The Supplementary Material for this article can be found online at: https://www.frontiersin.org/articles/10.3389/fphy.2022.1035539/full#supplementary-material
1The shape of |P(f)| is only required up to a scaling factor, as the latter is accounted for by the generic scaling parameter G. A simple reflector measurement in water is sufficient.
2α(f) needs to be converted to dB/cm in order to compare it with the experimentally obtained αexp(f) in (2).
3If an extra calibration is performed to measure G, we would be able to also estimate the scale of B(f) by subtracting ln G from the estimated β0. However, this is beyond the scope of this paper, as we are here only interested in the attenuation coefficient α(f).
4For a vector
2. Porter TR, Xie F. Myocardial perfusion imaging with contrast ultrasound. JACC: Cardiovasc Imaging (2010) 3:176–87. doi:10.1016/j.jcmg.2009.09.024
3. Seidel G, Claassen L, Meyer K, Vidal-Langwasser M. Evaluation of blood flow in the cerebral microcirculation: Analysis of the refill kinetics during ultrasound contrast agent infusion. Ultrasound Med Biol (2001) 27:1059–64. doi:10.1016/s0301-5629(01)00416-1
4. Sridharan A, Eisenbrey JR, Dave J, Forsberg F. Quantitative nonlinear contrast-enhanced ultrasound of the breast. Am J Roentgenology (2016) 207:274–81. doi:10.2214/ajr.16.16315
5. Bartolotta TV, Midiri M, Galia M, Runza G, Attard M, Savoia G, et al. Qualitative and quantitative evaluation of solitary thyroid nodules with contrast-enhanced ultrasound: Initial results. Eur Radiol (2006) 16:2234–41. doi:10.1007/s00330-006-0229-y
6. D’arcy T, Jayaram V, Lynch M, Soutter W, Cosgrove D, Harvey C, et al. Ovarian cancer detected non-invasively by contrast-enhanced power Doppler ultrasound. BJOG: Intern J Obs Gyn (2004) 111:619–22. doi:10.1111/j.1471-0528.2004.00157.x
7. Klibanov AL. Targeted delivery of gas-filled microspheres, contrast agents for ultrasound imaging. Adv Drug Deliv Rev (1999) 37:139–57. doi:10.1016/s0169-409x(98)00104-5
8. Yap ML, McFadyen JD, Wang X, Zia NA, Hohmann JD, Ziegler M, et al. Targeting activated platelets: A unique and potentially universal approach for cancer imaging. Theranostics (2017) 7:2565–74. doi:10.7150/thno.19900
9. Abou-Elkacem L, Bachawal SV, Willmann JK. Ultrasound molecular imaging: Moving toward clinical translation. Eur J Radiol (2015) 84:1685–93. doi:10.1016/j.ejrad.2015.03.016
10. Wang X, Gkanatsas Y, Palasubramaniam J, Hohmann JD, Chen YC, Lim B, et al. Thrombus-targeted theranostic microbubbles: A new technology towards concurrent rapid ultrasound diagnosis and bleeding-free fibrinolytic treatment of thrombosis. Theranostics (2016) 6:726–38. doi:10.7150/thno.14514
11. Klibanov AL. Microbubble contrast agents: Targeted ultrasound imaging and ultrasound-assisted drug-delivery applications. Invest Radiol (2006) 41:354–62. doi:10.1097/01.rli.0000199292.88189.0f
12. Ferrara K, Pollard R, Borden M. Ultrasound microbubble contrast agents: Fundamentals and application to gene and drug delivery. Annu Rev Biomed Eng (2007) 9:415–47. doi:10.1146/annurev.bioeng.8.061505.095852
13. Stride E, Segers T, Lajoinie G, Cherkaoui S, Bettinger T, Versluis M, et al. Microbubble agents: New directions. Ultrasound Med Biol (2020) 46:1326–43. doi:10.1016/j.ultrasmedbio.2020.01.027
14. Hoff L. Acoustic characterization of contrast agents for medical ultrasound imaging. Springer Science & Business Media (2001).
15. de Jong N, Emmer M, van Wamel A, Versluis M. Ultrasonic characterization of ultrasound contrast agents. Med Biol Eng Comput (2009) 47:861–73. doi:10.1007/s11517-009-0497-1
17. Emmer M, de Jong N, Versluis M, Faez T, van der Steen AFW, Kooiman K. 20 Years of ultrasound contrast agent modeling. IEEE Trans Ultrason Ferroelectr Freq Control (2013) 60:7–20. doi:10.1109/tuffc.2013.2533
18. Doinikov AA, Bouakaz A. Review of shell models for contrast agent microbubbles. IEEE Trans Ultrason Ferroelect Freq Contr (2011) 58:981–93. doi:10.1109/tuffc.2011.1899
19. Faez T, Emmer M, Kooiman K, Versluis M, van der Steen AF, de Jong N. 20 years of ultrasound contrast agent modeling. IEEE Trans Ultrason Ferroelectr Freq Control (2012) 60:7–20. doi:10.1109/tuffc.2013.2533
20. Church CC. The effects of an elastic solid surface layer on the radial pulsations of gas bubbles. The J Acoust Soc America (1995) 97:1510–21. doi:10.1121/1.412091
21. de Jong N, Hoff L, Skotland T, Bom N. Absorption and scatter of encapsulated gas filled microspheres: Theoretical considerations and some measurements. Ultrasonics (1992) 30:95–103. doi:10.1016/0041-624x(92)90041-j
22. Morgan KE, Allen JS, Dayton PA, Chomas JE, Klibaov A, Ferrara KW. Experimental and theoretical evaluation of microbubble behavior: Effect of transmitted phase and bubble size. IEEE Trans Ultrason Ferroelect Freq Contr (2000) 47:1494–509. doi:10.1109/58.883539
23. Hoff L, Sontum PC, Hovem JM. Oscillations of polymeric microbubbles: Effect of the encapsulating shell. J Acoust Soc America (2000) 107:2272–80. doi:10.1121/1.428557
24. Chatterjee D, Sarkar K. A Newtonian rheological model for the interface of microbubble contrast agents. Ultrasound Med Biol (2003) 29:1749–57. doi:10.1016/s0301-5629(03)01051-2
25. Marmottant P, Van Der Meer S, Emmer M, Versluis M, De Jong N, Hilgenfeldt S, et al. A model for large amplitude oscillations of coated bubbles accounting for buckling and rupture. J Acoust Soc America (2005) 118:3499–505. doi:10.1121/1.2109427
26. Overvelde M, Garbin V, Sijl J, Dollet B, de Jong N, Lohse D, et al. Nonlinear shell behavior of phospholipid-coated microbubbles. Ultrasound Med Biol (2010) 36:2080–92. doi:10.1016/j.ultrasmedbio.2010.08.015
27. Sijl J, Gaud E, Frinking PJA, Arditi M, de Jong N, Lohse D, et al. Acoustic characterization of single ultrasound contrast agent microbubbles. J Acoust Soc America (2009) 124:4091–7. doi:10.1121/1.2997437
28. van Rooij T, Luan Y, Renaud G, van der Steen AF, Versluis M, de Jong N, et al. Non-linear response and viscoelastic properties of lipid-coated microbubbles: DSPC versus DPPC. Ultrasound Med Biol (2015) 41:1432–45. doi:10.1016/j.ultrasmedbio.2015.01.004
29. Segers T, De Jong N, Versluis M. Uniform scattering and attenuation of acoustically sorted ultrasound contrast agents: Modeling and experiments. J Acoust Soc America (2016) 140:2506–17. doi:10.1121/1.4964270
30. van der Meer SM, Dollet B, Voormolen MM, Chin CT, Bouakaz A, de Jong N, et al. Microbubble spectroscopy of ultrasound contrast agents. J Acoust Soc America (2007) 121:648–56. doi:10.1121/1.2390673
31. Collado-Lara G, Heymans SV, Godart J, D’Agostino E, D’hooge J, Van Den Abeele K, et al. Effect of a radiotherapeutic megavoltage beam on ultrasound contrast agents. Ultrasound Med Biol (2021) 47:1857–67. doi:10.1016/j.ultrasmedbio.2021.02.021
32. Verboven E, D’Agostino E, Callens M, Pfeiffer H, Verellen D, D’hooge J, et al. Ultrasound based dosimetry for radiotherapy: In-vitro proof of principle. Chicago, IL): IEEE International Ultrasonics Symposium (2014). p. 2265–8.
33. Shekhar H, Palaniappan A, Peng T, Lafond M, Moody MR, Haworth KJ, et al. Characterization and imaging of lipid-shelled microbubbles for ultrasound-triggered release of xenon. Neurotherapeutics (2019) 16:878–90. doi:10.1007/s13311-019-00733-4
34. Mulé S, De Cesare A, Lucidarme O, Frouin F, Herment A. Regularized estimation of contrast agent attenuation to improve the imaging of microbubbles in small animal studies. Ultrasound Med Biol (2008) 34:938–48. doi:10.1016/j.ultrasmedbio.2007.11.014
35. Tang MX, Mari JM, Wells PN, Eckersley RJ. Attenuation correction in ultrasound contrast agent imaging: Elementary theory and preliminary experimental evaluation. Ultrasound Med Biol (2008) 34:1998–2008. doi:10.1016/j.ultrasmedbio.2008.04.008
36. Owen J, Stride E. Technique for the characterization of phospholipid microbubbles coatings by Transmission Electron Microscopy. Ultrasound Med Biol (2015) 41:3253–8. doi:10.1016/j.ultrasmedbio.2015.07.024
37. Sboros V, Glynos E, Pye SD, Moran CM, Butler M, Ross J, et al. Nanointerrogation of ultrasonic contrast agent microbubbles using Atomic Force Microscopy. Ultrasound Med Biol (2006) 32:579–85. doi:10.1016/j.ultrasmedbio.2005.12.016
38. Santos EB, Morris JK, Glynos E, Sboros V, Koutsos V. Nanomechanical properties of phospholipid microbubbles. Langmuir (2012) 28:5753–60. doi:10.1021/la204801u
39. Lum JS, Dove JD, Murray TW, Borden MA. Single microbubble measurements of lipid monolayer viscoelastic properties for small-amplitude oscillations. Langmuir (2016) 32:9410–7. doi:10.1021/acs.langmuir.6b01882
40. Daeichin V, Inzunza-Ibarra MA, Lum JS, Borden MA, Murray TW. Photoacoustic impulse response of lipid-coated ultrasound contrast agents. IEEE Trans Ultrason Ferroelect Freq Contr (2021) 68:2311–4. doi:10.1109/tuffc.2021.3052140
41. Helfield BL, Goertz DE. Nonlinear resonance behavior and linear shell estimates for definityTM and micromarkerTM assessed with acoustic microbubble spectroscopy. J Acoust Soc America (2013) 133:1158–68. doi:10.1121/1.4774379
42. Gorce JM, Arditi M, Schneider M. Influence of bubble size distribution on the echogenicity of ultrasound contrast agents - a study of SonoVue. Invest Radiol (2000) 35:661–71. doi:10.1097/00004424-200011000-00003
43. Marsh JN, Hall CS, Hughes MS, Mobley J, Miller JG, Brandenburger GH. Broadband through-transmission signal loss measurements of Albunex® suspensions at concentrations approaching in vivo doses. J Acoust Soc America (1997) 101:1155–61. doi:10.1121/1.418270
44. Goertz DE, de Jong N, van der Steen AF. Attenuation and size distribution measurements of definityTM and manipulated definityTM populations. Ultrasound Med Biol (2007) 33:1376–88. doi:10.1016/j.ultrasmedbio.2007.03.009
45. Raymond JL, Haworth KJ, Bader KB, Radhakrishnan K, Griffin JK, Huang SL, et al. Broadband attenuation measurements of phospholipid-shelled ultrasound contrast agents. Ultrasound Med Biol (2014) 40:410–21. doi:10.1016/j.ultrasmedbio.2013.09.018
46. Segers T, Gaud E, Versluis M, Frinking P. High-precision acoustic measurements of the nonlinear dilatational elasticity of phospholipid coated monodisperse microbubbles. Soft Matter (2018) 14:9550–61. doi:10.1039/c8sm00918j
47. Nam K, Zagzebski JA, Hall TJ. Simultaneous backscatter and attenuation estimation using a least squares method with constraints. Ultrasound Med Biol (2011) 37:2096–104. doi:10.1016/j.ultrasmedbio.2011.08.008
48. Vajihi Z, Rosado-Mendez IM, Hall TJ, Rivaz H. Low variance estimation of backscatter quantitative ultrasound parameters using dynamic programming. IEEE Trans Ultrason Ferroelect Freq Contr (2018) 65:2042–53. doi:10.1109/tuffc.2018.2869810
49. Jafarpisheh N, Hall TJ, Rivaz H, Rosado-Mendez IM. Analytic global regularized backscatter quantitative ultrasound. IEEE Trans Ultrason Ferroelect Freq Contr (2020) 68:1605–17. doi:10.1109/tuffc.2020.3042942
50. Birdi J, Muraleedharan A, D’hooge J, Bertrand A. Fast linear least-squares method for ultrasound attenuation and backscatter estimation. Ultrasonics (2021) 116:106503. doi:10.1016/j.ultras.2021.106503
51. Birdi J, D’hooge J, Bertrand A. Spatially variant attenuation and backscatter coefficient estimation using a regularized linear least-squares approach. In: Proceeding of the 2021 IEEE International Ultrasonics Symposium (IUS); September 2021; Xi'an, China. IEEE (2021). p. 1–3.
52. Birdi J, D’hooge J, Bertrand A. Spatially variant ultrasound attenuation mapping using a regularized linear least-squares approach. IEEE Trans Ultrason Ferroelect Freq Contr (2022) 69:1596–609. doi:10.1109/tuffc.2022.3157949
53. Nooijens S, Hewener H, Ingram M, Birdi J, Muraleedharan A, Tretbar S, et al. Real-time attenuation estimation on an experimental ultrasound system. In: Proceeding of the 2021 IEEE International Ultrasonics Symposium (IUS). (Xi’an, China: IEEE) (2021).
54. Flax SW, Pelc NJ, Glover GH, Gutmann FD, McLachlan M. Spectral characterization and attenuation measurements in ultrasound. Ultrason Imaging (1983) 5:95–116. doi:10.1016/0161-7346(83)90013-5
56. Nussbaumer HJ. The fast Fourier transform. In: Fast fourier transform and convolution algorithms. Springer (1981). p. 80–111.
57. Greis C. Technology overview: Sonovue (bracco, milan). Eur Radiol (2004) 14(Suppl 8):P11–15. doi:10.1007/s10406-004-0076-3
58. Helbert A, Gaud E, Segers T, Botteron C, Frinking P, Jeannot V. Monodisperse versus polydisperse ultrasound contrast agents: In vivo sensitivity and safety in rat and pig. Ultrasound Med Biol (2020) 46:3339–52. doi:10.1016/j.ultrasmedbio.2020.07.031
59. Helfield B. A review of phospholipid encapsulated ultrasound contrast agent microbubble Physics. Ultrasound Med Biol (2019) 45:282–300. doi:10.1016/j.ultrasmedbio.2018.09.020
60. Georgiou G, Cohen FS. Statistical characterization of diffuse scattering in ultrasound images. IEEE Trans Ultrason Ferroelect Freq Contr (1998) 45:57–64. doi:10.1109/58.646911
61. Bouakaz A, Versluis M, de Jong N. High-speed optical observations of contrast agent destruction. Ultrasound Med Biol (2005) 31:391–9. doi:10.1016/j.ultrasmedbio.2004.12.004
62. Tanter M, Fink M. Ultrafast imaging in biomedical ultrasound. IEEE Trans Ultrason Ferroelect Freq Contr (2014) 61:102–19. doi:10.1109/TUFFC.2014.2882
Keywords: ultrasound contrast agents, microbubbles, pulse-echo, quantitative ultrasound, attenuation coefficient, least squares
Citation: Birdi J, Heymans SV, Collado-Lara G, Van Den Abeele K, D’hooge J and Bertrand A (2022) Single-shot attenuation coefficient estimation for ultrasound contrast agents. Front. Phys. 10:1035539. doi: 10.3389/fphy.2022.1035539
Received: 02 September 2022; Accepted: 21 November 2022;
Published: 07 December 2022.
Edited by:
Hideyuki Hasegawa, University of Toyama, JapanReviewed by:
Muhammad Mujtaba Shaikh, Mehran University of Engineering and Technology, PakistanCopyright © 2022 Birdi, Heymans, Collado-Lara, Van Den Abeele, D’hooge and Bertrand. This is an open-access article distributed under the terms of the Creative Commons Attribution License (CC BY). The use, distribution or reproduction in other forums is permitted, provided the original author(s) and the copyright owner(s) are credited and that the original publication in this journal is cited, in accordance with accepted academic practice. No use, distribution or reproduction is permitted which does not comply with these terms.
*Correspondence: Jasleen Birdi, amFzbGVlbi5iaXJkaUBrdWxldXZlbi5iZQ==
Disclaimer: All claims expressed in this article are solely those of the authors and do not necessarily represent those of their affiliated organizations, or those of the publisher, the editors and the reviewers. Any product that may be evaluated in this article or claim that may be made by its manufacturer is not guaranteed or endorsed by the publisher.
Research integrity at Frontiers
Learn more about the work of our research integrity team to safeguard the quality of each article we publish.