
95% of researchers rate our articles as excellent or good
Learn more about the work of our research integrity team to safeguard the quality of each article we publish.
Find out more
ORIGINAL RESEARCH article
Front. Phys. , 28 October 2022
Sec. Medical Physics and Imaging
Volume 10 - 2022 | https://doi.org/10.3389/fphy.2022.1034783
This article is part of the Research Topic Physics-Informed Medical Data Analysis View all 4 articles
 Sebastian Gutschmayer1
 Otto Muzik2*
 Zacharias Chalampalakis3
 Daria Ferrara1Josef Yu1
 Kilian Kluge4
 Ivo Rausch1
 Ronald Boellaard5
 Sandeep S.V. Golla5
 Sven Zuehlsdorff6Hartwig Newiger7
 Thomas Beyer1
 Lalith Kumar Shiyam Sundar1
Aim/Introduction: Patient head motion poses a significant challenge when performing dynamic PET brain studies. In response, we developed a fast, robust, easily implementable and tracer-independent brain motion correction technique that facilitates accurate alignment of dynamic PET images.
Materials and methods: Correction of head motion was performed using motion vectors derived by the application of Gaussian scale-space theory. A multiscale pyramid consisting of three different resolution levels (1/4x: coarse, 1/2x: medium, and 1x: fine) was applied to all image frames (37 frames, framing of 12 × 10s, 15 × 30s, 10 × 300s) of the dynamic PET sequence. Frame image alignment was initially performed at the coarse scale, which was subsequently used to initialise coregistration at the next finer scale, a process repeated until the finest possible scale, that is, the original resolution was reached. In addition, as tracer distribution changes during the dynamic frame sequence, a mutual information (MI) score was used to identify the starting frame for motion correction that is characterised by a sufficiently similar tracer distribution with the reference (last) frame. Validation of the approach was performed based on a simulated F18-fluoro-deoxy-glucose (FDG) dynamic sequence synthesised from the digital Zubal phantom. Inter-frame motion was added to each dynamic frame (except the reference frame). Total brain voxel displacement based on the added motion was constrained to 25 mm, which included both translation (0–15 mm in x, y and z) and rotation (0–0.3 rad for each Euler angle). Twenty repetitions were performed for each dataset with arbitrarily simulated motion, resulting in 20 synthetic datasets, each consisting of 36 dynamic frames (frame 37 was the reference frame). Assessment of motion correction accuracy across the dynamic sequence was performed based on the uncorrected/residual displacement remaining after the application of our algorithm. To investigate the clinical utility of the developed algorithm, three clinically cases that underwent list-mode PET imaging utilising different tracers ([18F]-fluoro-deoxy-glucose [18F]FDG [18F]-fluoroethyl-l-tyrosine [18F]FET [11C]-alpha-methyl-tryptophan [11C]AMT), each characterised by a different temporal tracer distribution were included in this study. Improvements in the Dice score coefficient (DSC) following frame alignment were evaluated as the correlation significance between the identified displacement for each frame of the clinical FDG, FET and AMT dynamic sequences.
Results: Sub-millimetre accuracy (0.4 ± 0.2 mm) was achieved in the Zubal phantom for all frames after 5 min p. i., with early frames (30 s–180 s) displaying a higher residual displacement of ∼3 mm (3.2 ± 0.6 mm) due to differences in tracer distribution relative to the reference frame. The effect of these differences was also seen in MI scores; the MI plateau phase was reached at 35s p. i., 2.0 and 2.5 min p. i. At the coarse, medium and fine resolution levels, respectively. For the clinical images, a significant correlation between the identified (and corrected) displacement and the improvement in DSC score was seen in all dynamic studies (FET: R = 0.49, p < 0.001; FDG: R = 0.82, p < 0.001; AMT: R = 0.92, p < 0.001).
Conclusion: The developed motion correction method is insensitive to any specific tracer distribution pattern, thus enabling improved correction of motion artefacts in a variety of clinical applications of extended PET imaging of the brain without the need for fiducial markers.
Molecular imaging using positron emission tomography (PET) is currently the most sensitive methodology to non-invasively study human brain function [1]. Owing to a large number of molecular substrates and receptor ligands that can be labelled using positron emitters, PET imaging can help untangle the complex molecular processes that take place in spatially localised and strongly interacting neural networks of the brain [2]. Recent advances in PET imaging technology that leverage large axial-FOV data acquisition technology [3,4] further increase the volume sensitivity of this imaging method, making high-temporal resolution dynamic PET studies feasible routinely. The achievable temporal resolution decreased to the order of 2–5 s, rivalling the temporal resolution of fMRI studies [5]. However, similar to methodological challenges associated with fMRI studies, the accurate extraction of time series from small regions of the brain in PET imaging is impaired by involuntary subject motion, which is of the same magnitude as the spatial resolution of the imaging device (∼4 mm FWHM) [6]. However, unlike fMRI brain sequences, dynamic PET sequences exhibit stark changes in activity distribution as a function of time due to the inherent tracer kinetics. The resulting time-based activity variance renders motion correction in the early frames (<10 min), in particular, a challenge.
In light of the importance of removing motion artefacts from regional time-activity curves to allow the accurate quantification of physiological processes in the brain, several strategies have been implemented to minimise involuntary head motion. The most straightforward approach is to restrict the subject’s head motion using a mechanical restraint, such as a vacuum-lock bag [7] or moulded plastic mask [8]. However, given the confining nature of this method, it grows highly uncomfortable after a short time, increasing the likelihood of remedial head motion [9]. A better approach is to maximise patient comfort and accept small (<5 mm) head motion, which can be relatively easily corrected either by means of frame-by-frame post-processing realignment [10] or by hardware motion tracking systems using an external measurement device [11,12]. The hardware-based method performs event-by-event motion compensation on raw list-mode data and is considered to be more accurate than the image-based motion compensation techniques [13]. Likewise, data-driven approaches, as described by [14,15], try to extract motion vectors by the centroid of distribution from list-mode data. Although image-based methods might be conceptually inferior to hardware-based and data-driven methods, they are significantly more practical, are easily applicable to clinical studies and can be applied retrospectively as they do not require dedicated external online tracking devices that acquire motion information during the scan and are not manufacturer specific.
Given the practical advantages of image-based methods, a handful of methods have been proposed to measure accurate motion vectors from the rapidly changing activity distribution of the dynamic PET. Mukherjee et al. [16] suggested a method, similar to the one proposed here, consisting of a series of preprocessing steps followed by a multi-resolution pyramid filter framework. The investigators showed that image frames from PET acquisitions using F18-fluorodeoxyglucose (FDG) as short as 5s could be reliably aligned. However, the preprocessing steps were based on heuristics and were manually set. In prior work (Sundar et al., 2021), we employed conditional generative adversarial network (cGAN) methodology to automatically derive PET navigators, which in turn was used to derive an accurate motion vector from dynamic FDG-PET images. However, despite its excellent performance, this method was limited by the requirement of, first, a high-end workstation and, second, model retraining for application to dynamic PET brain studies involving other tracers. Therefore, it appears unlikely that such a complex methodology will find widespread adoption in the field due to the bottlenecks mentioned above. This is especially true in the clinical realm where patient motion is frequently encountered due to the limited cooperative ability of neurologically impaired patients. Thus, in order to achieve the best diagnostic performance in this target group, a clinically feasible motion compensation strategy needs to be implemented.
In recognition of the practical limitation of our previous and the work of other investigators, we present here a motion correction method that excels in providing a more practical, computationally robust and easily implementable method for brain image alignment by utilising a Gaussian scale space pyramid, and nonetheless delivers a similar performance to methods reported previously.
The process of progressive tracer distribution in the brain yields dynamically changing image patterns that may overlay similar effects from involuntary patient motion of the head. Accordingly, a criterion of image pattern similarity needs to be established that provides an objective measure of whether the information content in a particular frame is sufficient for alignment. An approach well suited to address the bespoke issues is the application of scale space image representation. Taking advantage of a multiscale signal representation, image structures are processed at different scales, thereby allowing the suppression of fine-scale details dependent on the chosen resolution level [17,18]. By embedding the images in a Gaussian scale space of coarse-to-fine resolution and hence removing image details, temporal activity differences in tracer uptake patterns are removed, resulting in increased image similarity, which leads to improved detection of motion artefacts. An early frame corresponding to 1.8 min post-injection will look very similar to 55 min post-injection when observed at a coarse scale (Figure 1, 2B). Moreover, starting at a coarse (low-resolution) level, alignment is performed at successive finer (high-resolution) levels, akin to the well-established concept of an image pyramid in computer vision applications [19]. This method has several advantages that facilitate a fast and robust alignment of images. First, the computational load is reduced significantly since most iterations are performed at the coarser levels of the pyramid. Secondly, the algorithm is less likely to get trapped in a local optimum because the initial search is performed on a coarse grid.
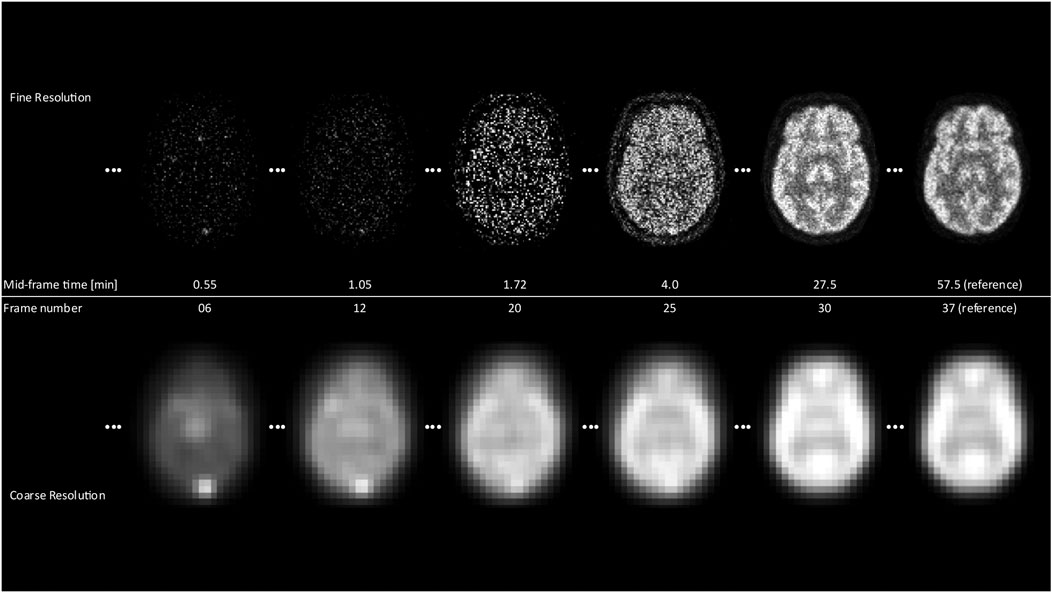
FIGURE 1. The differences between the coarsest and finest resolution for selected frames over the scan duration are displayed. It is clearly noticeable that for early frames, the fine resolution images yield almost no structural information in contrast to the coarse resolution, where contours of the brain and the general shape are already visible.
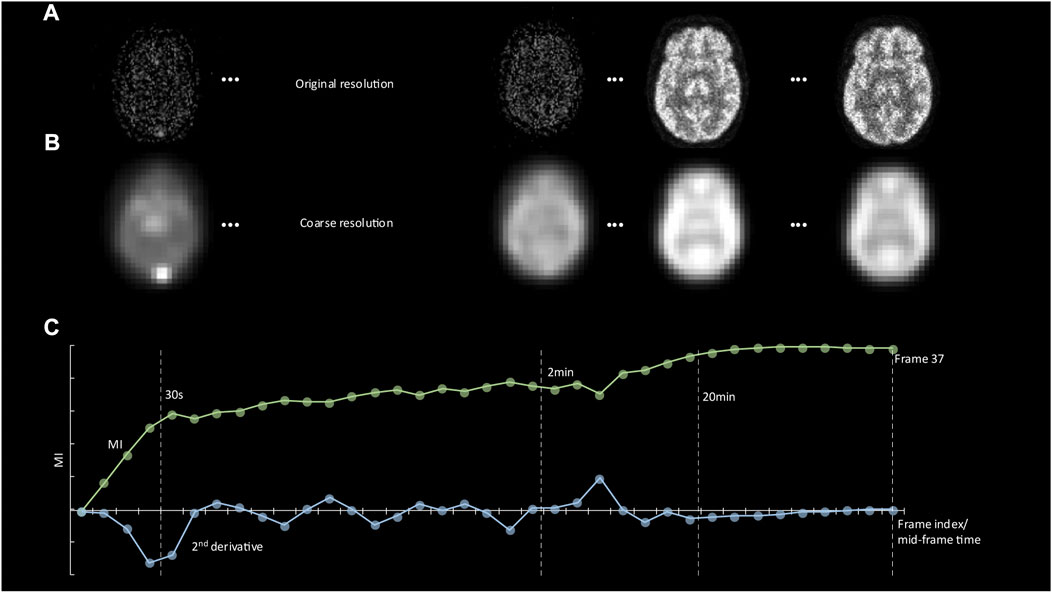
FIGURE 2. (A) Representative images showing tracer distribution of the digital phantom at 20 s, 2, 20, and 60 min p. i. (reference frame). (B) The same images are shown at the coarse resolution level together with automatically derived contours. (C) A plot of the Mutual Information (MI) score between the reference frame and all earlier frames as a function of frame number. The minimum value of the second derivative of the MI function defines the start of the plateau phase. This value was used as the starting point for motion correction of frames.
We implemented this multi-resolution approach, illustrated in Figure 3, using spline approximations of image frames at various scales (polynomial spline pyramid). We employed a coarse-to-fine updating strategy to compute the rigid alignment parameters (3D translation and rotation) iteratively, using a variation of the Levenberg-Marquardt non-linear least-squares optimisation method [20]. The optimal mapping from one image onto another at each resolution level was defined as the one that minimises the Euclidian norm of the difference between the two images. The transition to the following finer scale occurs once convergence has been reached at the current resolution level. The method then repeats the optimisation procedure until it finally reaches the finest resolution level. The advantage of this strategy is that most of the motion is recovered during extensive iterations at the coarser scale; all subsequent finer scale updates contribute only small adjustments to the final solution since the previous solution already provides a relatively close estimate. This scheme is displayed in Figure 3, with Figure 1 showing the difference in images at fines and coarse resolution.
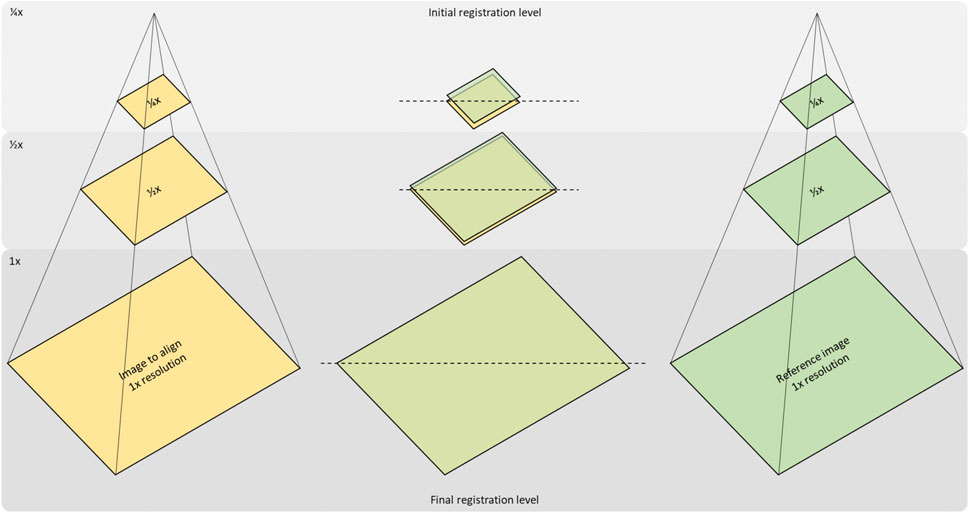
FIGURE 3. Concept of the multi-resolution-registration approach. Registration of an image to a reference image starts with the creation of a Gaussian pyramid for both images and resampling them to ¼ and ½ of their original resolution. The first registration will then be carried out at the coarsest (1/4 x) level and set up the initial state for the next level (1/2x). Likewise, the last registration step at full resolution is initialised by the result of the previous.
In order to maximise user flexibility when applying the developed motion correction software in both research and clinical applications, the developed software incorporates two distinct tasks: an initial processing step that calculates the mutual information (MI) across the whole dynamic frame sequence [21] with respect to a specified frame and resolution level, followed by a multi-resolution frame alignment step that results in the creation of a motion-corrected time-activity frame sequence (see Figure 4 for a schematic sketch of the functionality). Specifically, the software determines the starting frame from which motion correction can be performed based on MI between images at the lowest resolution as a pre-computational step. In our implementation, images are processed at three different resolution levels: coarse (1/4th resolution), medium (1/2nd resolution) and fine (original resolution). The user can select the number of iterations at each resolution level with values of 100/50/25 (coarse/medium/fine) iterations set as the default, which proved to be a solid choice upon testing during development to compromise speed and robustness. These default values yielded excellent alignment performance over a large range of studies during our testing phase. The average time to perform alignment of one frame is < 1s on a laptop computer with 8 GB of RAM.
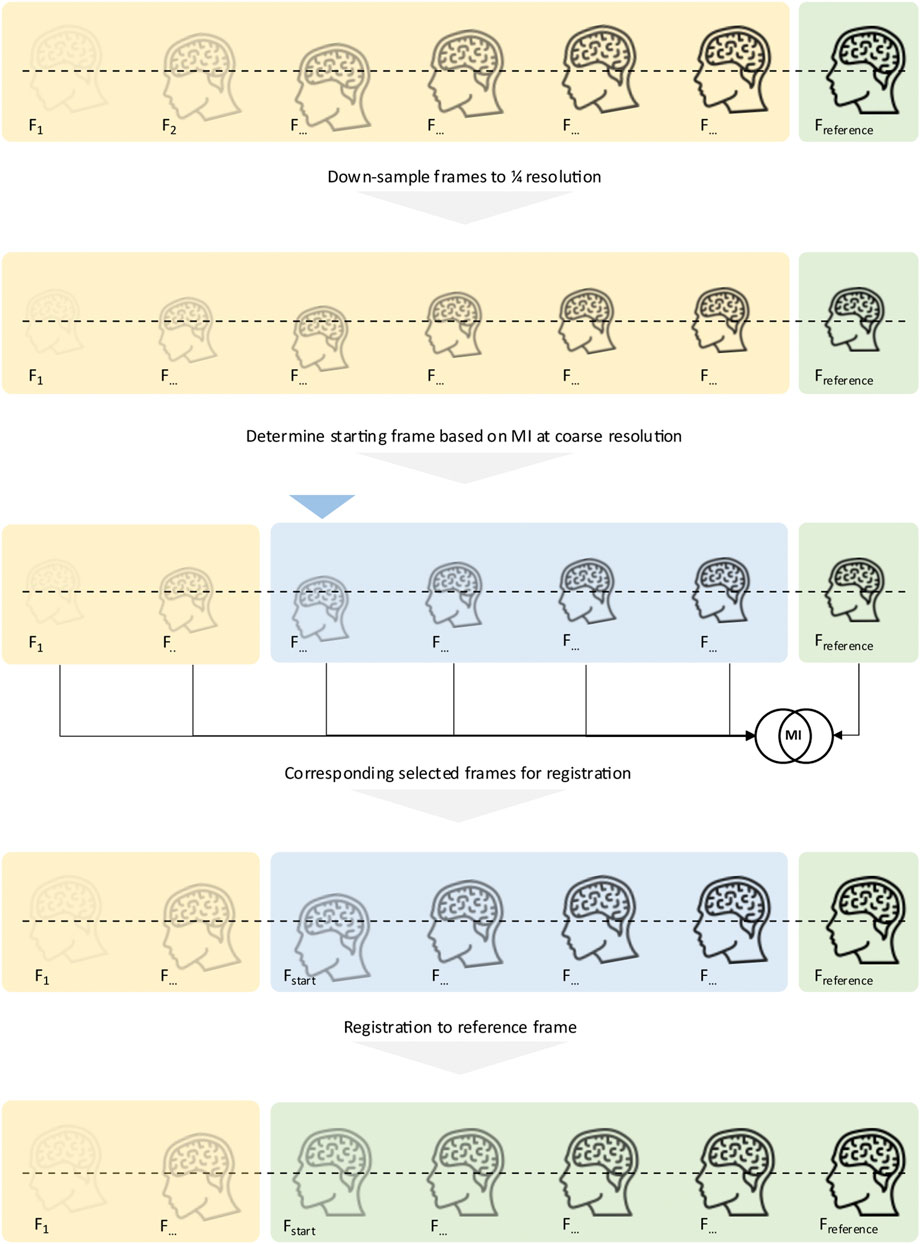
FIGURE 4. Concept of the proposed motion correction: Before registration starts, all frames are converted into their coarsest scale (1/4x) variant. To determine the starting frame, the MI between each frame and the reference frame is computed, and the coarse resolution level, as registration initially starts at that level. The MI determines which frame is selected as the starting frame. Once determined, the original images are then handed to the registration pipeline, starting with the just detected first frame to align. All frames, starting from the determined starting frame, are then registered to the last frame, the reference frame.
The software is built around Kitware’s Insight Segmentation and Registration Toolkit [22,23] and command line tools.
In order to accurately evaluate the performance of the developed motion correction method, the Zubal digital brain phantom [24] was used to simulate realistic tracer distribution patterns of a dynamic FDG brain study. The simulated dynamic sequence consisted of 37 frames (12 × 10s, 15 × 30s, 10 × 300s) for a total duration of 60min using a 344 × 344 × 127 image matrix with voxel size of 2.086 × 2.086 × 2.031 mm. Dynamic tracer uptake patterns were generated using a patient-derived input function and the two-tissue compartment model with preset realistic kinetic microparameters to estimate the time course of tracer concentration in 20 distinct brain regions of the Zubal phantom, similar to previous simulations [25]. These uptake patterns were then used to generate raw PET data with an analytical PET simulator [26], for which the characteristics of the Siemens mMR PET/MR system (Biograph mMR, Siemens Healthineers, Germany) were considered along with a realistic calibration factor (ECF), derived by comparison to real FDG clinical scans. The simulated raw data included the simulation of scatter and random events. Image reconstruction of the raw data was performed using the open source fully quantitative reconstruction platform CASToR [27], with the iterative OSEM algorithm run for six iterations with 21 subsets. Figure 1 and Figure 2A show representative reconstructed tracer distribution patterns during various phases of the dynamic sequence.
The developed motion correction method was applied to three different clinical dynamic tracer studies that included both F18-labeled fluorodeoxyglucose (FDG) and fluoroethyl-l-tyrosine (FET) and C11-labeled (alpha-methyl-tryptophan (AMT)) tracers. In addition to tracer variability, these datasets were also acquired from three different PET systems (Table 1). The AMT data included six studies to examine tryptophan metabolism in adult patients and was performed on a Discovery STE PET/CT system (General Electric Healthcare, United States). The study consisted of a 7 × 5 min dynamic frame sequence initiated at 25 min p. i. All images were reconstructed using a standard OSEM reconstruction routine, yielding image frames with 128 × 128 × 47 matrix size and a voxel size of 2.0 × 2.0 × 3.27 mm. The FET study was acquired by a Biograph mMR system (Siemens Healthineers, Germany) and reconstructed into eight frames for a scan time of 40 min (2 × 2, 4 × 4, 2 × 10 min) with a standard OP-OSEM reconstruction with a size of 172 × 172 × 127 and spacing of 2.086 × 2.086 × 2.031 mm each. Lastly, the FDG images were also acquired using a Biograph mMR system (Siemens Healthineers) and reconstructed into 37 frames (24 × 5 s, 1 × 1 min, 1 × 2 min, 11 × 5 min). The size and spacing of each frame are 344 × 344 × 127 voxels and 2.086 × 2.086 × 2.031 mm, respectively. FDG scans obtained using a Philips Ingenuity TF PET/CT were reconstructed into 21 frames with a volume size of 128 × 128 × 90 and pixel spacing of 2 × 2 × 2 mm using BLOB-OS-TF reconstruction.
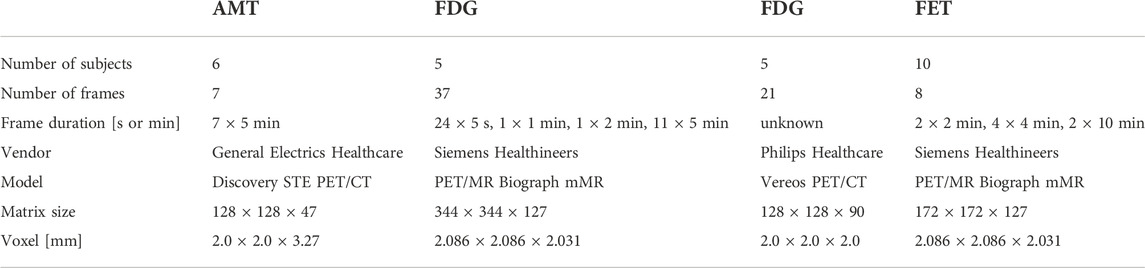
TABLE 1. The details of all four clinical datasets are listed to provide an overview of important information, such as the system and frame durations. It also summarises the variety of data by using three different tracers and four different devices with which the data was captured.
The performance of our software was assessed based on both the digital phantom and the clinical image data. First, 20 random motion vectors, including both translation (0mm–15 mm) and rotation (0rad–0.3rad), were added to each frame (except the last reference frame, considered as the reference for motion correction) of the generated dynamic sequences (digital phantom), resulting in 20 dynamic frame sequences with 36 frames that included motion. Frames with sufficient information for accurate alignment were determined based on the beginning of the plateau phase of the MI measure across frames. Specifically, in order to increase similarity across the dynamic frame sequence, all images were initially converted to a coarse resolution level (Figure 1), and the MI between the last frame and all preceding frames was calculated at this level (Figure 2B). The minimum value of the second derivative of the MI function was then used to determine the start of the plateau phase (Figure 2C). Subsequently, frame alignment was only performed for frames in the MI plateau phase. This feature was therefore used to identify the starting frame of the motion correction process, as illustrated in Figure 4.
To obtain a measure of spatial displacement associated with a particular motion vector, we used a location of ∼6 cm away from the centre of rotation (brain centre) as a representative average point within the brain that is displaced by motion. Application of a motion vector to such a point will displace this point by a certain distance, allowing the assessment of the amount of displacement that can be recovered using the developed motion correction software. The same translation and rotation values retrieved from the motion correction were applied, and the new, displaced point coordinates were retrieved. The displacement distance as a function of the coordinates of the reference point and coordinates of the displaced point was calculated as
and only motion parameter combinations that did not exceed a total displacement of 25 mm were accepted to be imposed on the dynamic frames to remove outliers that would have imposed unrealistic head motion. Due to the selection of a point around 6 cm off the brain centre, the selected metric (Eq. 1) considers all six motion parameters (translation and rotation). The accuracy of the motion correction method was assessed based on the amount of residual displacement distance (i.e. the displacement error) that was not recovered by the algorithm as a function of the known superimposed displacement distance.
To assess the accuracy of the developed method in a clinical context where the actual displacement distance is unknown, motion correction parameters were determined for all frames in the FDG, FET and AMT studies, and the Dice Score Coefficient (DSC) across all frames was compared before and after motion correction. To compute the DSC, total-head masks of all frames in each study were retrieved with 3D Slicer [28]. Motion correction parameters from our software were applied to the corresponding labels. The improvement in DSC for each individual frame was then correlated with the displacement distance calculated from the identified motion vector. A significant correlation between these measures would indicate that the applied motion correction resulted in an increased spatial agreement between image frames, consistent with removing motion artefacts. In addition to the DSC and displacement evaluation, summed images were inspected by a medical doctor specialised in nuclear medicine to ensure valid clinical quality after applied motion correction.
All values were expressed as mean ± SD. Significance in the correlation between variables was assessed using Person’s rho. Significance was set to p < 0.05.
Figure 5 shows the mean and standard deviation of the imposed displacement across the frame sequence (blue graph), which was derived from all 100 simulated dynamic curves. The graph indicates a displacement across the dynamic sequence between 10mm and 25 mm (16 ± 5 mm, rho = 0.10, p = NS) as a result of the imposed motion. Following the proposed motion correction method, a residual misalignment of 0.4 ± 0.2 mm was found for all frames after 5 min p. i. (Figure 5, green graph). Of note, early frames (30–180 s) displayed a residual displacement of ∼3 mm (3.2 ± 0.6 mm), as indicated by the dotted lines, marking the 5, 2 and 1 mm displacement range.
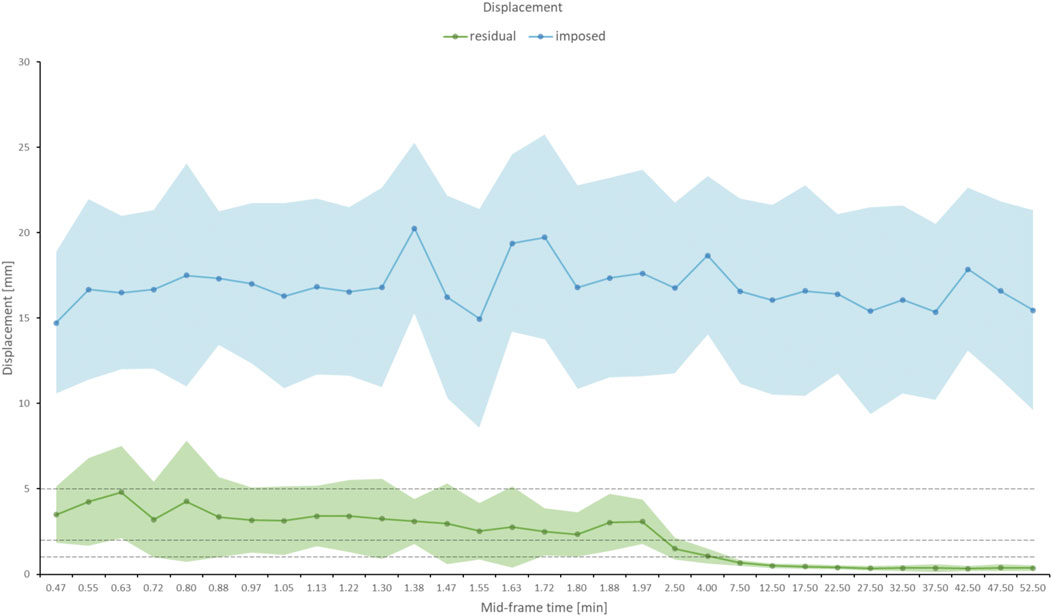
FIGURE 5. The blue graph displays the average of imposed displacement across all iterations that was added to each frame of the digital phantom as a function of the mid-frame time, together with the error band (standard deviation) in light blue. The imposed displacement was consistent across the dynamic frame sequence. The residual (uncorrected) displacement following the application of the motion correction as a function of mid-frame time is shown in the green graph. The error band is given in light green. To indicate the performance of the motion correction, dotted lines are drawn at 5, 2, and 1 mm displacement. After 2.5 min, the residual error reaches in average sub-voxel (<2 mm) level.
Figure 6A demonstrates increased MI scores at the coarse (visually observable in Figure 1) resolution level, with the MI scores approaching the plateau phase at an earlier time than those at the medium and fine resolution levels. Specifically, the MI plateau phase at the coarse level was reached at 35s p. i (Figure 2C), whereas it was reached at 2.0 and 2.5 min p. i. At the medium and fine resolution levels, respectively (Figure 6B).
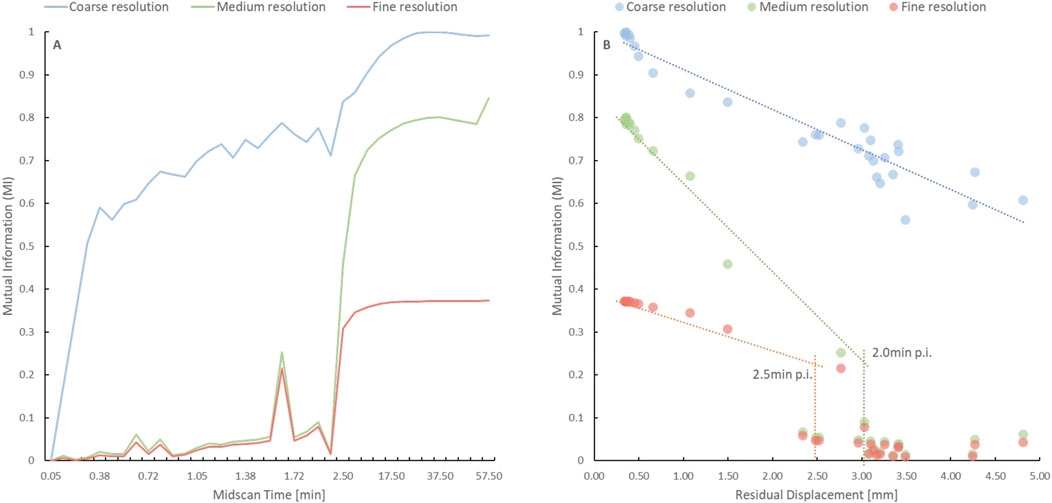
FIGURE 6. (A) Time course of the Mutual Information (MI) score at the coarse (blue), medium (green) and fine (red) resolution levels for the digital phantom without imposed motion. The MI score was higher, and the plateau phase was reached earlier at the coarse resolution level when compared to the other resolution levels. (B) The graph depicts the time points when the plateau phase is reached at the medium (green) and fine (red) resolution levels based on the discontinuity in MI score as a function of residual displacement. The lack of a fall-off for the coarse resolution (blue) indicates that an alignment is possible at earlier frames for the coarse resolution.
Motion correction performance of clinically obtained dynamic sequences was assessed based on both visual assessment of summed images by a nuclear medicine physician as well as based on improvement in DSC scores across frames. Figure 7 shows a comparison between representative summed PET frames before and after motion correction. One can appreciate the improvement in image sharpness of the summed images following motion correction of FET (20–40 min p. i), FDG (20–50 min p. i) and AMT (25–60 min p. i) PET images together with the line profiles in Figure 7. The line profiles show the intensities (Magnitude, on the y-axis of Figure 7) of the summed images along the path (x, on the x-axis of Figure 7) of the line profile. Figure 8 shows the relationship between the identified (and corrected) displacement and the improvement in DSC score for all dynamic studies. A significant correlation was determined for all three tracer studies (FET: R = 0.49, p < 0.001; FDG: R = 0.82, p < 0.001; AMT: R = 0.92, p < 0.001). The average time for performing motion correction on all frames in a single dynamic study was <1 min.
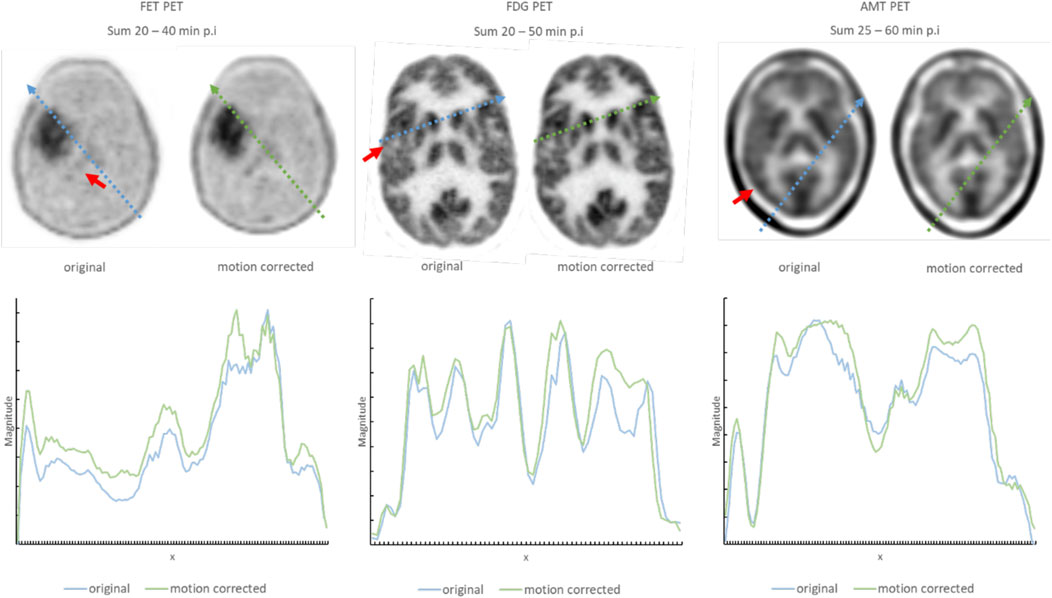
FIGURE 7. Representative summed images of three patient studies showing the improvement in image quality following the application of the proposed motion correction. Regions, where the impact of corrected motion is especially noticeable are indicated with a red arrow. Examples using three different tracers are used to demonstrate that the approach is insensitive to image characteristics of the underlying tracer distribution. The line profiles, together with the path from where they were retrieved within the image, are displayed below and marked in the axial slices of the brain. The arbitrary values on the x-axis are the locations of the interpolated graph along the line profile inside the axial slice. The magnitude on the y-axis indicates the intensity at location x along the line profile. A higher magnitude after the summation of the images indicates a proper alignment of the frames, as areas with high intensities and areas with low intensities are aligned and contribute accordingly.
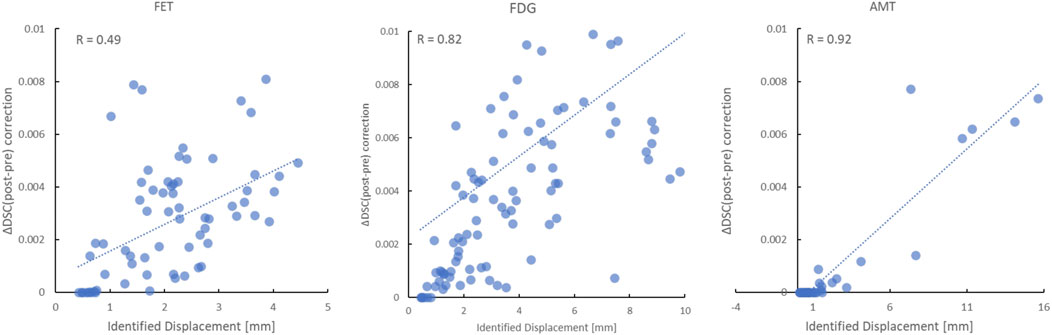
FIGURE 8. Relationship between the identified displacement and the improvement in the absolute dice score coefficient (DSC) following motion correction of all frames in the FET (left), FDG (middle) and AMT (right) PET studies. A highly significant correlation (p < 0.001) was determined for all three tracers.
Our study investigated the accuracy of a computationally inexpensive, fast and robust motion correction algorithm that was designed to perform accurate post-acquisition alignment of dynamic brain PET images. Our proposed method is fully-automatic, tracer- and system-independent. Results indicate that the developed algorithm can be easily implemented in a clinical setting and yields sub-voxel accuracy in compensating for involuntary head motion over a large range of PET tracer distribution patterns. Specifically, the method allows alignment of brain PET images with an accuracy of ∼0.5 mm (Figure 5) that have been acquired as early as 5 min p. i., while providing still excellent alignment of brain images even at 1 min p. i. with an accuracy of about one voxel (∼3 mm).
The relatively large displacement and, therefore, worse correction performance during the initial part of a dynamic study is due to the problem of changing tracer uptake patterns reflecting physiological processes in brain tissue. In general, the tracer is initially confined to the vascular compartment by the blood-brain barrier, followed by gradual tracer uptake into the brain tissue and washout from the vascular compartment. The time course of the changing tracer distribution is specific for each tracer, although for most tracers, the greatest uptake in grey matter tends to occur at late time points. Because grey matter tracer uptake is usually of interest, the last frame of a dynamic sequence is commonly selected as the reference for alignment of all previous time frames. However, accurate alignment of the reference frame with early frames is challenging due to the vastly different uptake patterns as well as poor count statistics typical of early frames. Accordingly, a criterion of uptake pattern similarity needs to be established that provides an objective measure of whether the information content in a particular frame is sufficient for alignment. We used the MI score across the dynamic sequence against the reference frame as an indicator of the time point when an accurate alignment of image frames might be possible. Moreover, to increase the similarity between tracer distribution patterns, the MI score was applied at a low (coarse) resolution level. Our results using a simulated FDG tracer uptake time sequence showed that at a coarse level, the similarity between brain images can be achieved within the first minute following tracer injection. However, at higher resolution levels, the sufficient similarity between frames cannot be achieved prior to about 3min p. i. As a result, the developed motion correction method performs very well for frames acquired after the initial 5 min of FDG brain uptake but shows less accuracy (2–4 mm) in the early frames. Thus, alternative methods need to be employed if an accurate alignment of very early frames is required.
We based our method on the scale-space representation of image data, which decomposes images into information at multiple scales, each of which emphasises a particular fineness of detail or scale (Lindberg, 1994 [29]). Using iterative Gaussian blurring, this process successively attenuates high-frequency components (i.e. suppresses fine-scale details) in the images that are associated with either noise or with subtle dynamic changes in tracer distribution as a consequence of physiological processes. As illustrated in Figure 2B, MI which characterises overall brain shape, becomes dominant at low-resolution levels, allowing robust detection of large motion artefacts apart from moderate changes in tracer distribution. The so-obtained motion vector estimate is subsequently refined at each higher resolution level, as displayed in Figure 6, preventing the algorithm from being trapped in a local minimum.
There is a close link between scale-space theory and convolutional neural networks (CNNs). Both methods use filters and convolution to extract features from images at different resolution scales in order to detect underlying features automatically. In short, Gaussian scale space can be considered as a subset of the filter space used in CNNs. Furthermore, encoding the scale information explicitly into the representation learned by a CNN is beneficial for many computer vision tasks, especially when dealing with multiscale inputs, as it is possible to obtain scale covariance/equivariance and scale invariance of the deep network to handle image structures at different scales in a theoretically well-founded manner ([30,31]). Such hybrid approaches between scale-space theory and deep learning enable deep networks to operate robustly at scales not spanned by the training data, thus enabling scale generalisation [32].
Direct assessment of the achieved accuracy of the developed alignment technique was done using a digital phantom where the imposed motion vector was precisely known. As seen in Figure 5, the amount of displacement imposed was in the range of 10–20 mm, which was slightly higher than that encountered in our clinical studies [33] but used to impose highly noticeable motion (Figure 8). The residual displacement was found to be less than 1 mm for all frames acquired after 5 min p. i. (Figure 5), with the alignment accuracy of early (0.5–3 min) frames being in the range of 1–5 mm. This relatively poor performance in early frames is the consequence of the greatly different tracer uptake pattern in these frames, precluding accurate alignment of images at high-resolution levels. Nevertheless, as clinical images are usually acquired after the tracer has reached dynamic equilibrium in brain tissue (∼25 p. i. for the FDG tracer), this result suggests that the developed methodology might benefit sites that use a sequence of dynamic frames with a short (1, 2 min) scan time which are subsequently summed in order to remove motion artefacts in studies of challenging patient groups (e.g. pediatric or mentally impaired patients).
The clinical viability of the developed method was evaluated based on the alignment of dynamic image sequences with vastly different tracer uptake patterns. Figure 7 shows representative summed images of three different tracer distribution patterns comparing the effects of image blurring before and after applying the developed motion correction technique. Although differences are relatively subtle, a closer inspection of the images demonstrates improvement in both image sharpness and contrast following alignment, independent of the noise characteristics of images acquired using 18F- or 11C-labeled tracers (Figure 7). Visual assessment of images was confirmed by the improvement in DSC as a result of alignment, which significantly correlated with the identified (and corrected) displacement (Figure 8). Moreover, the relationship between DSC improvement and identified displacement was fairly insensitive to the tracer distribution pattern, further supporting the notion that the alignment method is highly robust and, therefore, well suited for routine applications. The verified robustness of our method is highly relevant for clinical applications, as one single application can be used for different tracers and for vastly varying frame sequences. Especially in pediatric scans which frequently suffer from substantial motion artefacts the presented approach is likely to result in improved diagnostic performance.
There are several limitations that had to be accepted in the current implementation. First, we employed a static attenuation map that is not motion-corrected. Although conceptually more accurate, extending motion correction to the attenuation map is laborious. It was shown before that in the case of relatively low-level motion (<5 mm), the application of a static attenuation map provides reasonably accurate estimates of local tracer concentration [34].
Further, intra-frame motion is not addressed in this work. Nonetheless, our results derived from real-world dynamic studies indicated that even if intra-frame motion is not considered, correction of inter-frame motion can contribute significantly to the quality of both summed images as well as to the quality of extracted dynamic curves.
Moreover, our methodology does not allow correction for motion at the very beginning of a dynamic sequence (less than 30s p. i.) when the tracer distribution pattern differs substantially from that of the reference image. Our validation studies suggest that the tracer distribution patterns in image frames acquired during the initial 60s are significantly different from that of the reference image (even at the lowest resolution scale), precluding the successful application of our method in these very early frames. Although these frames are not important from a clinical point of view, these frames carry information with respect to the blood input function, which is often of interest in order to obtain an image-derived input function for kinetic modelling [33] and quantification. Consequently, motion correction of these early frames will require a separate alignment method.
Finally, although we demonstrated a substantial improvement in DSC as a result of alignment using the proposed method in a relatively small sample of FDG, FET and AMT images, the ultimate clinical value of our methodology needs to be verified in a much larger patient population.
The proposed motion correction software provides a reasonable alternative to more sophisticated motion correction approaches of PET images that require either external online tracking devices in combination with list-mode data acquisition or additional MR data together with high-end computing equipment. Due to its simplicity and ease of implementation, we envision that our method will be embraced by clinically oriented sites in the field of Nuclear medicine.[35].
All codes related to the described software are available online. All models for our application are publicly available, and a complete description of the processing pipeline is available on our GitHub page (https://github.com/QIMP-Team/FALCON).
All data utilised in this study were acquired in accordance with the Declaration of Helsinki. Written information consent was obtained from all the subjects prior to examinations.
All authors listed have made a substantial, direct, and intellectual contribution to the work and approved it for publication.
This project has received funding from the European Union’s Horizon 2020 research and innovation programme under the Marie Skłodowska-Curie grant agreement No. 764458. This project has received funding from the Austrian Science Fund (FWF): I 5902-B. The first author works under a research agreement between Siemens Healthineers and the Medical University Vienna.
Author SZ was employed by Siemens Medical Solutions USA, Inc. Author HN was employed by Siemens Healthineers.
The remaining authors declare that the research was conducted in the absence of any commercial or financial relationships that could be construed as a potential conflict of interest.
All claims expressed in this article are solely those of the authors and do not necessarily represent those of their affiliated organizations, or those of the publisher, the editors and the reviewers. Any product that may be evaluated in this article, or claim that may be made by its manufacturer, is not guaranteed or endorsed by the publisher.
1. Duclos V, Iep A, Gomez L, Goldfarb L, Besson FL. PET molecular imaging: A holistic review of current practice and emerging perspectives for diagnosis, therapeutic evaluation and prognosis in clinical oncology. Int J Mol Sci (2021) 22(8):4159.
2. Huang SY, Hsu JL, Lin KJ, Hsiao IT. A novel individual metabolic brain network for 18F-FDG PET imaging. Front Neurosci (2020) 14:344.
3. Vandenberghe S, Moskal P, Karp JS. State of the art in total body PET. EJNMMI Phys (2020) 7(1):35. doi:10.1186/s40658-020-00290-2
4. Slart RHJA, Tsoumpas C, Glaudemans AWJM, Noordzij W, Willemsen ATM, Borra RJH, et al. Long axial field of view PET scanners: A road map to implementation and new possibilities. Eur J Nucl Med Mol Imaging (2021) 48:4236–45. doi:10.1007/s00259-021-05461-6
5. Chen Z, Wu Y, Zhang N, Sun T, Shen Y, Zheng H, et al. High temporal resolution total-body dynamic PET imaging based on pixel-level time-activity curve correction. IEEE Trans Biomed Eng. 1. doi:10.1109/tbme.2022.31760972022, May 20; PP
6. Schleyer PJ, Dunn JT, Reeves S, Brownings S, Marsden PK, Thielemans K. Detecting and estimating head motion in brain PET acquisitions using raw time-of-flight PET data. Phys Med Biol (2015) 60(16):6441–58. doi:10.1088/0031-9155/60/16/6441
7. Beyer T, Tellmann L, Nickel I, Pietrzyk U. On the use of positioning aids to reduce misregistration in the head and neck in whole-body PET/CT studies. J Nucl Med (2005) 46:596–602.
8. Green MV, Seidel J, Stein SD, Tedder TE, Kempner KM, Kertzman C, et al. Head movement in normal subjects during simulated PET brain imaging with and without head restraint. J Nucl Med (1994) 35:1538–46.
9. Ruttimann UE, Andreason PJ, Rio D. Head motion during positron emission tomography: Is it significant?. Psychiatry Res Neuroimaging (1995) 61:43–51. doi:10.1016/0925-4927(95)02565-f
10. Mourik JE, Lubberink M, van Velden FH, Lammertsma AA, Boe- llaard R. Off-line motion correction methods for multi-frame PET data. Eur J Nucl Med Mol Imaging (2009) 36:2002–13. doi:10.1007/s00259-009-1193-y
11. Bloomfield PM, Spinks TJ, Reed J, Schnorr L, Westrip AM, Livieratos L, et al. The design and implementation of a motion correction scheme for neurological PET. Phys Med Biol (2003) 48:959–78. doi:10.1088/0031-9155/48/8/301
12. Goldstein SR, Daube-Witherspoon ME, Green MV, Eidsath A. A head motion measurement system suitable for emission computed tomography. IEEE Trans Med Imaging (1997) 16:17–27. doi:10.1109/42.552052
13. Jin X, Mulnix T, Planeta-Wilson B, Gallezot JD, Carson RE. Accuracy of head motion compensation for the HRRT: Comparison of method. Orlando, FL, USA: IEEE Nucl Sci Conf Rec (1997).
14. Hong I, Burbar Z, Schleyer P. A method to estimate motion frames from PET listmode by merging adjacent clusters. 2019 IEEE Nuclear Science Symposium and Medical Imaging Conference (NSS/MIC). 09 April 2020. Manchester, UK (2019). p. 1–2. doi:10.1109/NSS/MIC42101.2019.9059870
15. Lu Y, Naganawa M, Toyonaga T, Gallezot JD, Fontaine K, Ren S, et al. Data-driven motion detection and event-by-event correction for brain PET: Comparison with vicra. J Nucl Med (2020) 61(9):1397–403. doi:10.2967/jnumed.119.235515
16. Mukherjee JM, Lindsay C, Mukherjee A, Olivier P, Shao L, King MA, et al. Improved frame-based estimation of head motion in PET brain imaging. Med Phys (2016) 43(5):2443–54. doi:10.1118/1.4946814
17. Lindeberg T. Scale-space theory: A basic tool for analyzing structures at different scales. J Appl Stat (1994) 21(1-2):225–70. doi:10.1080/757582976
18. Witkin AP. Scale-space filtering. Proc 8th Int Jt Conf. Art. Intell., Karlsruhe, Germany (1983).1019–1022.
19. Adelson EH, Anderson CH, Bergen JR, Burt PJ, Ogden JM. Pyramid methods in image processing. RCA Engineer, 29-6, 1984.
20. Unser M, Aldroubi A. A multi-resolution image registration procedure using spline pyramids. Proc. Of SPIE vol. 2034, Wavelet applications in signal and image processing, ed. Laine AF (1993).
21. Studholme C, Hill DL, Hawkes DJ. Automated three-dimensional registration of magnetic resonance and positron emission tomography brain images by multiresolution optimization of voxel similarity measures. Med Phys (1997) 24:25–35. doi:10.1118/1.598130
22. McCormick M, Liu X, Jomier J, Marion C, Ibanez L. Itk: Enabling reproducible research and open science. Front Neuroinform (2014) 8(13):13. doi:10.3389/fninf.2014.00013
23. Yoo TS, Ackerman MJ, Lorensen WE, Schroeder W, Chalana V, Aylward S, et al. Engineering and algorithm design for an image processing api: A technical report on itk – the Insight Toolkit. In: Westwood J, editor. Proc. Of medicine meets virtual reality. IOS Press Amsterdam (2002). p. 586–92.
24. Zubal IG, Harrell CR, Smith EO, Rattner Z, Gindi G, Hoffer PB. Computerized three-dimensional segmented human anatomy. Med Phys (1994) 21(2):299–302. doi:10.1118/1.597290
25. Chalampalakis Z, Stute S, Filipović M, Sureau F, Comtat C. Use of dynamic reconstruction for parametric Patlak imaging in dynamic whole body PET. Phys Med Biol (2021) 66:185017. doi:10.1088/1361-6560/ac2128
26. Stute S, Tauber C, Leroy C, Bottlaender M, Brulon V, Comtat C. Analytical simulations of dynamic PET scans with realistic count rates properties. 2015 IEEE Nuclear Science Symposium and Medical Imaging Conference (NSS/MIC). 06 October 2016. San Diego, CA, USA: IEEE (2015). p. 1–3.
27. Merlin T, Stute S, Benoit D, Bert J, Carlier T, Comtat C, et al. CASToR: A generic data organization and processing code framework for multi-modal and multi-dimensional tomographic reconstruction. Phys Med Biol. (2018) 63(18):185005. doi:10.1088/1361-6560/aadac1
28. Fedorov A, Beichel R, Kalpathy-Cramer J, Finet J, Fillion-Robin J-C, Pujol S, et al. 3D slicer as an image computing platform for the quantitative imaging network. Magn Reson Imaging (2012) 30(9):1323–41. doi:10.1016/j.mri.2012.05.001
30. Lindeberg T. Provably scale-covariant continuous hierarchical networks based on scale-normalized differential expressions coupled in cascade. J Math Imaging Vis (2020) 62:120–48. doi:10.1007/s10851-019-00915-x
31. Lindeberg T. Scale-covariant and scale-invariant Gaussian derivative networks. J Math Imaging Vis (2022) 64:223–42. doi:10.1007/s10851-021-01057-9
32. Jansson Y, Lindeberg T. Exploring the ability of CNNs to generalise to previously unseen scales over wide scale ranges. In: International conference on pattern recognition ICPR 2020 (2021). p. 1181–8.
33. Sundar S, Kumar L, Muzik O, Rischka L, Hahn A, Rausch I, et al. Towards quantitative [18F]FDG-PET/MRI of the brain: Automated MR-driven calculation of an image-derived input function for the non-invasive determination of cerebral glucose metabolic rates. J Cereb Blood Flow Metab (2018) 39:1516–30. doi:10.1177/0271678X18776820
34. Jin X, Mulnix T, Gallezot JD, Carson RE. Evaluation of motion correction methods in human brain PET imaging-a simulation study based on human motion data. Med Phys (2013) 40(10):102503. doi:10.1118/1.4819820
Keywords: brain motion correction, scale-space, dynamic PET imaging, frame-based algorithm, gaussian pyramid algorithms
Citation: Gutschmayer S, Muzik O, Chalampalakis Z, Ferrara D, Yu J, Kluge K, Rausch I, Boellaard R, Golla SSV, Zuehlsdorff S, Newiger H, Beyer T and Kumar Shiyam Sundar L (2022) A scale space theory based motion correction approach for dynamic PET brain imaging studies. Front. Phys. 10:1034783. doi: 10.3389/fphy.2022.1034783
Received: 02 September 2022; Accepted: 11 October 2022;
Published: 28 October 2022.
Edited by:
Guang Yang, Imperial College London, United KingdomReviewed by:
Jens Gempt, Technical University of Munich, GermanyCopyright © 2022 Gutschmayer, Muzik, Chalampalakis, Ferrara, Yu, Kluge, Rausch, Boellaard, Golla, Zuehlsdorff, Newiger, Beyer and Kumar Shiyam Sundar. This is an open-access article distributed under the terms of the Creative Commons Attribution License (CC BY). The use, distribution or reproduction in other forums is permitted, provided the original author(s) and the copyright owner(s) are credited and that the original publication in this journal is cited, in accordance with accepted academic practice. No use, distribution or reproduction is permitted which does not comply with these terms.
*Correspondence: Otto Muzik, YWEwMDA0QHdheW5lLmVkdQ==
Disclaimer: All claims expressed in this article are solely those of the authors and do not necessarily represent those of their affiliated organizations, or those of the publisher, the editors and the reviewers. Any product that may be evaluated in this article or claim that may be made by its manufacturer is not guaranteed or endorsed by the publisher.
Research integrity at Frontiers
Learn more about the work of our research integrity team to safeguard the quality of each article we publish.