 Jeffery L. Tallon
 James G. Storey
- Robinson Research Institute, Victoria University of Wellington, Lower Hutt, New Zealand
The key thermodynamic characteristics of the pseudogap state in cuprate superconductors are reviewed. These include YBa2Cu3O7−δ, Y0.8Ca0.2Ba2Cu3O7−δ, YBa2Cu4O8, Bi2Sr2CaCu2O8+δ, La2−xSrxCuO4, and Tl2Ba2CuO4. The electronic specific heat was extracted using a differential technique, and the evolution of the specific-heat coefficient γ and electronic entropy S as a function of temperature, doping, and magnetic field reveals a canonical behavior summarized by the following. The normal-state gap which opens in the pseudogap domain apparently remains open to the highest temperatures investigated. The gap decreases in magnitude with increasing doping and closes abruptly at a critical doping of p ≈ 0.19 holes/Cu, independent of temperature. In this picture, the pseudogap is separated from the pseudogap-free region of the phase diagram by a vertical line similar to the vertical line separating the incoherent and coherent antinodal quasiparticle states found in ARPES. The important role of fluctuations is evident by a diverging enhancement of γ(T) on either side of Tc, and this enables extraction of the mean-field transition temperature
1 Introduction
The idea of a pseudogap in cuprates was suggested quite early by Friedel [1] to describe the suppression of susceptibility across the under-doped regime. However, the underlying physics of the pseudogap, observed in all hole-doped cuprates, still remains unresolved despite more than a quarter of a century of detailed study. More concerning still, there is still no agreement on the precise phase extent and phenomenology of the pseudogap [2]. What perhaps is agreed is that it represents a partial gap in the electronic density of states (DOS) which is asymmetric about EF as evidenced by its dramatic effect on the thermoelectric power in under-doped cuprates [3]. Once, it was also generally agreed to be associated with the under-doped side of the phase diagram but now, researchers often describe a T*(p) line as a line which extends across the entire superconducting phase diagram, falling to zero as Tc → 0 at the end of the superconducting dome [4]. It also seems to be associated with a reconstruction of the Fermi surface (FS) from a large hole-like FS on the over-doped side to disconnected hole pockets on the under-doped side [3, 5, 6] though there remain significant questions in this interpretation especially for Tl2Ba2CuO6 [7].
The electronic specific heat between 0 and 300 K probes the full spectrum of low-lying quasiparticle excitations over a Fermi window extending up to 100 meV and thus encompasses both the superconducting gap and the pseudogap. It is therefore an excellent probe of the pseudogap, its phase extent and its relation, or otherwise, to superconductivity. That is, provided it can be measured. Unfortunately, the total specific heat also includes a phonon contribution which, at temperatures of Tc and above, is up to 100 fold larger than the electronic specific heat. However, the extensive differential measurements and analysis of the late John Loram have enabled this separation of electronic and phonon terms [8], and it is these which we discuss here.
The technique is discussed elsewhere [9] but in short, the specific heat of the sample is measured relative to a reference sample which ideally is similar in structure and total number of atoms. In all the following work discussed, the reference samples were the same material as the samples but Zn substituted in order to suppress superconductivity. Thus, for example, YBa2Cu3O7−δ is measured relative to YBa2Cu3−yZnyO7−δ with y = 0.21. In this way, the differential technique backs off most of the phonon contribution to the total specific heat and the residual phonon term is found to scale with the changing oxygen content, δ, thus allowing the bare electronic term to be directly extracted. The systems measured include YBa2Cu3O7−δ, Y0.8Ca0.2Ba2Cu3O7−δ, YBa2Cu4O8, Bi2Sr2CaCu2O8+δ, La2−xSrxCuO4, and Tl2Ba2CuO4. A key result is the observation of entropy suppression, precisely mirroring the susceptibility suppression [1], that shows the pseudogap to be a gap in the quasiparticle spectrum and not just the spin spectrum [10, 11].
2 Doping dependence of specific heat and entropy
2.1 YBa2Cu3O7−δ and YBa2Cu4O8
The simplest and most ideal systems to study are YBa2Cu3O7−δ (Y123) [8] and YBa2Cu4O8 (Y124) [12], the first because it can be doped over a wide range in very small increments and the second because it is perhaps the most defect-free structure amongst the cuprates. Figure 1 shows the temperature dependence of (a) the electronic specific heat coefficient, γ ≡ CP/T, and (b) the electronic entropy,
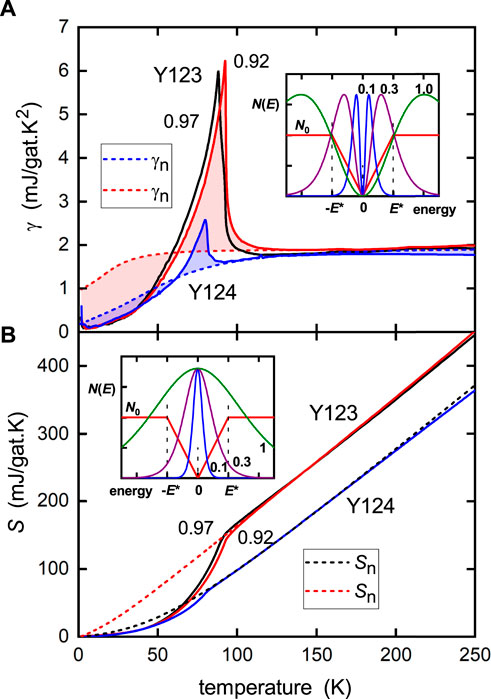
FIGURE 1. Electronic thermodynamic functions (A) γ(T) and (B) S(T) for YBa2Cu3O7−δ and YBa2Cu4O8 showing the canonical parallel downward shift in S(T) due to the pseudogap, while γ(T) returns to the same value at high T. The shaded regions in (A) between the observed γ(T) and γn(T) illustrate the equal-area entropy-balance rule, as discussed the text. The inserts in each panel show the Fermi windows for each function overlaid on a gapped density of states N(E). The blue, purple, and olive-green curves show the Fermi windows for temperatures kBT = 0.1E*, 0.3E*, and 1.0E*, respectively. For S(T), the window has a single peak and always sees a gap at EF, so the entropy is always suppressed while the gap remains. In contrast, for γ(T), the Fermi window is double peaked about EF and so, at high enough temperature, the window does not see the gap and γ(T) returns to its bare value.
(i) Fully oxygenated Y123 exhibits a large jump in γ at Tc while, in Y124, the jump is strongly suppressed. This shows that compared with Y123, the density of pairs in the Y124 condensate is strongly diminished by the removal of the antinodal states by the pseudogap.
(ii) It is possible to infer the normal-state behavior in the absence of superconductivity using the method of entropy balance, or equal-area construction. Thus, in Figure 1A, the red dashed curve is the normal-state specific-heat coefficient, γn(T), corresponding to the solid red curve. The pink-shaded area between the two curves must be the same above and below the crossing point. There is some latitude in the construction, but it is quite constrained as it must be continuous with the measured behavior above Tc. For the fully oxygenated sample, γn(T) is constant, reflecting a fairly flat DOS in the neighborhood of EF. This reveals that there is no pseudogap present in fully oxygenated Y123, but a small gap has already opened at oxygen 6.92 (red dashed curve) as reflected by the low-temperature downturn. Now, when we turn to Y124, the same construction (blue shading) shows γn(T) (blue dashed curve) to be rather strongly suppressed at low-T, thus highlighting a fully developed pseudogap in this more under-doped sample. Even so, there remains a small but finite residual γn at T = 0 and this reflects the Fermi arcs or pockets present in the under-doped cuprates which have been revealed in ARPES measurements on Bi2212 and La214 [13]. Integration of γn(T) gives the normal-state entropy Sn(T) shown by the red and black dashed curves in Figure 1B. The integrated area between Sn(T) and S(T) gives the superconducting condensation energy, U0, which will be discussed later.
(iii) Perhaps, most notably, the data show that the γ(T) curves for Y123 and Y124 come together at high temperature, whereas the S(T) curve for Y124 is displaced downward in parallel fashion relative to that for Y123. This arises from the presence of the pseudogap and its persistence to very high temperature. To see this, the entropy for a weakly interacting Fermi liquid is considered [14]:
where f(E) is the Fermi function and N(E) is the electronic DOS for one spin direction. This is just a weighted integral of the DOS with the “Fermi window” [f ln(f) + (1 − f) ln (1 − f)]. This Fermi window for S(T) is shown as a function of E in the insert of Figure 1B for three different temperatures. It is single peaked at EF and so a gap at EF (illustrated by the triangular gap in the figure) is always seen by the entropy, even at high T so long as the gap remains. In contrast, for γ(T) ≡ ∂S/∂T, the Fermi window is necessarily double peaked about EF, and at high enough temperature, it does not see the gap at EF. As a consequence, γ(T) returns to its bare value, while S(T) is suppressed until, and only if, the gap closes. The fact that S(T) remains suppressed in Figure 1B shows that the gap persists to the highest temperature investigated (nearly 400 K). The magnitude of the gap, E*, can be read off from where the extrapolation of the high-T linear section of S(T) intercepts the y-axis. For the triangular gap shown, the intercept is 2 ln(2) kBN0E*VM, where VM is the molar volume. If the DOS is non-zero at E = 0 with value N1, then the intercept is 2 ln(2) kB(N0 − N1)E*VM. As noted, such a finite value would reflect the presence of a small Fermi surface (arcs or pockets) [13], and this is confirmed by the non-zero value of γn (T = 0) for both Y123 and Y124 seen in Figure 1.
2.2 Y0.8Ca0.2Ba2Cu3O7−δ
Ca doping in YBa2Cu3O7−δ allows this system to be significantly over-doped at full oxygenation, with over-doped Tc reduced to about 45 K. This means that much of the superconducting phase diagram can be explored simply by changing δ by annealing and quenching [11]. For a 6-g sample, the mass change from deoxygenation is 144 mg, so δ can be measured rather accurately and even more accurately from the change in the residual phonon term of the specific heat. This system also benefits from the fact that the van Hove singularity (vHs) lies far below EF and is not traversed until beyond the superconducting domain [15]. This is important as the proximity of the vHs in other cuprates somewhat confuses the interpretation of the entropy and its parallel shift at high T, as we will see. Figure 2 shows (a) γ(T) and (b) S(T) for YBa2Cu3O7−δ over a range of doping states spanning the under- and over-doped regions [11].
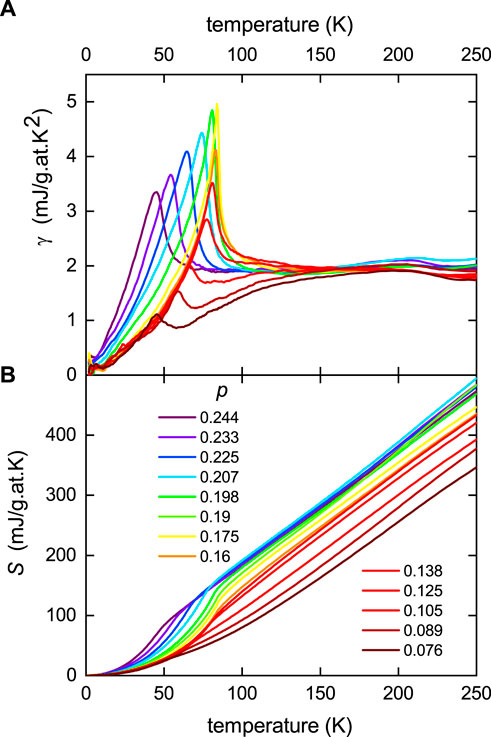
FIGURE 2. (A) Measured electronic specific heat coefficient, γ, for Y0.8Ca0.2Ba2Cu3O7−δ reported by Loram et al. [11]; and (B) the electronic entropy calculated from γ in (A) by integration. The doping states span from under-doped p ≈ 0.07 to over-doped p ≈ 0.23 in small steps of approximately 0.01.
The same features noted previously for YBa2Cu3O7−δ and YBa2Cu4O8 are evident, but now, the systematic effect of doping reveals a progressive reduction in the jump Δγ/γc with under-doping and a progressive downward parallel shift in entropy at high T, indicating a growing pseudogap with under-doping. At the same time, the value of γ at high T remains essentially doping independent. At no point does the entropy recover to its bare value at high T, again showing that the pseudogap does not close with increasing T. γ(T) exhibits a linear slope at low T, consistent with d-wave pairing. In the under-doped region at low-T, these curves stack on top of each other, while in the over-doped region, they become increasingly steeper. This slope is proportional to 1/Δ0, where Δ0 is the amplitude of the d-wave gap as T → 0. Accordingly, it can be seen that the gap amplitude remains more or less constant in the under-doped region and falls in the over-doped region, just as found in systematic ARPES studies [16]. Values of Δ0 (divided by 2.5) obtained in this way are summarized in Figure 3. The values of E* obtained from the y-axis intercept of the high-T linear entropy are also plotted. E* descends more or less linearly with doping, vanishing at p ≈ 0.19. Additionally, at this critical doping level, the values of Δγ/γc abruptly begin to fall as the pseudogap opens.
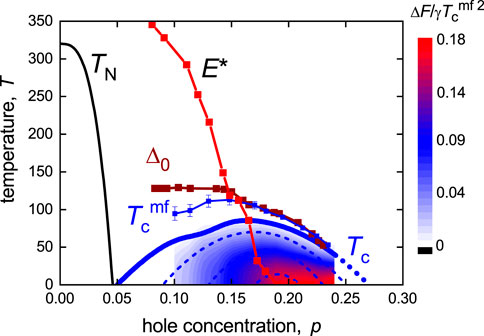
FIGURE 3. Summary of extracted data for Y0.8Ca0.2Ba2Cu3O7−δ. The Tc(p) phase curve; the ground-state superconducting energy gap, Δ0(p); and pseudogap energy, E*(p), all expressed in temperature units. The mean-field Tc,
2.3 Fluctuations and mean-field Tc
Examination of the transition steps in γ(T) at Tc shown in Figures 1, 2 reveals that these transitions are not completely abrupt but show the effect of fluctuations above and below Tc. These arise because of the low superfluid density found in the cuprates which results in strong fluctuations in both amplitude and phase, setting in simultaneously well above Tc [17]. As a consequence, Tc is pushed significantly below its mean-field value,
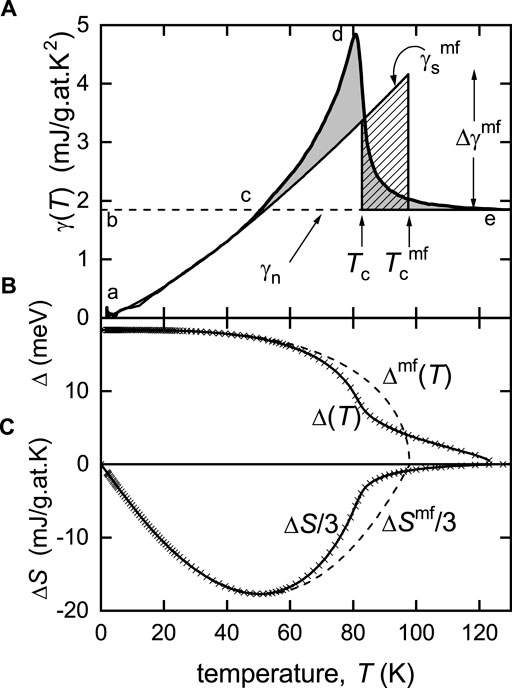
FIGURE 4. (A) Fluctuation analysis of the specific heat coefficient, γ(T), for Y0.8Ca0.2Ba2Cu3O6.75 to determine the mean-field Tc value,
Figure 4 shows the specific heat coefficient, γ(T), for Y0.8Ca0.2Ba2Cu3O6.75. At this doping (p = 0.185), the pseudogap has just closed and the normal-state specific-heat coefficient γn(T) is essentially constant (dashed line).
By integrating γ(T) − γn(T) in Figure 4A, we obtain ΔS = Ss − Sn and similarly for
These integrals were evaluated for all the doping states and the false-color plot in Figure 3 is
2.4 Pairing gap
Elsewhere [21], we have shown that starting from the BCS Hamiltonian one can deduce
where ζ = 1 for s-wave and 1/2 for d-wave and N (0) is obtained from the usual expression for the Sommerfeld “constant”
where λ is the usual electron–boson coupling parameter in the Eliashberg theory [22] and N0 is the bare band DOS, un-renormalized by electron-boson or Coulomb effects. Thus, Eq. 2 expresses Δ(T) directly in terms of thermodynamic functions ΔF, ΔS = Sn − Ss, and ΔU = Un − Us, which we have calculated. We do not know the magnitude of λ in Eq. 3, so we relate N (0) to γn using Eq. 3 with λ = 0 recognizing then that deduced values of Δ(T) should be larger by the factor
Several points are worth noting: (i) first, Δmf(T) is found to follow almost precisely the BCS d-wave temperature dependence. This means that the cuprates are close to weak-coupling behavior as we have previously deduced [17], thus justifying the basic assumptions of our analysis. (ii) Second, with increasing temperature, Δ(T) starts to fall below Δmf(T) at the onset of SC fluctuations below Tc. At Tc, there is an inflection in Δ(T) which then remains finite and falls only slowly to zero above Tc, and indeed well above
2.5 La2−xSrxCuO4
Turning now to La2−xSrxCuO4, we illustrate the complicating role of a proximate vHs [24]. Figure 5 shows (a) γ(T) and (b) S(T) for this system over a rather broad range of doping values (annotated) [11], including some unpublished data. The most extremely over-doped data (x = 0.30, 0.35, and 0.45) are depicted by the dashed curves for ease of identification. As found for Y0.8Ca0.2Ba2Cu3O7−δ, the γ(T) data come together at high temperature, although the convergence seems slower because of the broader doping range, and likewise the entropy curves, S(T), remain spread out at high T as a set of parallel straight lines which do not close at any temperature, consistent with a normal-state gap which never closes at elevated temperature. But at what doping level does the pseudogap finally close? The high-T linear portion is linear to the origin just above x = p = 0.17, so this would seem to be the general location of pcrit where the pseudogap closes. But, above this doping level, the curves continue to spread out in a parallel manner but now with negative curvature. This arises from the close proximity of the vHs, observed in ARPES to lie at x ≈ 0.21 [24]. The approach of the vHs is evident in γ(T) from the peaks (arrowed in Figure 5A) which migrate progressively toward T = 0 at the vHs crossing, which in these polycrystalline samples lies at 0.23. It is also evident in S(T) by the entropy rising to a maximum at x = 0.23 before falling again once the vHs moves into the unoccupied states above EF. This peak should not be confused with the peak expected from normal-state pair dissociation above Tc within the so-called “pairon” model [4] of the pseudogap. Such a pair-dissociation peak would result in S(T) curves recovering their bare values at high temperature, which clearly they do not. It must be recalled that this peak is absent in Y0.8Ca0.2Ba2Cu3O7−δ where the vHs is much further removed below EF [15].
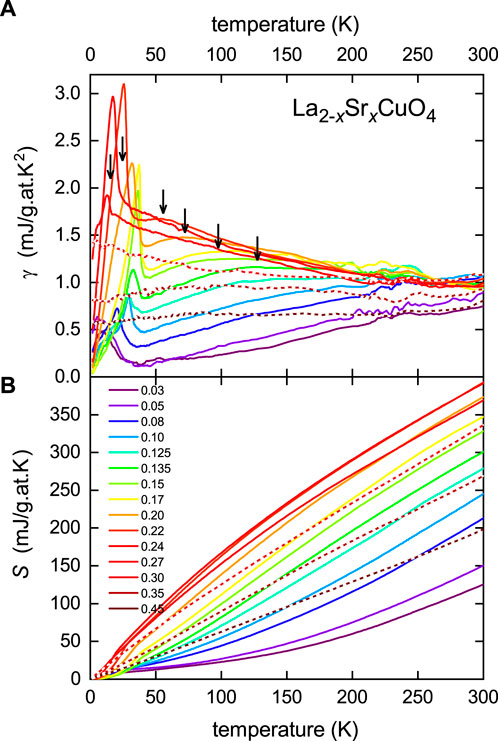
FIGURE 5. Measured thermodynamic data for La2−xSrxCuO4. (A) γ(T) for x ranging from 0.03 to 0.45 (see color-coded legend). Curves for x = 0.30, 0.35, and 0.45 are dashed for ease of identification. The peaks associated with the proximate van Hove singularity are indicated by arrows. (B) The electronic entropy, S(T). Data partly from [11].
The vHs crossing point is easily identified in plots of γ(p, T) vs p at fixed T (such as 40 or 50 K). This passes through a more or less symmetric peak at x = 0.23 (as does the susceptibility [11]), the location of the vHs. Zhong et al. have calculated γ(p, 0) vs p from the ARPES-derived dispersion and the curves are essentially identical to the experimental data described previously, except theirs peak at x = 0.21. The small difference, 0.21 vs 0.23, for bulk samples is probably attributable to the use of epitaxial thin films in the former. This could, for example, be due to lattice strain or incomplete oxygenation in the latter.
2.6 Bi2Sr2CaCu2O8+δ
Similar behavior is observed in Bi2212. Differential specific heat measurements were carried out on three samples, namely, pure, Pb-substituted to enable excess doping, and Y-substituted to enable increased under-doping. Where the sample dopings overlapped, the data were in remarkable agreement [11]. We focus on the pure Bi2Sr2CaCu2O8+δ data which were fitted [25] in the normal state using a rigid ARPES-derived anti-bonding band dispersion reported by Kaminski et al. [26] together with the standard non-interacting Fermion model, Eq. 1, for calculating the entropy. The fits are excellent [25], but, for the sake of clarity and because they are so instructive, we show here only the calculated normal-state curves. Figure 6 shows these normal-state fits for (a) γ(T) and (b) S(T) plotted for the different doping levels investigated ranging from p = 0.129 to 0.209 as annotated in the legend. For Bi2212, the anti-bonding band vHs crossing occurs at p ≈ 0.23 as was found in the ARPES study by Kaminski et al. [26]. The fits of course quantify the separation, ΔEvHs, of the vHs below EF. The legend includes ΔEvHs values for each doping level.
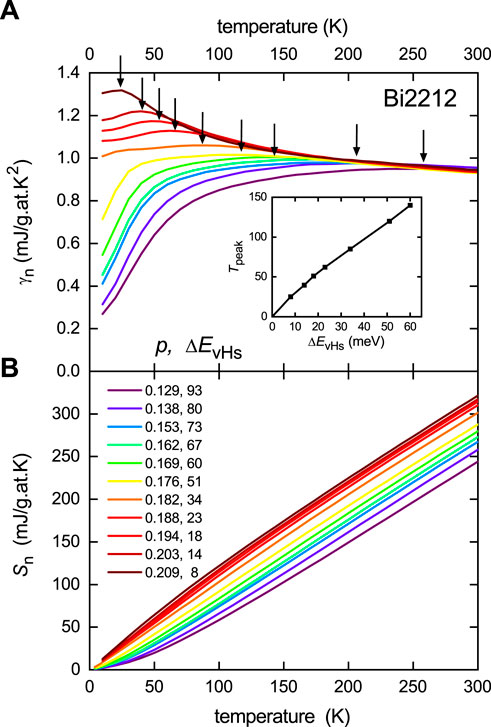
FIGURE 6. (A) Normal-state values of γ(T) fitted to the experimental data for Bi2212 [25] using the ARPES-derived dispersion of Kaminski et al. [26] and evaluated below Tc by entropy balance. The peaks associated with the proximate van Hove singularity are indicated by arrows. (B) The normal-state electronic entropy obtained by integrating γn(T) in (B). The different doping levels, p, are given in the legend along with the energy difference, ΔEvHs, of the vHs below EF in meV. The inset shows the dependence of the vHs peak temperature on ΔEvHs.
The plots show, at high temperature, the same generic convergence of γ(T), combined with a parallel shift of S(T) that never closes. The entropy is linear to the origin at a doping of 0.18 or 0.19. This is where the pseudogap closes. Below this doping, the transition jump, Δγc, collapses rapidly confirming the opening of the pseudogap. The opening of the pseudogap is also seen in the onset of a suppression of γ(T) at low T. However, like La214, at higher doping, the entropy curves develop negative curvature and continue to shift to higher values in a parallel manner. Again, this is due to the approaching vHs which is seen more clearly in γ(T) by the local peaks which are arrowed in the figure and which push to increasingly lower temperature as the vHs is approached. The distance from the vHs is given in terms of the peak location, Tpeak, by ΔvHs ≈ 4.3kBTpeak as shown in the inset to Figure 6A.
3 Field-dependent specific heat
The field dependence of the specific heat provides important additional information on the pseudogap. Crucially, the difference in total specific heat in zero field to that in applied field is free of any contribution from the phonon specific heat. A potential criticism of the extraction of the electronic specific heat from the much larger total specific heat in differential measurements is the possible mischaracterization of the residual phonon term. Differencing the field-dependent data totally removes that uncertainty and we are left exclusively with the bare electronic term. The use of differential measurements only serves to greatly increase the accuracy of the measurement of that field-dependent electronic term.
Furthermore, the field-dependent free energy enables the superfluid density, λ(T)−2, to be extracted as follows. The change of free energy ΔF(H, T) = F(H, T) − F (0, T) can be analyzed in terms of the London model for the field-dependent magnetization [27]:
where γE is Euler’s constant (=0.5772). By integration with respect to H, then assuming H ≫ Hc1, this yields:
Thus, by plotting ΔF(H, T)/H vs ln(H), one expects linear behavior with slope proportional to the superfluid density, ρs = λ−2, and x-axis intercept giving ln(Hc2). Most of our samples are polycrystalline with near-random grain orientation, and so this expression needs to be modified to take into account anisotropy. Specifically, when the field is applied at angle θ to the crystalline c-axis, λ−2 becomes
where VM is the molar volume and ΔF is in units of J/mol. We now apply this analysis to Bi2212.
3.1 Bi2Sr2CaCu2O8+δ
Figure 7 shows (a) the experimental values of γ(T) for the same range of doping states as shown in Figure 6B, and (b) the difference, Δγ(13, T) = γ(13, T), − γ(0, T) in γ(T) at 13 T and that at 0 T. The abrupt effect of the opening of the pseudogap can be seen in both datasets by the collapse of the jump in γ at Tc starting at p = p* = 0.19. In the over-doped region above this doping level, the jump remains constant in height for both. This clearly shows that the sudden fall in Δγc at p* is not an artifact of the subtraction of the phonon contribution but is fundamental to the electronic behavior.
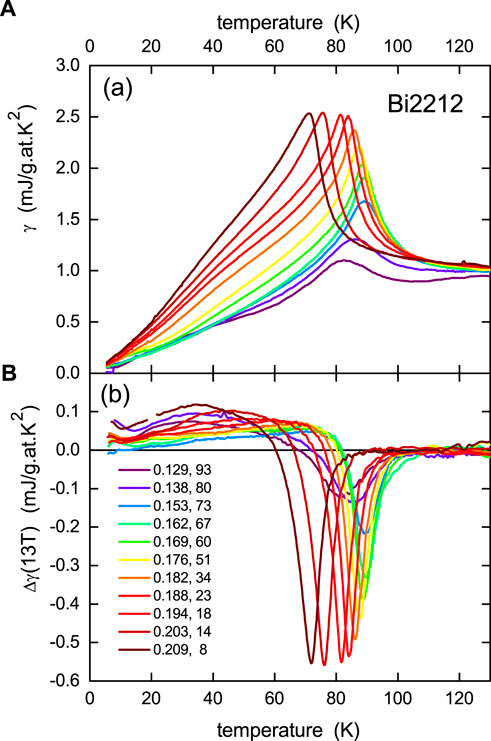
FIGURE 7. (A) Electronic specific heat coefficient, γ(T), measured for Bi2Sr2CaCu2O8+δ (Bi2212) for different doping levels, p, as annotated in the legend in the lower panel. The legend shows p and ΔEvHs values as in Figure 6(B). Panel (B) shows the difference Δγ(13, T) = γ(13, T) − γ(0, T) between the specific heat coefficient at 13 T and that at 0 T. It is noted that the peaks in both γ(T) and Δγ [13] occurring at Tc remain of the same height above p* and then fall rapidly for p < p* = 0.19 as the pseudogap opens.
Δγ(H,T) may be integrated to obtain the field-dependent entropy and the free energy, ΔF(H, T), by integration again of the entropy. We find it preferable to perform just a single integration and obtain the free energy using the following generic thermodynamic relation:
where the first term is the electronic internal energy, − ΔU(H, T), and the second term is the electronic entropy term, TΔS(H, T). Ideally, the integrals in Eq. 7 are from τ = Tc down to some value of T < Tc. However, as noted, the cuprates are distinguished by strong fluctuations over quite a broad range around Tc, and as a consequence, the integrals must be performed from some temperature, τ, well above Tc, sufficiently above the range of superconducting fluctuations, where Δγ(H, τ), ΔF(H, τ), and ΔS(H, τ) have fallen to zero.
In Figure 7B, we linearly extrapolate Δγ(13, T) to zero at T = 0 from 20 K, integrate as in Eq. 7 to obtain the field-dependent state functions, and these are plotted in Figure 8.
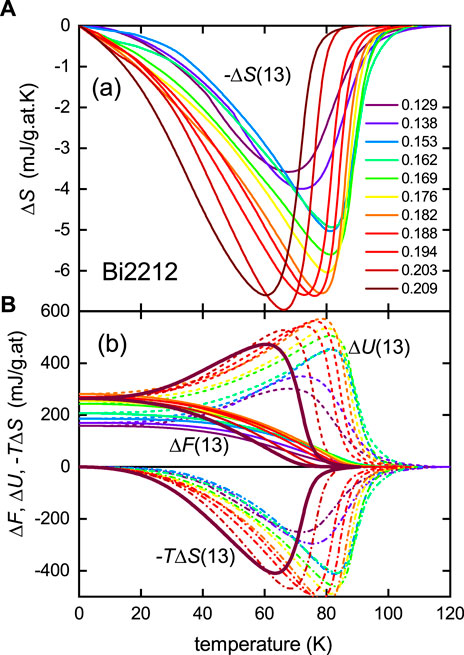
FIGURE 8. (A) Magnetic entropy, ΔS (13, T) = S (13, T) − S (0, T) obtained by integrating Δγ(13, T) = γ(13, T) − γ(0, T) from Figure 7B; (B) the magnetic free energy, ΔF (13,T) = F (13, T) − F (0, T), obtained using Eq. 7, and its internal energy and entropy components ΔU (13, T) (dashed curves) and − TΔS (13,T) (dash-dot curves) for Bi2Sr2CaCu2O8+δ. The heavy solid curves highlight the data for the highest doping level for ease of identification.
It is interesting that the effect of superconducting fluctuations in ΔU and TΔS extend to rather high temperatures, while these largely cancel in ΔF and thus extend over a much smaller range above Tc.
We use these data to calculate the superfluid density
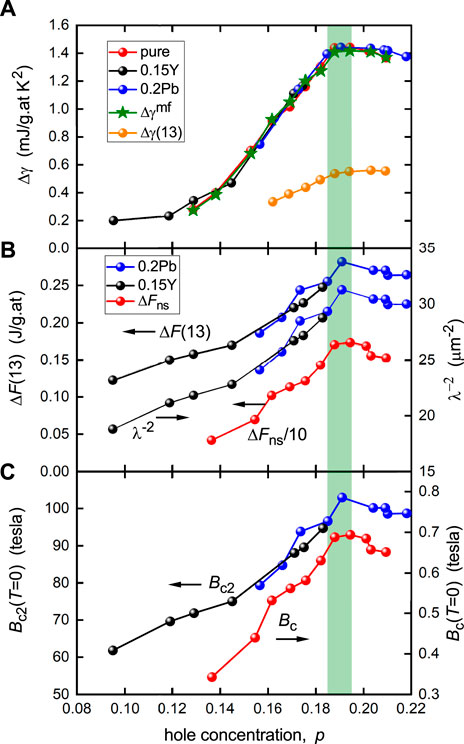
FIGURE 9. (A) Doping dependence of the jump in γ at Tc for three different compositions of Bi2212 as annotated. The mean-field value, Δγmf, obtained from a fluctuation analysis is also shown. (B) Magnetic free energy, ΔF (13, T = 0) = F (13, 0) − F (0, 0), as a function of doping and the resultant T = 0 superfluid density,
Next, in Figure 9B, we show the calculated ground-state values of
Finally, in Figure 9C, we show the upper critical field Bc2 obtained from our field-dependent analysis using Eq. 6, as well as the thermodynamic critical field Bc obtained from the values of ΔFns shown in Figure 9B. Like all other thermodynamic parameters, both collapse below p* as the pseudogap opens. The maximum value of Bc2 = 105 T is reasonable and consistent with other independent measures [29].
3.2 Superfluid density in the over-doped region
Though the topic here is pseudogap thermodynamics, applicable only to under- and optimally doped cuprates, it is worth briefly refocusing on the superfluid density in the over-doped region. It has long been realized that over-doped physics is probably just as puzzling and unconventional as under-doped physics, and this is no better highlighted than in the unusual behavior of λ(0)−2 which has widely been reported to fall along with Tc as doping increases toward the end of the superconducting dome [30–32]. The fall-off in both Tc and λ(0)−2 on both sides of the dome has come to be known as the “boomerang effect” and λ(0)−2 was shown to reach a sharp maximum at p* [32]. Renewed interest in this long-established result came more recently with the highly detailed studies of Božović et al. [33] on high-quality thin films of La2−xSrxCuO4 which showed a linear decline in λ(0)−2 with Tc across the entire over-doped region. However, the just-discussed field-dependent specific heat shows that for Bi2212, λ(0)−2 remains largely constant in the over-doped region where p > p* (see Figure 9B), along with all the other properties plotted in Figure 9. Already, Tc has fallen from 92 K to 74 K with no significant fall-off in superfluid density. This is reassuring because, as shown previously, both Δγmf/γn and
4 Discussion
The previous results summarize some of the more significant aspects of pseudogap thermodynamics. The key features are as follows: (i) the suppressed entropy associated with the opening of the pseudogap is never recovered at high temperature, thus implying the gap does not close at high temperature; (ii) the pseudogap closes abruptly at p = p* ≈ 0.19 holes/Cu, independent of temperature; (iii) accordingly, the pseudogap closes on a vertical line in the T-p phase diagram; (iv) this coincides with the vertical line found in ARPES separating incoherent antinodal (AN) states from coherent AN states [36]; (v) the pseudogap energy scale descends more or less linearly with doping from the scale of the nearest-neighbor exchange energy J at low doping to zero at p* [11]; (vi) rather conventional behavior is found beyond p* with the scaled ratios for the gap, the jump in γ and the condensation energy lying close to near-weak-coupling values and the superfluid density apparently remaining constant; (vii) the residual γn(T = 0), obtained from entropy balance fits, is qualitatively consistent with the presence of Fermi arcs or pockets lying between the AN pseudogaps. In short, the overall behavior is consistent with near-weak-coupling BCS-like behavior in the over-doped region with an independent but coexisting gap in the optimal and under-doped regions. This gap remains of unknown origin but it seems clearly associated with short-range spin-singlet correlations deriving its fundamental energy scale from J. One intriguing possibility is that these correlations suppress a Kondo, or heavy Fermion-like, build-up of spectral weight at the Fermi energy [37].
It is instructive to now place these findings in the context of calculations and other spectroscopies.
4.1 Theory and calculations
Loram [38] has examined a simple BCS-like model with a temperature-independent competing gap, E*, using an approach similar to that of Bilbro and MacMillan [39] where the superconducting gap and pseudogap are combined quadratically. Thus, the order parameter Δ′ is given by
As already noted, Storey et al. [25] have used the rigid tight-binding model of Kaminski et al. [26] derived from ARPES measurements on Bi2212 to calculate S(T) and γ(T) in both the normal and superconducting states using a self-consistent solution of the gap equation in the presence of a pseudogap with Fermi arcs. The fitting parameters were E*, the height, ΔvHs, of the Fermi level above the vHs and the length of the Fermi arc. The fits were extremely faithful in the superconducting and normal states, including the progression of the small local peak in γ(T) arising from the nearby vHs. They reproduce the parallel shift in entropy as the pseudogap widens. Of course, the pseudogap model was necessarily somewhat arbitrary but these calculations were extended [41] to the very specific Yang–Rice–Zhang (YRZ) model of Fermi surface reconstruction [42] and shown to accurately reproduce key observed thermodynamic features. Two particular features of the YRZ model include (i) a very asymmetric gap about EF which nicely accounts for the rapidly growing thermopower, Σ(p, T), in the under-doped region [3, 43], and (ii) the appearance of AN electron pockets in a small doping range close to the reconstruction point. These were shown to account for a double undulation of Σ(p,T) at low temperature when p ≈ 0.175 [3].
Many authors have interpreted the distinctive phase behavior of the cuprates in terms of a crossover from a Bose–Einstein condensate (BEC) to a BCS condensate [28, 44, 45, 46, 47, 48]. In this way, the pseudogap state is viewed as a (partially) paired state which condenses to a coherent paired state at Tc [4]. This, of course, explains amongst other things the reduced specific heat jump in the under-doped region because it lacks the pairing contribution which has already reduced the entropy from well above Tc [48]. Many detailed theoretical studies have pursued this line of thought. As noted, our principal objection lies in the expectation that such models, in the ground state, lose all memory of their precursor pairing state, where at T = 0, all thermal fluctuation is quenched and all pairs are condensed. In contrast, the experimental observation is that the pseudogap is still present at T = 0. An equally compelling objection is found at high temperature where, depending on the pair-binding energy, pairs should dissociate thus recovering the “lost” entropy [4]. Such a recovery is not found in the experimental data. In the context of BEC to BCS crossover, it was recently shown that the phase diagram may exhibit multiple pseudogaps [49]. This is of course quite possible, but we note that the previous thermodynamic studies show no evidence of multiple pseudogaps. One would expect to see closure of the smaller pseudogap at some threshold temperature with associated partial entropy recovery, prior to closure of the larger pseudogap at higher temperature, thus completing the entropy recovery. Multiple pseudogaps, if present, should also be seen in the c-axis infrared conductivity, located at distinct frequencies. Only two gaps are observed [50, 51]: the superconducting gap that opens at Tc resulting in a downshift in spectral weight, and the pseudogap, already present at 300 K, resulting in a canonical upward shift in spectral weight.
4.2 Comparison with other spectroscopies
In view of the continuing divergence of opinion regarding phenomenology, phase extent, and impact of the pseudogap, it is important to consider the thermodynamic data alongside other spectroscopies. Figure 10A shows our values of Δ0(p) and E*(p) for Y0.8Ca0.2Ba2Cu3O7−δ derived from specific heat measurements and compares these with those derived from (b) ARPES, (c) infrared optics, and (d) intrinsic tunneling. We now consider each of these spectroscopies in turn.
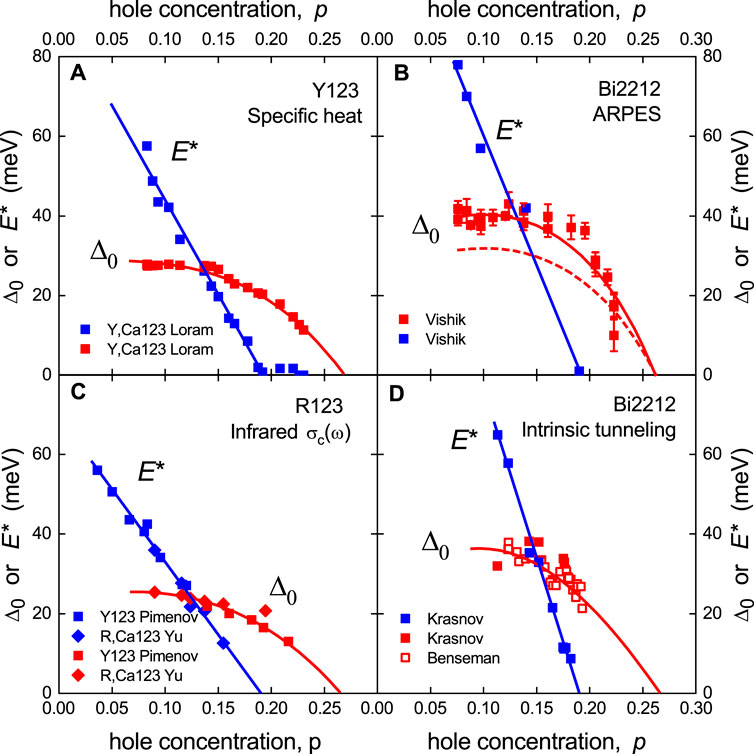
FIGURE 10. Doping-dependent values of Δ0(p) (red symbols) and E*(p) (blue symbols) for (A) Y0.8Ca0.2Ba2Cu3O7−δ derived from our specific heat measurements, (B) for Bi2212 derived from ARPES measurements [16], (C) for RBa2Cu3O7−δ obtained from c-axis infrared measurements [52, 50], and (D) for Bi2212 from intrinsic tunneling measurements: squares [52] and open squares [20]. The solid curves and lines are guides to the eye. In panel (B), the red dashed curve represents the line of the Vishik data when we linearly extrapolate the pairing gap to the AN.
4.2.1 ARPES
ARPES measurements are mainly focused on Bi2212 (and, to a lesser extent, Bi2201 and Bi2223) because of the cleavability of these crystals. There are two key results from ARPES measurements on the cuprates that we wish to focus on. First, the observation of a very abrupt crossover at p = 0.19 from incoherent AN states for p < 0.19 to coherent AN states for p > 0.19. We pointed this out long ago for 100 K data [53], but a more recent study extending to room temperature showed this abrupt crossover to occur at p = 0.19, independent of temperature [36], that is, following a vertical line coincident with our vertical T*(p) line. We mention this because such a vertical T*(p) line is not recognized in the research community. The ARPES result adds credence to such a view.
The second important result from ARPES is the observation that in the under-doped region, the pseudogap forms on the Fermi surface around the AN location at temperatures well above Tc, leaving Fermi arcs or pockets nearer the nodes on which the superconducting gap opens at Tc. Some authors presume the AN gap to be the pairing gap [28], but such a conclusion is difficult to sustain in the light of ARPES measurements. For example, Vishik et al. [16] in figure 3 (b1)−(b3) show the k-dependent gap around the Fermi surface plotted as a function of (1/2)| cos kx − cos ky|. For a pure, single d-wave gap, such a plot would be a straight line. In their b1 and b2, the AN pseudogap is evident above Tc, much larger than the superconducting gap, Δ(k), which appears on the flanks of the pseudogap below Tc. Linear extrapolation of Δ(k) gives an amplitude (projected to the AN) of 33 meV in b1 (p = 0.0.097), 31 meV in b2 (p = 0.0.14), and 28 meV in b3 (p = 0.0.205). The pseudogap amplitudes at the AN can also be read off (and these do not change with the onset of superconductivity): 78 meV in figure 4(c) as in the reference (p = 0.0.076), 57 meV in b1, and 45 meV in b2. These pseudogap amplitudes are plotted in Figure 10B as blue squares, while the superconducting gap amplitudes, Δ0, reported by Vishik are plotted as red squares. The trends with doping are very similar to the gaps inferred from specific heat. Curiously, the Δ0 amplitudes reported in Ref. [16] are larger than the extrapolated values noted above. The red dashed curve reflects these latter values. There is even better agreement with the specific heat values, and we recall that Δ0 determined from specific heat must yet be enhanced by the factor (1 + λ). (We note in passing that Figure 3 (b3) of Ref. [16] seems to suggest the persistence of the pseudogap at a doping of p = 0.205 as the blue data points at 82 K suggest a Fermi arc and a small AN gap above Tc. But this is just 2K above Tc = 80 K and is almost certainly the pairing gap which persists above Tc, as clearly shown by Kondo et al. [18]. The pairing gap in the near-node region does not persist far above Tc, while the AN pairing gap extends much further).
So we conclude from ARPES that the AN gap that stretches far above Tc is the pseudogap and the gap on the residual Fermi arcs that opens below Tc is the pairing gap. We quote from Ref. [16] “The sudden change in vΔ at p = 0.19 is interpreted as the T = 0 endpoint of the pseudogap” (vΔ is the velocity (∂Δ/∂k) parallel to the Fermi surface). Beyond p = 0.19, the Fermi arcs extend across the entire Fermi surface and the pairing gap forms on these commencing from just above, then below, Tc and extending fully out to the AN. Thus, if we focus only on the AN gap, in the under-doped region, it is the pseudogap, and for p > 0.19, the AN gap is the pairing gap, Δ(T), while around optimal doping, it could be either, depending on which is larger. If one chooses to focus only on the AN gap, one will infer a roughly linearly descending line of p-dependent gap values which vanish as Tc(p) vanishes. It is not uncommon in the field to select these AN gaps, and divide by kB to obtain a T*(p) line which remains finite across the over-doped region and vanishes as Tc(p) vanishes—in distinct contrast to our vertical T* line. But these are gap energies not temperatures; they have no place on a p-T phase diagram and they represent two distinct gaps: E* when p is somewhat less than 0.19 and Δ0 when p > 0.19.
4.2.2 Optics
There are also two key results from optics that we would emphasize. First, the frequency-dependent infrared conductivity, σc(ω), for R123 single crystals with electric field along the c-axis exhibits two distinct and often well-separated regions of loss of spectral weight (SW) associated with gaps opening on the Fermi surface [50, 51]. In the more under-doped region, there is a large-energy gap for which, already at 300 K, there is a suppression of sub-gap SW which continues to grow with decreasing temperature. This is the pseudogap and is located at ωPG. Below Tc, there is an additional SW loss occurring below a lower energy feature, ωSC, associated with the onset of superconductivity and the opening of a coherent pairing gap. The two distinct gaps can be tracked with doping and are plotted in Figure 10C by the blue and red squares, respectively. The doping evolution of these gaps is essentially the same as that inferred from the specific heat and ARPES. The AN pseudogap projects to disappear around p = 0.19, while the superconducting gap, Δ0, changes little on the under-doped side and falls on the over-doped side, tracking Tc(p) downward, as we have already concluded.
The second distinct feature of these infrared measurements is that the pseudogap is characterized by a transfer of SW upward to energies above ωPG [50]. In contrast, with the opening of the superconducting gap, SW is transferred downward into the zero-frequency delta function [50]. Moreover, the onset of pairing fluctuations above Tc also results in a downward shift of SW, not to zero frequency but to a low-frequency Drude peak [54]. Below Tc, this Drude peak is shifted, in turn, into the ω = 0 delta function. This, then, is the distinctive spectroscopic signature of the pseudogap vis à vis pairing—states below the pseudogap are shifted to higher energy. A pairing gap shifts SW downwards. For this reason alone, one may not interpret the large AN gap at low doping as a pairing gap.
4.2.3 Intrinsic tunneling spectroscopy
The final comparison here is with intrinsic tunneling spectroscopy (ITS), which in our view has been regrettably downplayed. Typically involving up to 20 bilayer stacks, intrinsic tunneling is arguably a bulk tunneling technique in comparison with scanning tunneling spectroscopy (STS) and ARPES which mainly probe the outer CuO2 layer. Moreover, STS is compounded by the presence of spatial inhomogeneity and broadened coherence peaks, while ITS consistently reveals very sharp gap features [52, 55] and the presence of two gaps with very different doping and temperature dependences. For example, investigations on Bi2(Sr2−xLax)CuO6+δ reveal a SC gap that closes at Tc with 2Δ0/kBTc = 4.2, while the pseudogap remains fixed in value with increasing temperature [55]. With increasing doping, the pseudogap reduces in magnitude and falls to zero at p ≈ 0.20 holes/Cu. This phenomenology is consistent with what has been described throughout this article. In the case of Bi2212, the evolution of E* and Δ0 with doping has been reported in detail by Krasnov et al. [52]. This system shows a behavior similar to the just-mentioned Bi2201, and the observed gap values are plotted in Figure 10D by the blue and red symbols, respectively. Here, each gap can be discerned, both when E* > Δ0 and when E* < Δ0. The detailed variation with doping is again consistent with all the other data shown in Figure 10, with the pseudogap falling steadily toward zero at p = 0.19. Such data have been questioned on the basis of overheating of the nanoscale mesas [56], but this can be addressed and eliminated [57, 58]. More recent intrinsic tunneling studies by Benseman et al. [20] have been carried out in closely spaced increments in doping. Their values of Δ0 are also plotted in Figure 10D by the open red symbols. They confirm the Krasnov data, and again, the correspondence with the specific heat and other spectroscopies is apparent.
4.3 Impurity scattering and the pseudogap
The effect of impurity scattering on superconductivity in the cuprates holds an important place in HTS physics because of the d-wave order parameter. Scattering mixes the phases of Cooper pairs and therefore mixes positive and negative quadrants of the order parameter. The result is a rapidly suppressed Tc and an even more rapidly suppressed superfluid density [35]. In the unitary scattering limit, the suppression of Tc and λ−2 is a purely thermodynamic process and the critical concentration of Zn, ycrit, for just suppressing superconductivity is a thermodynamic ground-state parameter. To justify this, we have previously shown the numerical agreement between S(Tc)/R and xcrit for Y0.8Ca0.2Ba2Cu3O7−δ, Bi2Sr2CaCu2O8+δ, and La2−xSrxCuO4 [35] across the superconducting phase diagram. As we have shown, this implies that superconductivity is destroyed when the density of unitary scatterers equals the pair density, that is, each scatterer breaks one pair [35].
Figure 11A shows this rapid suppression of the Tc(p) phase curve with Zn substitution in Y0.8Ca0.2Ba2Cu3O7−δ [59]. Significantly, the rate of suppression is much higher in the under-doped region, thus resulting in an asymmetric collapse of the phase curve around p* ≈ 0.19. The last vestige of superconductivity at critical doping occurs at p*, clearly a special point in the phase diagram of the cuprates. This enhanced suppression in the under-doped region is due to the presence of the pseudogap and the associated reduced DOS. We follow our treatment given earlier [59]. The Tc reduction for elastic scattering in weak-coupling d-wave superconductors follows the Abrikosov–Gorkov (A-G) equation [60]. Thus
where Ψ[x] is the digamma function; Tc0 = Tc (y = 0); and for unitary scattering, Γ = ni/(πN0) is the pair-breaking scattering rate. Here, N0 is the DOS per spin at the Fermi level and ni = αyab/abc is the density of impurity scatterers with yab being the “planar” concentration of Zn atoms in the CuO2 plane; α being the number of CuO2 planes per unit cell; and a, b, and c being the lattice parameters. For La214, α = 1 and yab = y, while for Y123, α = 2 and yab = 3y/2. For weak coupling, the critical scattering rate for suppression of superconductivity is Γc = 0.412Δ00 = αycrit/(abcπN0). Finally, the DOS is related to γn by the standard relation
This is, of course, true only if N(E) is not strongly energy dependent. However, the essentially constant γ(T) at high temperature, largely independent of doping, gives some credibility to this assumption.
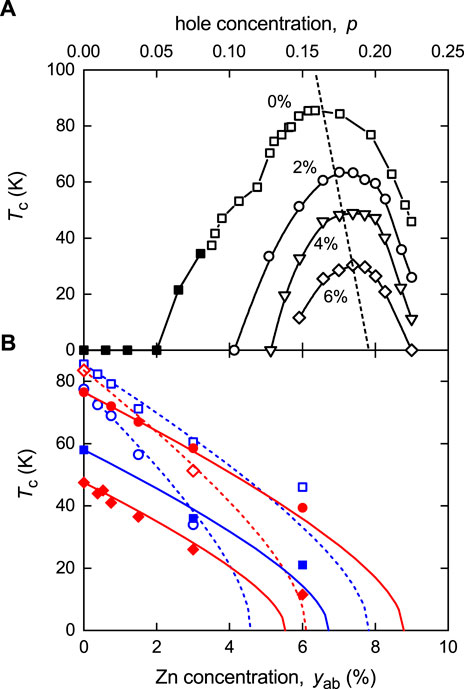
FIGURE 11. (A) Tc plotted as a function of hole concentration, p, for Zn-substituted Y0.8Ca0.2Ba2(Cu,Zn)3O7−δ at 4 different Zn concentrations: 0%, 2%, 4%, and 6%. The dashed line is a guide to the eye showing the asymmetric collapse of the phase curve toward p* ≈ 0.19. (B) Data points show Tc as a function of planar Zn concentration, yab for fixed doping states. Open symbols are under-doped and filled are over-doped. For ease of identification, colors alternate blue, then red, and then blue again with increasing doping. The lines are Tc vs yab calculated using Eq. 8. Dashed curves are under-doped, and solid curves, over-doped.
The problem is then fully defined with no fitting parameters. The A-G equation can be linearized for small Γ to get the initial linear slope as follows
where Δ00 is the T = 0 amplitude of the d-wave gap when yab = 0 and where γn is expressed in J mol−1 K−2. As the scattering rate is inversely proportional to N0, the role of the pseudogap is clear—as the AN gap opens, the DOS falls and the scattering rate increases. Observationally, γn is essentially constant, independent of doping, when p > 0.19 on the over-doped side, so the slope of Tc vs yab remains fixed on the over-doped side, as shown in Figure 11B. In contrast, it rises steeply on the under-doped side due to the presence of the pseudogap. Already at optimal doping, the curve has steepened showing that the pseudogap is present even there. The A-G equation is plotted by the curves shown in Figure 11B, where we have used for γn the quantity (S/T)Tc which is the average value of γn between T = 0 and Tc. All curves for all dopings show a good fit to the data with no free fitting parameter. Similar results were found for Bi2Sr2CaCu2O8+δ [61] and La2−xSrxCuO4 [59].
5 Conclusion
The results presented here summarize the key features of the thermodynamics of cuprate superconductors as they relate to the pseudogap. They reveal a unique and powerful insight into the essential physics, not only because the electronic specific heat captures all of the low-lying excitations but because the entropy always reflects the presence of a gap near the Fermi level, whether it be asymmetric about EF or indeed lies within a Fermi window below EF. Many spectroscopies will not see a normal-state gap at elevated temperature if the thermal energy, kBT, well exceeds the gap magnitude. The entropy will always see it. This probably lies at the heart of many observations which mistakenly identify a pseudogap closing temperature, T*, that descends more or less linearly with doping. It is the pseudogap energy E* which descends and vanishes at p*, independent of temperature. As a consequence, the specific heat reveals a vertical line delimiting the pseudogap in the p-T phase diagram, mirroring the abrupt vertical line observed in ARPES separating incoherent states from coherent states at the antinodal zone boundary [36]. Such a conclusion is fundamentally important to cuprate physics and is essentially overlooked in the community despite additional support from 1/17T1 data [62] and infrared optics. The proximity of the van Hove singularity in some over-doped cuprates complicates the interpretation unless the full complement of specific heat studies is considered over a wide range of cuprates, especially in Y0.8Ca0.2Ba2Cu3O7−δ where the vHs is more distant. Even so, the vHs can be identified clearly and the vHs crossing distinguished from the closure of the pseudogap at p* even in Bi2212 and La214.
The essential thermodynamic features are captured in Figure 12 which shows a false-color contour plot of S/T (a) as observed, and (b) as would be observed if superconductivity could be suppressed, that is, the normal-state value, Sn/T. Sn is calculated using the equal-area entropy-balance construction which is illustrated in Figure 1A. First, the as-observed entropy shows just how weak the superconducting transition is in the under-doped region—there is barely a change in entropy at Tc, in stark contrast to the over-doped region where the onset of superconductivity is evidently very strong. Pairing fluctuations are also evident near the transition, as is the vertical T* line defining a vertical ridge extending to room temperature. This ridge is definitively accentuated in the normal-state projection shown in Figure 12B. It extends from T = 0 to room temperature (and as shown elsewhere up to 400 K [12]). Evidently, (∂S/∂p)T diverges at p* as T → 0 and, using the appropriate Maxwell relation, (∂μ/∂T)p also diverges, thus underscoring the possibility of a hidden quantum critical point under the superconducting dome. Finally, the square data points show the doping dependence of E* descending, not along a T*(p) line but, along an entropy contour. The pseudogap takes its energy scale from the magnitude of J but descends rapidly and vanishes abruptly at p*, causing all suppressed thermodynamic features to fully recover at that point: the jump in specific heat, the critical fields, the superfluid density, and the condensation energy. All this is captured in this entropy plot. Beyond p*, essentially conventional behavior is recovered in all these thermodynamic entities. Thermodynamics does not disclose the origins of the pseudogap and its potential relationship to high-Tc superconductivity, but it clearly defines the phenomenology and phase extent in a way that the collective research community is largely yet to embrace.
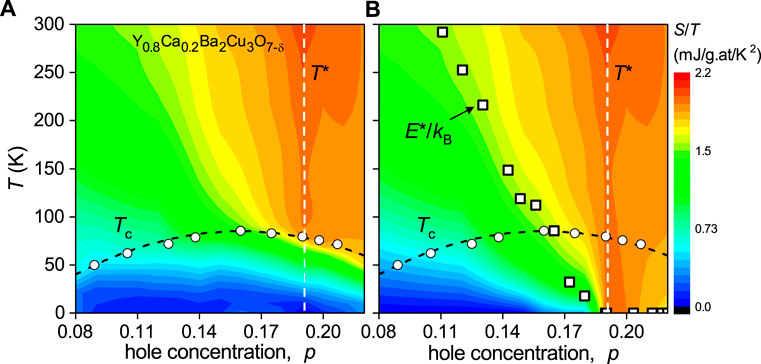
FIGURE 12. False-color maps in the p-T plane of S/T for Y0.8Ca0.2Ba2Cu3O7−δ (A) as measured, including the superconducting and normal states, and (B) for the normal state only if superconductivity were suppressed. The latter is determined using the equal-area entropy-balance method as illustrated in Figure 1(A). The square data points in (B) are the pseudogap energy as determined from the y-axis intercept of the linear entropy at high temperature.
Author contributions
This article summarizes collaborative work between the authors and their Cambridge colleagues over several decades. JT wrote the manuscript.
Acknowledgments
The authors are deeply indebted to the late Dr John W. Loram who designed, built, and refined the differential specific heat equipment, undertook many of the measurements reported here, and developed or shared in the development of many of the ideas presented. His passing was too early, and he was a great friend and a stimulating colleague. Thanks are also due to our long-standing colleague John R. Cooper, who collaborated in much of the work presented here and who very helpfully critiqued the manuscript.
Conflict of interest
The authors declare that the research was conducted in the absence of any commercial or financial relationships that could be construed as a potential conflict of interest.
Publisher’s note
All claims expressed in this article are solely those of the authors and do not necessarily represent those of their affiliated organizations, or those of the publisher, the editors, and the reviewers.
References
1. Alloul H, Ohno T, Mendels P. 89Y NMR evidence for a Fermi-liquid behavior in YBa2Cu3O6+x. Phys Rev Lett (1989) 63:1700–3. doi:10.1103/PhysRevLett.63.1700
2. Norman MR, Pines D, Kallin C. The pseudogap: Friend or foe of high Tc? Adv Phys X (2005) 54:715–33. doi:10.1080/00018730500459906
3. Storey JG, Tallon JL, Williams GVM. Electron pockets and pseudogap asymmetry observed in the thermopower of underdoped cuprates. EPL (Europhysics Letters) (2013) 102:37006. doi:10.1209/0295-5075/102/37006
4. Noat Y, Mauger A, Nohara M, Eisaki H, Sacks W. How ‘pairons’ are revealed in the electronic specific heat of cuprates. Solid State Commun (2021) 323:114109. doi:10.1016/j.ssc.2020.114109
5. Carbotte JP, Fisher KAG, LeBlanc JPF, Nicol EJ. Effect of pseudogap formation on the penetration depth of underdoped high-Tc cuprates. Phys Rev B (2010) 81:014522. doi:10.1103/PhysRevB.81.014522
6. Storey JG. Hall effect and Fermi surface reconstruction via electron pockets in the high-Tc cuprates. EPL (Europhysics Letters) (2016) 113:27003. doi:10.1209/0295-5075/113/27003
7. Putzke C, Benhabib S, Tabis W, Ayres J, Wang Z, Malone L, et al. Reduced Hall carrier density in the overdoped strange metal regime of cuprate superconductors. Nat Phys (2021) 17:826–31. doi:10.1038/s41567-021-01197-0
8. Loram JW, Mirza KA, Cooper JR, Liang WY, Wade JM. Electronic specific heat of YBa2Cu3O6+x from 1.8 to 300K. J Supercond (1993) 71:243–9. doi:10.1007/bf00730405
9. Tallon JL, Storey JG, Cooper JR, Loram JW. Locating the pseudogap closing point in cuprate superconductors: Absence of entrant or reentrant behavior. Phys Rev B (2020) 101:174512. doi:10.1103/PhysRevB.101.174512
10. Cooper JR, Loram JW. Some correlations between the thermodynamic and transport properties of high-Tc oxides in the normal state. J Phys France (1996) 6:2237–63. doi:10.1051/jp1:1996215
11. Loram J, Luo J, Cooper J, Liang W, Tallon J. Evidence on the pseudogap and condensate from the electronic specific heat. J Phys Chem Sol (2001) 62:59–64. doi:10.1016/S0022-3697(00)00101-3
12. Tallon JL, Loram JW. Field-dependent specific heat of the canonical underdoped cuprate superconductor YBa2Cu4O8. Sci Rep (2020) 10:22288. doi:10.1038/s41598-020-79017-3
13. Kanigel A, Norman MR, Randeria M, Chatterjee U, Souma S, Kaminski A, et al. Evolution of the pseudogap from Fermi arcs to the nodal liquid. Nat Phys (2006) 2:447–51. doi:10.1038/nphys334
14. Padamsee H, Neighbor JE, Shiffman CA. Quasiparticle phenomenology for thermodynamics of strong-coupling superconductors. J Low Temp Phys (1973) 12:387–411. doi:10.1007/bf00654872
15. Hossain M, Mottershead J, Fournier D, Bostwick A, McChesney J, Rotenberg E, et al. In situ doping control of the surface of high temperature superconductors. Nat Phys (2008) 4:527–31. doi:10.1038/nphys998
16. Vishik IM, Hashimoto M, He RH, Lee WS, Schmitt F, Lu D, et al. Phase competition in trisected superconducting dome. Proc Natl Acad Sci U S A (2012) 109:18332–7. doi:10.1073/pnas.1209471109
17. Tallon JL, Storey JG, Loram JW. Fluctuations and critical temperature reduction in cuprate superconductors. Phys Rev B (2011) 83:092502. doi:10.1103/PhysRevB.83.092502
18. Kondo T, Malaeb W, Ishida Y, Sasagawa T, Sakamoto H, Takeuchi T, et al. Point nodes persisting far beyond tc in Bi2212. Nat Commun (2015) 6:7699. doi:10.1038/ncomms8699
19. Gomes K, Pasupathy A, Pushp A, Ono S, Ando Y, Yazdani A. Visualizing pair formation on the atomic scale in the high-Tc superconductor Bi2Sr2CaCu2O8+δ. Nature (2007) 447:569–72. doi:10.1038/nature05881
20. Benseman TM, Cooper JR, Balakrishnan G. Temperature and field dependence of the intrinsic tunnelling structure in overdoped Bi2Sr2CaCu2O8+δ. Phys Rev B (2018) 98:014507. doi:10.1103/PhysRevB.98.014507
21. Tallon JL, Barber F, Storey JG, Loram JW. Coexistence of the superconducting energy gap and pseudogap above and below the transition temperature of cuprate superconductors. Phys Rev B (2013) 87:140508. doi:10.1103/PhysRevB.87.140508
22. Daams J, Carbotte J, Baquero R. Critical field and specific heat of superconducting Tl-Pb-Bi alloys. J Low Temp Phys (1979) 35:547–59. doi:10.1007/BF00117895
23. Varlamov LAA. Theory of fluctuations in superconductors. Oxford (U.K.): Clarendon Press (2005). p. 264.
24. Zhong Y, Chen Z, Chen SD, Xu KJ, Hashimoto M, He Y, et al. Differentiated roles of Lifshitz transition on thermodynamics and superconductivity in La2−xSrxCuO4. Proc Natl Acad Sci U S A (2022) 119:e2204630119. doi:10.1073/pnas.2204630119
25. Storey JG, Tallon JL, Williams GVM. Thermodynamic properties of Bi2Sr2CaCu2O8 calculated from the electronic dispersion. Phys Rev B (2008) 77:052504. doi:10.1103/PhysRevB.77.052504
26. Kaminski A, Rosenkranz S, Fretwell HM, Norman MR, Randeria M, Campuzano JC, et al. Change of Fermi-surface topology in Bi2Sr2CaCu2O8+δ with doping. Phys Rev B (2006) 73:174511. doi:10.1103/physrevb.73.174511
27. Fetter AL, Hohenberg PC. In: Parks RD, editor. Theory of type II superconductors. Superconductivity, 2. New York: Marcel Dekker (1969). p. 838–43.
28. Harrison N, Chan MK. Magic gap ratio for optimally robust fermionic condensation and its implications for high-Tc superconductivity. Phys Rev Lett (2022) 129:017001. doi:10.1103/PhysRevLett.129.017001
29. Grissonnanche G, Cyr-Choinière O, Laliberté F, René de Cotret S, Juneau-Fecteau A, Dufour-Beauséjour S, et al. Direct measurement of the upper critical field in cuprate superconductors. Nat Commun (2014) 5:3280. doi:10.1038/ncomms4280
30. Niedermayer C, Bernhard C, Binninger U, Glückler H, Tallon JL, Ansaldo EJ, et al. Muon spin rotation study of the correlation between Tc and ns/m* in overdoped Tl2Ba2CuO6+δ. Phys Rev Lett (1993) 71:1764–7. doi:10.1103/PhysRevLett.71.1764
31. Uemura YJ, Keren A, Le LP, Luke GM, Wu WD, Kubo Y, et al. Magnetic-field penetration depth in Tl2Ba2CuO6+δ in the overdoped regime. Nature (1993) 364:605–7. doi:10.1038/364605a0
32. Bernhard C, Tallon JL, Blasius T, Golnik A, Niedermayer C. Anomalous peak in the superconducting condensate density of cuprate high-Tc superconductors at a unique doping state. Phys Rev Lett (2001) 86:1614–7. doi:10.1103/PhysRevLett.86.1614
33. Božović I, He X, Wu J, Bollinger A. Dependence of the critical temperature in overdoped copper oxides on superfluid density. Nature (2016) 536:309–11. doi:10.1038/nature19061
34. Dordevic SV, Homes CC. Superfluid density in overdoped cuprates: Thin films versus bulk samples. Phys Rev B (2022) 105:214514. doi:10.1103/PhysRevB.105.214514
35. Tallon JL, Loram JW, Cooper JR, Panagopoulos C, Bernhard C. Superfluid density in cuprate high-Tc superconductors: A new paradigm. Phys Rev B (2003) 68:180501. (R). doi:10.1103/physrevb.68.180501
36. Chen SD, Hashimoto M, He Y, Song D, Xu KJ, He JF, et al. Incoherent strange metal sharply bounded by a critical doping in Bi2212. Science (New York, N.Y.) (2019) 366:1099–102. doi:10.1126/science.aaw8850
37. Cooper JR. Pseudogap in hole-doped cuprates: Possible insights from the Kondo effect. Phys Rev B (2022) 105:L041102. doi:10.1103/PhysRevB.105.L041102
38. Loram J, Mirza K, Wade J, Cooper J, Liang W. The electronic specific heat of cuprate superconductors. Physica C: Superconductivity (1994) 235-240:134–7. doi:10.1016/0921-4534(94)91331-5
39. Bilbro G, McMillan WL. Theoretical model of superconductivity and the martensitic transformation inA15compounds. Phys Rev B (1976) 14:1887–92. doi:10.1103/PhysRevB.14.1887
40. Williams GVM, Tallon JL, Loram JW. Crossover temperatures in the normal-state phase diagram of high-Tc superconductors. Phys Rev B (1998) 58:15053–61. doi:10.1103/PhysRevB.58.15053
41. Storey JG. Incoherent superconductivity well above Tc in high-Tc cuprates—Harmonizing the spectroscopic and thermodynamic data. New J Phys (2017) 19:073026. doi:10.1088/1367-2630/aa79bf
42. Yang KY, Rice TM, Zhang FC. Phenomenological theory of the pseudogap state. Phys Rev B (2006) 73:174501. doi:10.1103/PhysRevB.73.174501
43. Obertelli SD, Cooper JR, Tallon JL. Systematics in the thermoelectric power of high-tc oxides. Phys Rev B (1992) 46:14928–31. doi:10.1103/PhysRevB.46.14928
44. Randeria M, Duan JM, Shieh LY. Bound states, Cooper pairing, and Bose condensation in two dimensions. Phys Rev Lett (1989) 62:981–4. doi:10.1103/PhysRevLett.62.981
45. Drechsler M, Zwerger W. Crossover from BCS-superconductivity to bose-condensation. Ann Phys (1992) 504:15–23. doi:10.1002/andp.19925040105
46. Sá de Melo CAR, Randeria M, Engelbrecht JR. Crossover from BCS to Bose superconductivity: Transition temperature and time-dependent Ginzburg-Landau theory. Phys Rev Lett (1993) 71:3202–5. doi:10.1103/PhysRevLett.71.3202
47. Bloch I, Dalibard J, Zwerger W. Many-body physics with ultracold gases. Rev Mod Phys (2008) 80:885–964. doi:10.1103/RevModPhys.80.885
48. Haussmann R, Rantner W, Cerrito S, Zwerger W. Thermodynamics of the BCS-BEC crossover. Phys Rev A (Coll Park) (2007) 75:023610. doi:10.1103/PhysRevA.75.023610
49. Tajima H, Yerin Y, Pieri P, Perali A. Mechanisms of screening or enhancing the pseudogap throughout the two-band Bardeen-Cooper-Schrieffer to Bose-Einstein condensate crossover. Phys Rev B (2020) 102:220504. doi:10.1103/PhysRevB.102.220504
50. Yu L, Munzar D, Boris AV, Yordanov P, Chaloupka J, Wolf T, et al. Evidence for two separate energy gaps in underdoped high-temperature cuprate superconductors from broadband infrared ellipsometry. Phys Rev Lett (2008) 100:177004. doi:10.1103/physrevlett.100.177004
51. Pimenov AV, Boris AV, Yu L, Hinkov V, Wolf T, Tallon JL, et al. Nickel impurity-induced enhancement of the pseudogap of cuprate high-Tc superconductors. Phys Rev Lett (2005) 94:227003. doi:10.1103/PhysRevLett.94.227003
52. Krasnov VM. Interlayer tunneling spectroscopy of Bi2Sr2CaCu2O8+δ: A look from inside on the doping phase diagram of high-Tc superconductors. Phys Rev B (2002) 65:140504. doi:10.1103/PhysRevB.65.140504
53. Tallon JL, Loram JW, Panagopoulos C. Pseudogap and quantum transition phenomenology in HTS cuprates. J Low Temp Phys (2003) 131:387–94. doi:10.1023/a:1022970312795
54. Dubroka A, Rössle M, Kim KW, Malik VK, Munzar D, Basov DN, et al. Evidence of a precursor superconducting phase at temperatures as high as 180 K in RBa2Cu3O7−δ (R=Y, Gd, Eu) superconducting crystals from infrared spectroscopy. Phys Rev Lett (2011) 106:047006. doi:10.1103/PhysRevLett.106.047006
55. Yurgens A, Winkler D, Claeson T, Ono S, Ando Y. Intrinsic tunneling spectra of Bi2(Sr2−xLax)CuO6+δ. Phys Rev Lett (2003) 90:147005. doi:10.1103/PhysRevLett.90.147005
56. Zavaritsky VN. Intrinsic tunneling or Joule heating? Phys Rev Lett (2004) 92:259701. doi:10.1103/PhysRevLett.92.259701
57. Krasnov VM, Sandberg M, Zogaj I. In situ measurement of self-heating in intrinsic tunneling spectroscopy. Phys Rev Lett (2005) 94:077003. doi:10.1103/PhysRevLett.94.077003
58. Krasnov VM. Comment on “Essence of intrinsic tunneling: Distinguishing intrinsic features from artifacts”. Phys Rev B (2007) 75:146501. doi:10.1103/PhysRevB.75.146501
59. Tallon JL, Bernhard C, Williams GVM, Loram JW. Zn-induced Tc reduction in high-Tc superconductors: Scattering in the presence of a pseudogap. Phys Rev Lett (1997) 79:5294–7. doi:10.1103/PhysRevLett.79.5294
60. Sun Y, Maki K. Impurity effects in d-wave superconductors. Phys Rev B (1995) 51:6059–63. doi:10.1103/PhysRevB.51.6059
61. Tallon JL. Normal-state pseudogap in Bi2Sr2CaCu2O8 characterized by impurity scattering. Phys Rev B (1998) 58:R5956–9. doi:10.1103/PhysRevB.58.R5956
Keywords: cuprates, pseudogap, specific heat, entropy, phase-diagram, BCS ratios, fluctuations, mean-field
Citation: Tallon JL and Storey JG (2022) Thermodynamics of the pseudogap in cuprates. Front. Phys. 10:1030616. doi: 10.3389/fphy.2022.1030616
Received: 29 August 2022; Accepted: 27 October 2022;
Published: 16 November 2022.
Edited by:
Saleh Naqib, Rajshahi University, BangladeshReviewed by:
Yuriy Yerin, University of Perugia, ItalyAtsushi Fujimori, The University of Tokyo, Japan
Copyright © 2022 Tallon and Storey. This is an open-access article distributed under the terms of the Creative Commons Attribution License (CC BY). The use, distribution or reproduction in other forums is permitted, provided the original author(s) and the copyright owner(s) are credited and that the original publication in this journal is cited, in accordance with accepted academic practice. No use, distribution or reproduction is permitted which does not comply with these terms.
*Correspondence: Jeffery L. Tallon, amVmZi50YWxsb25AdnV3LmFjLm56