 C. Ha1*
 Y. Jeong1W. G. Kang2J. Kim1K. W. Kim2S. K. Kim3Y. D. Kim2,4
 H. S. Lee2,4
 M. H. Lee2,4
 M. J. Lee5
 Y. J. Lee1K. M. Seo6
- 1Department of Physics, Chung-Ang University, Seoul, South Korea
- 2Center for Underground Physics, Institute for Basic Science (IBS), Daejeon, South Korea
- 3Department of Physics and Astronomy, Seoul National University, Seoul, South Korea
- 4IBS School, University of Science and Technology (UST), Daejeon, South Korea
- 5Department of Physics, Sungkyunkwan University, Suwon, South Korea
- 6Department of Physics and Astronomy, Sejong University, Seoul, South Korea
The concentration of 222Rn in the air has been measured in the 700 m-deep Yangyang underground laboratory between October 2004 and May 2022. The average concentrations (spreads) in two experimental areas, called A6 and A5, were measured to be 53.4 Bq/m3 (13.9 Bq/m3) and 33.5 Bq/m3 (7.9 Bq/m3), respectively. The lower value in the A5 area reflects the presence of better ventilation. The radon concentrations sampled within the two A5 experimental rooms’ air are found to be correlated to the local tunnel temperature outside of the rooms, with correlation coefficients r = 0.22 and r = 0.70. Therefore, the radon concentrations display a seasonal variation, because the local temperature driven by the overground season influences air ventilation in the experimental areas. A sinusoidal function with a period of 1 year was used to fit the radon concentration data of both underground areas finding a maximum amplitude on August, 31 ± 6 days.
Introduction
The energy contents of our universe are predominantly radiationless dark components whose nature ramains to be adequately understood. Based on astrophysical observations, it has been determined that 26% of all energy is formed by this so-called dark matter [1, 2]. Theoretically, the composition of dark matter is often modeled as various particles beyond the Standard Model of particle physics [3], wherein a weakly interacting massive particle (WIMP) is one of the most frequently considered candidates [4]. Searches for WIMPs are being conducted by a number of groups using a variety of experimental approaches [5–9]. One of these involve attempts to measure the energy deposited by nuclear recoils from WIMP interactions in the material of low-background detectors.
To date, no unambiguous evidence for WIMP–nucleus interactions has been reported, other than an annual modulation of residual events from the DAMA group that cannot be explained by known background sources [10, 11]. This modulation has been interpreted by some authors as a signal of the yearly changes in the direction of the Earth’s orbital motion in a galactic halo of dark-matter WIMPs [12]. On the other hand, other more mundane sources of modulations, such as cosmic-ray muon induced reactions, or radon concentrations in the air of the laboratory environment have been suggested and studied [13–17]. As part of these studies, measurements of the time dependence of the radon concentration are essential.
Radon can be produced as a daughter nuclei decay product from the radioactive nuclides in the material of the surrounding tunnel walls. Specifically, this material contains traces of uranium and thorium that are the primary sources of radon. For example, 222Rn (t1/2 = 3.82 days) is generated from the 238U decay chain and, being a noble gas, it can move through the vicinity near the surfaces of detector materials and decay to produce heavy elements. Its decay products such as 210Pb (t1/2 = 22.2 years) and 210Bi (t1/2 = 5.0 days) decay by emitting a beta particle which can act as background sources at low energies while the other daughter elements like 210Po (t1/2 = 138.4 days) produce an alpha particle and a nuclear recoil which can affect region of interest in rare decay experiments. Also, when the radon decays into its daughter isotopes, several gamma rays are produced and can contribute to the background spectrum of the dark matter data. Much effort has been made to understand the radon production mechanism and its mitigation in rare decay experiments especially at the underground laboratory environment [18–25].
The Yangyang underground laboratory hosts two dark matter experiments and one neutrinoless double-beta decay experiment and, since 2004, the underground radon concentration in air has been monitored. In this note, we report on the long-term variations in the radon concentration in air that is based on an analysis of these measurements.
Materials and methods
Experimental sites at Yangyang underground laboratory
The Yangyang underground laboratory (Y2L) is located adjacent to the underground generator of the Yangyang pumped water plant in east Korea. The plant contains the main access tunnel with auxiliary tunnels, named as A5 and A6, that house the experimental facilities. Fresh air from the surface enters the tunnels through the main ramp way and is pumped out via a separate duct. The power plant operates at minimum two exhaust fans continuously, each with 63,000 m3/h capacity. This exchanges the entire air volume of the 2.2 km-long main tunnel and auxiliary spaces once every 40 min. In the Yangyang region, the temperature averaged over the year is 11.8°C, with an average minimum of −2.2 °C in January and an average maximum of 24.3°C in August. Throughout the year, the temperature inside the tunnel is measured between 22°C and 26°C, and the relative humidity in the areas surrounding the laboratory is in the ranges of 60%–70%. The minimum granite overburden in these areas is 700 m (1800 m-water-equivalent depth) and the cosmic-ray muon fluxes at A5 and A6 (two are situated 300 m apart horizontally) are measured to be 3.795 ± 0.110 × 10⁻⁷ s−1 cm−2 [26, 27] and 4.4 ± 0.3 × 10⁻⁷ s−1 cm−2 [28], respectively. The subterranean rock is primarily composed of gneiss that contains 2.1 and 13.0 ppm of uranium and thorium, respectively, as measured by an inductively coupled plasma mass spectrometry [29].
The Korea Invisible Mass Search (KIMS) experiment [30] in the A6 tunnel operated a CsI (Tl) crystal array to search for dark matter for over 15 years, and it is currently used for R&D activities associated with the development of ultralow-background crystals. The COSINE-100 experiment [31, 32] uses NaI(Tl) crystals and is currently operating in the A5 experimental space. In addition, other experiments, including a search for neutrinoless double-beta decay experiment (called AMoRE-I) [33] and a high-purity Germanium array (HPGe) [34] are operating in other rooms situated in the A5 tunnel. The A5 area is equipped with a radon reduction system (RRS)1 that supplies radon-filtered air to each experimental room as required. While the RRS is providing radon-reduced air with a flow of 140 m3/h to an experimental room, the measured concentration in the room air is 10–100 times lower than that of the room air with the RRS off.
Since the A6 tunnel area is separated from the main tunnel by doors, the air flow rate is somewhat restricted. In contrast, the entrance of the A5 tunnel is always open and the tunnel is equipped with its own air supply system that provides relatively robust air circulation. The system extracts the main tunnel air and supplies to the end of the A5 tunnel using two 2,300 m3/h fans which exchange the branch tunnel air once every hour. A schematic drawing of the Y2L arrangement with the locations of the A5 and A6 areas indicated is provided in Figure 1.
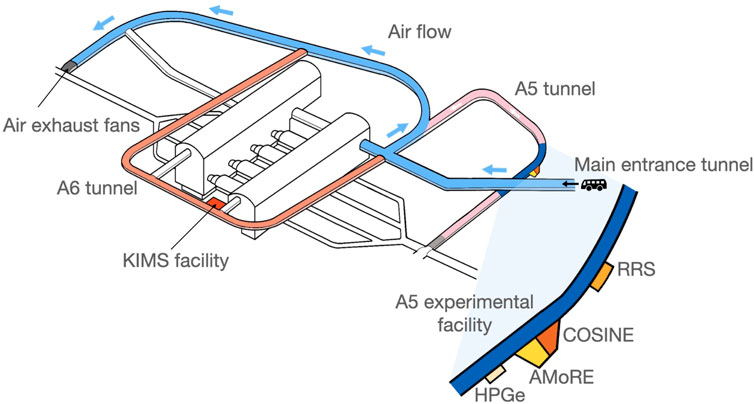
FIGURE 1. A map of Y2L. The experimental areas are accessed by vehicles through the main entrance. Since air is exhausted by fans at the end of the main tunnel, fresh air flows in a single direction. The KIMS experiment was located in the A6 tunnel, whereas the newer facilities are situated in the A5 tunnel, including the COSINE-100, AMoRE-I, and HPGe experiments. A5 and A6 are horizontally separated by 300 m, and A5 is approximately 50 m deeper than A6.
The COSINE-100 experiment is housed in an environmentally regulated room with controlled humidity and temperature. Its detection room has a floor area of 44 m2 and a ceiling height of 4 m. The air control system maintains the room temperature at 23.5 ± 0.1°C and relative humidity at 37 ± 1%. The isolated air in the room is continuously circulated through a HEPA filter, and the number of dust particles larger than 0.5 μm is maintained below 1,500 per cubic foot. The room air is sampled by a radon detector. These environmental parameters in the experimental room and in the tunnel are monitored online. The details of experimental control are described in [35].
Radon counter setup
Since 2004, a custom-design radon detector measured the radon concentration at the A6 KIMS detector room. The detector consisted of 69.3 L of a chamber for air sampling and a 900 mm2 silicon PIN diode for an alpha particle sensor on which an ionized polonium isotope can attach and decay [29]. In 2011, this detector was replaced with a commercially available detector from Durridge company (RAD7-1) [36]. In 2016, the RAD7-1 detector was moved to the COSINE-100 detector room, where it has been functioning ever since. Another commercial counter (RAD7-2, the same model as RAD7-1) was installed in the HPGe detector room in 2016. In the RAD7 devices, a silicon diode sensor is located at the center a drift chamber with an applied electric field. When a222Rn nucleus decays inside the drift chamber, it produces a positively charged 218Po ion that drifts to and sticks on the surface of the diode’s sensitive area. Within a few minutes, the 218Po nucleus decays into a214Pb nuclei and an alpha particle, and the alpha particle produces an energy in the diode. The rate per unit volume for these signals reflects the mother 222Rn isotope concentration in the drift chamber air volume. The specified RAD7 detection limit is at 4 Bq/m3 with 5% accuracy at normal humidity levels [36]. In this way, the total radon level in the room air is measured every 2 h and the recorded data are transmitted to a slow monitoring server, as displayed in Figure 2.
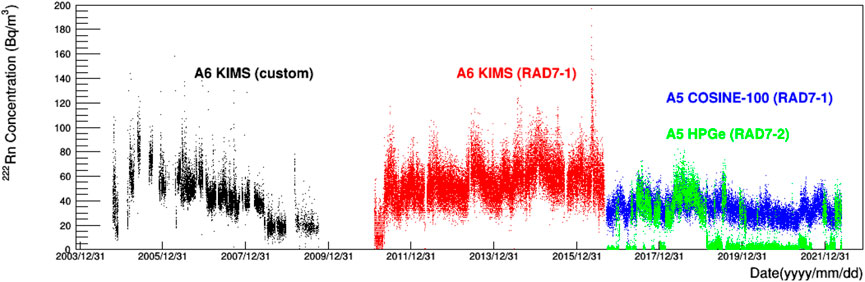
FIGURE 2. The 222Rn concentration in Y2L between 2004 and 2022 was measured in two different experimental areas. At the KIMS laboratory, the custom detector measurements were recorded between October 2004 to October 2009 (black), whereas the RAD7-1 measurements were recorded between February 2011 and September 2016 (red). The COSINE-100 room data were acquired between September 2016 and May 2022 (blue) with the same RAD7-1 counter and the HPGe room data (RAD7-2) are displayed in green marks which include data when RRS system is running. Note that only 10% of all data ditributed evenly throughout the period for the KIMS-Custom measurement is shown. Also note that A6 KIMS (custom) data is from Ref. [29] and half of A5 COSINE-100 data has been previously reported in Ref. [35].
The RAD7 detectors have been cross-calibrated at various locations and cross-checked with a separate custom-made detector, including a commercial ion chamber detector (RadonEye [37]). All these tests yielded consistent results and the RAD7 detectors did not exhibit any abnormal behavior as long as the desiccants were regularly replaced to maintain a stable humidity-level inside the chamber.
Data collection
During the 4,762 days of the total operating period between October 2004 and May 2022, radon data were acquired in three distinct periods. At the A6 lab, The KIMS custom-made detector operated for ∼5 years until October 2009. Those data are reported in Ref. [29]. After a 16 month period of no measurements, the RAD7-1 detector was installed at the same location. In September 2016, the RAD7-1 detector was moved to the A5 COSINE-100 room for data acquisition. In a similar timeframe, we operated another detector—RAD7-2 in the HPGe room at A5. Overall, the RAD7 detectors were operated continuously with a short dead times that were primarily caused by power outages in the tunnel. The analyses reported here use all of the acquired data.
The 222Rn concentration (in Becquerel per cubic meter) is displayed in Figure 2 as a function of the date for all acquired data. In particular, four distinct measurements were acquired for roughly 5 years and are correspondingly color-coded. As listed in Table 1, the average concentrations were at the level of 1 pCi/L (=37 Bq/m3) at A5, which is relatively low compared to measured levels at other underground labs without RRS operating [18–21, 25]. From late 2008 to late 2010, the temporal variations that occurred in the A6 ventilation system provided increased airflow in that area, which presumably caused lower concentration in that period. Occasional short-term spikes in the data is likely due to inadequate maintenance of the chamber air desiccant, which are replaced immediately after spike occurrence.
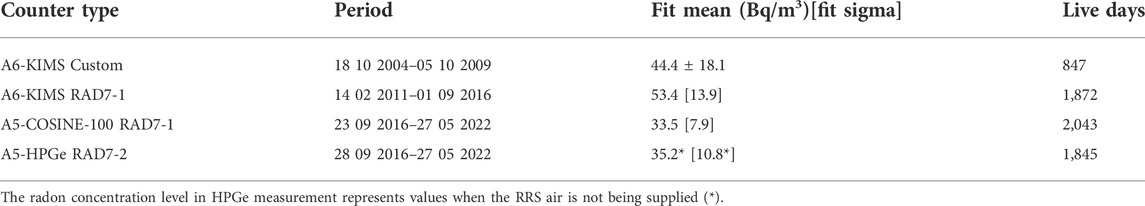
TABLE 1. The detectors and their locations are listed for all of the acquired Y2L radon data. The KIMS-Custom measurements include systematic uncertainties; those for the other measurements are only statistical uncertainties.
In the case of supplying radon-reduced air into one of the experimental rooms, the radon level sampled by the RAD7 counters is typically reduced to a few Bq/m3. The RRS air was supplied for a short period (less than a week) in the COSINE-100 room when the NaI(Tl) crystal detector installation and special maintenance occur. For the HPGe room and the AMoRE-I room, the RRS air is supplied for more often and longer time span. When the RRS air is supplied for the COSINE-100 detector room, the 222Rn level drops below the specified detection limit (4 Bq/m3) as low as 0.6 Bq/m3 and similarly for the HPGe room. When RRS is stopped, the measured concentration in RAD7-2 (HPGe) show the consistent results as the RAD-1 (COSINE-100) measurements shown in Figure 3.
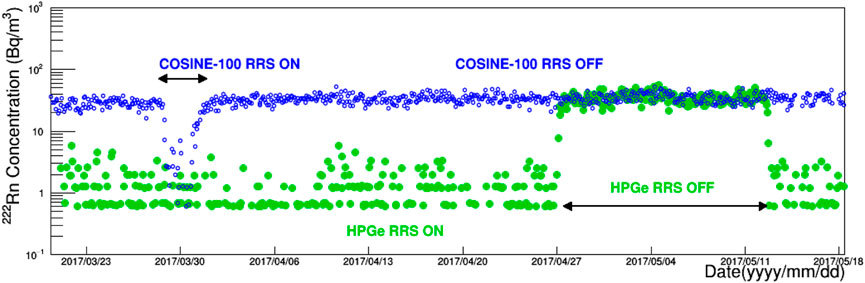
FIGURE 3. Comparison of two simultaneous A5 measurements of 222Rn concentrations. A 2-month period comparison of A5 COSINE-100 (blue circles) and A5 HPGe (green dots) measurements is shown. When RRS air is supplied for A5 COSINE-100 (RAD7-1) at around 30/03/2017, the 222Rn level drops as low as 0.6 Bq/m3. For A5 HPGe (RAD7-2), when RRS air is supplied, the level is on average 1.3 Bq/m3 with standard deviation of 1.0 Bq/m3. When RRS is stopped for 2 weeks starting from 27/04/2017, the measured concentration reaches to the level of 34.2 ± 0.6 Bq/m3 which is consistent with the A5 COSINE-100 room measurement. Note that the RAD7 detection limit is 4 Bq/m3.
The distributions of radon concentrations were fitted with a Gaussian function and the fit means and sigmas are obtained. The distributions are illustrated in Figure 4.
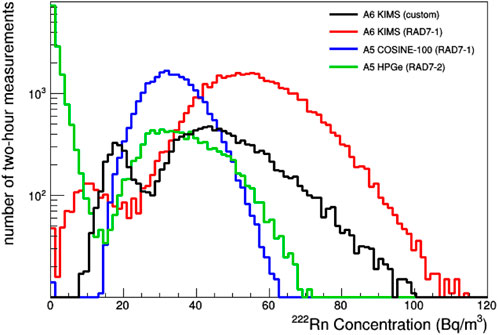
FIGURE 4. The distributions of 222Rn concentrations in the different Y2L detector rooms. Radon levels were compared among three distinct Y2L experimental areas. A Gaussian fit is performed on the A6 KIMS lab measurement (red) that has a peak value of 53.4 Bq/m3 with a width of 13.9 Bq/m3, The measurements for the A5 COSINE-100 laboratory (blue) have the fit mean of 33.5 Bq/m3 and fit width of 7.9 Bq/m3. The measurement on the A5 HPGe room (green) exhibits two peaks corresponding to measurements with and without the supply of radon-reduced air. Note that A6 KIMS (custom) measurements also have two peaks and the lower peak is due to different ventillation condition executed in the period between middle of 2008 and late 2009.
The measurement locations, detector type, periods, and measured radon concentrations are summarized in Table 1.
Results
With the acquired data, we performed analyses among the measurements in terms of their concentrations and as a function of time. The concentration measured at A5 was 33.5 Bq/m3, which was less than that of A6 by 37%. Additionally, the spread of the measurements is 7.9 Bq/m3, and much less than 13.9 Bq/m3 for A6. The lower mean and spread in A5 is likely due to the tunnel’s better air circulation and the room air is better controlled. For example, the A5 COSINE-100 detector room was not frequently accessed by personnel while many R&D activities happened in the A6 KIMS detector room.
Correlations of long-term variations in the A5 measurements with the tunnel temperatures have also been investigated. The concentrations measured at the A5 COSINE-100 and HPGe rooms were compared to each other as well as with the temperature in the A5 tunnel. The two experimental rooms are separated by a distance of approximately 35 m. When the RRS was not operating, the comparative variations in radon concentration levels were correlated and the temperature measured at A5 shows an annual variation between 22°C and 26°C as depicted in Figure 5.
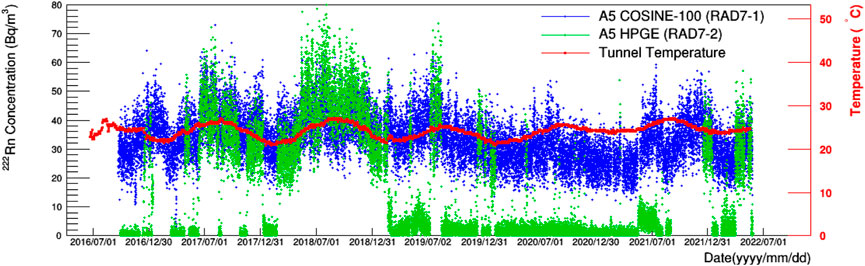
FIGURE 5. The 222Rn concentration in the HPGe room (green) and the COSINE-100 (blue), which are separated by a distance of approximately 35 m, are compared. The two detector rooms are monitored by the same model (RAD7) detector. The occasional reduction in the radon concentration level at HPGe was caused by the occasional supply of radon-free air to its detector room. For days when the RRS was off, two detector room measurements were correlated, implying that the fundamental radon activity is the same in both places. The tunnel temperature (red), independently measured outside of the detector rooms in between two rooms, is displayed with a right ordinate label.
Since the power plant company operates air circulation fans at the end of the main tunnel throughout the year, the tunnel temperature is correlated with the surface temperatures in the immediate vicinity. The 222Rn concentrations measured in the COSINE-100 and HPGe rooms are compared with the temperature inside the A5 tunnel in Figure 6. The A5 COSINE-100 (RAD7-1) radon concentration levels correlate with the tunnel temperature with a correlation coefficient of r = 0.22; the slope of a linear fit to the data was 0.9 ± 0.1 Bq/m3/°C. For the A5 HPGe (RAD7-2) levels, when RRS is off, the larger coefficient of r = 0.70 is obtained and the slope parameter was 3.8 ± 0.2 Bq/m3/°C.
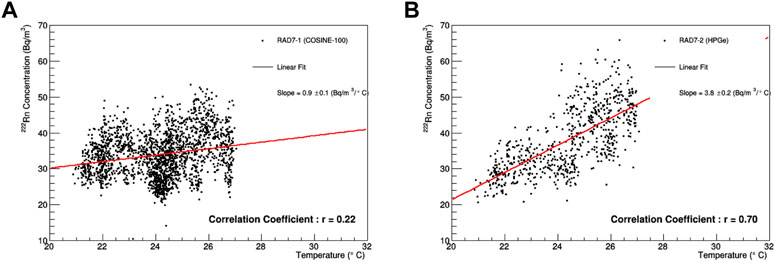
FIGURE 6. The 222Rn concentrations versus the tunnel temperature for the COSINE-100 room (A) and the HPGe room (B). A linear fit have a slope of 0.9 ± 0.1 Bq/m3/°C and the Pearson correlation coefficient is r = 0.22 for the RAD7-1 counter. For RAD7-2, the slope of 3.8 ± 0.2 Bq/m3/°C and the coefficient of r = 0.70 are measured. Note that the data analyzed here are from Figure 5 and both RAD7-1 and RAD7-2 measurements include data when RRS is off.
For the annual variation study, we applied an additional selection criterion to all of the acquired KIMS and COSINE-100 radon data that eliminated all the data prior to 11/05/2011, for which the knowledge of the ventilation conditions in the A6 tunnel was incomplete. The RAD7-2 (HPGe) data is not used in this analysis because the RRS-off data spans relatively short periods. The combined data period is from 11/05/2011 to 27/05/2022 (4,034 days in total) and the final analysis sample contains 3,822 live days, which is 95% of all the days in this period. Here, we treat 2-h RAD7 measurement as a single data point, and each daily measurement is the statistical average of the 12, 2-h measurements on that day. The daily averages were further combined into 8-day averages.
Initially, we evaluated an annual average using a period of 365.25 days, with 1st January as the starting time. After subtracting the average values, the residual concentrations for each year were obtained and combined for the entire analysis period. Then we applied a cosine fit,
to these residuals. In Eq. 1 fit, the period was fixed at 1 year (=365.25 days) and we fit for the amplitude A and phase t0 using the χ2 method. The best-fit A was −2.57 ± 0.25 Bq/m3 and the best-fit phase at the amplitude was 60.6 ± 5.6 days with χ2/NDF = 742.7/497. This corresponds to August 31 ± 6 days at the positive maximum amplitude. A constant linefit on the same data assuming no modulation shows χ2/NDF = 813.68/498. The radon concentration residuals and the results of the fit are displayed in Figure 7. With χ2 difference of 71.6 between two hypotheses, therefore, no modulation hypothesis is disfavored at more than five standard deviations. Additionally, χ2 scan over two parameters for 1, 3, and 5 standard deviations are shown in Figure 8.
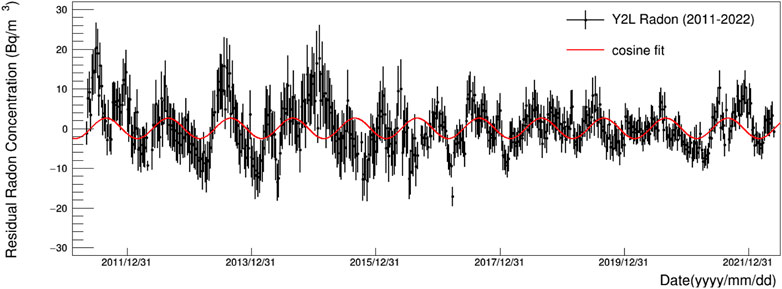
FIGURE 7. The KIMS and COSINE-100 rooms’ 222Rn concentration residuals as a function of time are fit with Eq. 1.
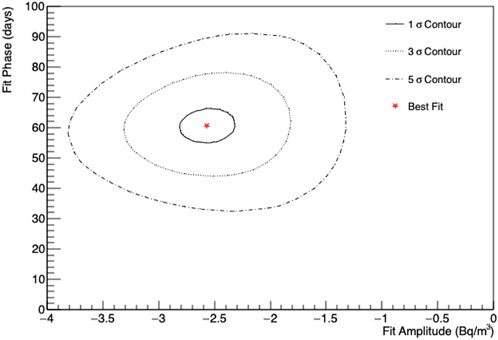
FIGURE 8. The 1, 3, and 5 standard deviations of the modulation amplitude-phase χ2 scan. The best fit position is indicated with a red star marker while three contour lines are with different styles. Zero amplitudes indicate no modulation. Days in the y-axis are counted from 1st July in the case of the negative amplitude.
For a consistency check, we performed the same fit on residual data that combine A5 and A6 data with only their average concentrations subtracted rather than subtracting the yearly residuals. This fit finds an amplitude of −2.29 ± 0.25 Bq/m3 and a phase of 55.3 ± 6.2 days, which is consistent with the yearly residual fit.
The relatively large χ2 value from the modulation best-fit has been investigated. We evaluated that the main cause is difference in the residual fluctuations between A5 and A6. The A6 measurements show a larger spread in the 222Rn measurement than that of A5. The cosine fit with only the A5 yearly residuals returns an amplitude of −2.55 ± 0.29 Bq/m3 and a phase of 55.7 ± 6.6 days with improved χ2/NDF = 346.1/258. On the other hand, the fit with A6 only data shows worse constraints with an amplitude of −2.67 ± 0.48 Bq/m3 and a phase of 73.1 ± 10.6 days with χ2/NDF = 394.0/237. We fitted the A5 temperature annual variation with Eq. 1 function plus a constant term using the least square method. We found a phase of 58.4 ± 5.2 days and an amplitude of −1.7 ± 0.2°C. The best-fit phase is consistent with the best-fit phase of the radon concentration variations.
Discussion
The seasonal variation of the radon concentration has been studied in other places with various models [38, 39]. They consider that variations of water contents in local soil facilitate radon diffusion when season changes. However, in the Yangyang area, measurements of local indoor 222Rn and soil 226Ra concentrations show weak correlations [40]. Located not far from the sea, the area is relatively windy with an average wind speed of about 2.0 m/s, providing fresh air throughout the year. Moreover, reports show a seasonal variation of indoor radon concentration in Korea with the highest in winter and the lowest in summer [41], which is opposite of the water diffusion model and what is observed in Y2L. On the other hand, the temperature dependent radon emanation from the surrounding rocks of Y2L could influence the observed radon concentration modulation. A study [42] indicates that a significant temperature change (±20°C) is needed to have a measureable effect. However, the temperature variation of the A5 branch tunnel is only ±2.0°C from the average and therefore the impact may not be substantial. Thus, we concluded that the observed radon modulation results from the temperature changes in the air caused by the ventilation system, which is affected by the season.
When the main tunnel draws warm air from outside in the summer, the air circulation in the A5 and A6 branch tunnels deteriorates because of the weak temperature gradients between the main and the branch tunnels. Conversely, in the winter, the temperature gradient is higher and the air exchanges more rapidly.
These phase of the radon concentration modulation (Maximum on 31st August) lags that of the DAMA/LIBRA signal (i.e., 2nd June). It also lags that of the measured modulation of the cosmic-ray muon rate in the COSINE-100 (27th June) by about 2 months. At the moment, the results of the COSINE-100 [43] and ANAIS [44] signals for an annual modulation in the recoil nucleus event rate are statistics-limited and, therefore, cannot be directly compared to the radon concentration and muon rate variations.
The 222Rn concentration in the air has been measured over the past 18 years in the Y2L laboratory. The average concentration is 53.4 Bq/m3 in the A6 laboratory and 33.5 Bq/m3 in the A5 laboratory and their spreads are 13.9 Bq/m3 and 7.9 Bq/m3, respectively; the latter is lower by 37% because of larger ventillation, hence faster air-exchange rate. In this analytical study, we determined that the radon concentration is correlated to the tunnel temperature. The COSINE-100 room radon concentration and tunnel temperature are correlated with the coefficient of r = 0.22 while the coefficient between the HPGe radon concentration and tunnel temperature is r = 0.70. With the selected data, the yearly residual data were fit with a cosine function and the phase of the maximum amplitude was determined to be August 31 ± 6 days, which coincides with the phase of temperature variations in the adjoining tunnel. Overall, this is one of the longest running measurements of the radon concentration in underground laboratories.
Data availability statement
The raw data supporting the conclusion of this article will be made available by the authors, without undue reservation.
Author contributions
CH contributed to the conception and design of the study. SK, YK, and HL built the underground spaces and detectors. CH, WK, KK, MHL, KS, and MJL collected raw datasets. JK, YJ, and YL organized the database and provided a drawing of Y2L. CH performed the statistical analysis. CH wrote the first draft of the manuscript. All authors contributed to manuscript revision, read, and approved the submitted version.
Funding
This research was supported by the Chung-Ang University Graduate Research Scholarship in 2022 and by the National Research Foundation of Korea (NRF) grant funded by the Korean government (MSIT) (No. 2021R1A2C1013761).
Acknowledgments
We thank the Korea Hydro and Nuclear Power (KHNP) Company for providing the underground laboratory space at Yangyang.
Conflict of interest
The authors declare that the research was conducted in the absence of any commercial or financial relationships that could be construed as a potential conflict of interest.
Publisher’s note
All claims expressed in this article are solely those of the authors and do not necessarily represent those of their affiliated organizations, or those of the publisher, the editors and the reviewers. Any product that may be evaluated in this article, or claim that may be made by its manufacturer, is not guaranteed or endorsed by the publisher.
Footnotes
1Since 2015, Ateko system (www.ateko.cz) has been operating at A5.
References
1. Zwicky F. On the masses of nebulae and of clusters of nebulae. ApJ (1937) 86:217. doi:10.1086/143864
2. Aghanim N, Akrami Y, Ashdown M, Aumont J, Baccigalupi C, Ballardini M, et al. Planck 2018 results. VI. Cosmological parameters. Astron Astrophys (2020) 641:A6. [Erratum:Astron.Astrophys. 652, C4 (2021)].
3. Zyla PA, Barnett RM, Beringer J, Dahl O, Dwyer DA, Groom DE, et al. Review of particle physics. PTEP (2022) 2022:083C01. doi:10.1093/ptep/ptaa104
4. Lee BW, Weinberg S. Cosmological lower bound on heavy neutrino masses. Phys Rev Lett (1977) 39:165–8. doi:10.1103/physrevlett.39.165
5. Schumann M. Direct detection of WIMP dark matter: Concepts and status. J Phys G: Nucl Part Phys (2019) 46:103003. doi:10.1088/1361-6471/ab2ea5
6. Gaskins JM. A review of indirect searches for particle dark matter. Contemp Phys (2016) 57:496–525. doi:10.1080/00107514.2016.1175160
7. Kahlhoefer F. Review of LHC dark matter searches. Int J Mod Phys A (2017) 32:1730006. doi:10.1142/s0217751x1730006x
8. Aprile E, Aalbers J, Agostini F, Alfonsi M, Althueser L, Amaro FD, et al. Dark matter search results from a one ton-year exposure of XENON1T. Phys Rev Lett (2018) 121:111302. doi:10.1103/PhysRevLett.121.111302
9. Aalbers J, Akerib DS, Akerlof CW, Al Musalhi AK, Alder F, Alqahtani A, et al. First dark matter search results from the LUX-ZEPLIN (LZ) experiment (2022). arXiv:2207.03764.
10. Bernabei R, Belli P, Bussolotti A, Cappella F, Caracciolo V, Cerulli R, et al. First model independent results from DAMA/LIBRA-phase2. Nucl Phys Energ (2018) 19:307–25. doi:10.15407/jnpae2018.04.307
11. Bernabei R, Belli P, Bussolotti A, Caracciolo V, Cappella F, Cerulli R, et al. Further results from DAMA/Libra-phase2 and perspectives. Nucl Phys Energ (2021) 22:329–42. doi:10.15407/jnpae2021.04.329
12. Freese K, Lisanti M, Savage C. Colloquium: Annual modulation of dark matter. Rev Mod Phys (2013) 85:1561–81. doi:10.1103/revmodphys.85.1561
13. Davis JH. Fitting the annual modulation in DAMA with neutrons from muons and neutrinos. Phys Rev Lett (2014) 113:081302. doi:10.1103/physrevlett.113.081302
15. Tiwari A, Zhang C, Mei DM, Cushman P. Observation of annual modulation induced by γ rays from ( α, γ ) reactions at the Soudan Underground Laboratory. Phys Rev C (2017) 96:044609. [Erratum: Phys.Rev.C 98, 019901 10.1103/physrevc.96.044609(2018)].
16. Adamson P. Comparisons of annual modulations in MINOS with the event rate modulation in CoGeNT. Phys Rev D (2013) 87:032005. doi:10.1103/PhysRevD.87.032005
18. Pronost G, Ikeda M, Nakamura T, Sekiya H, Tasaka S. Development of new radon monitoring systems in the Kamioka mine. PTEP (2018) 2018:093H01.
19. Liu C, Ma H, Zeng Z, Cheng J, Li J, Zhang H. Measurements of radon concentrations using CR-39 detectors in China JinPing underground laboratory (2015-2016) (2018). arXiv:1806.06567.
20. Pérez-Pérez J, Amare JC, Bandac IC, Bayo A, Borjabad-Sanchez S, Calvo-Mozota JM, et al. Radon mitigation applications at the Laboratorio Subterráneo de Canfranc (LSC). Universe (2022) 8:112. doi:10.3390/universe8020112
21. Hodák R, Perrot F, Brudanin V, Busto J, Havelcova M, Hulka J, et al. Characterization and long-term performance of the radon trapping facility operating at the modane underground laboratory. J Phys G: Nucl Part Phys (2019) 46:115105. doi:10.1088/1361-6471/ab368e
22. Murra M, Schulte D, Huhmann C, Weinheimer C. Design, construction and commissioning of a high-flow radon removal system for XENONnT (2022). arXiv:2205.11492.
23. Aprile E, Aalbers J, Agostini F, Alfonsi M, Althueser L, Amaro FD, et al. 222Rn emanation measurements for the XENON1T experiment. Eur Phys J C (2021) 81:337.
24. Aprile E, Abe K, Agostini F, Ahmed Maouloud S, Alfonsi M, Althueser L, et al. Material radiopurity control in the XENONnT experiment. Eur Phys J C (2022) 82:599. doi:10.1140/epjc/s10052-022-10345-6
25. Amaré J, Bandac I, Blancas A, Borjabad S, Buisán S, Cebrián S, et al. Long term measurement of the 222Rn concentration in the Canfranc underground laboratory (2022). arXiv:2203.13978.
26. Prihtiadi H, Adhikari G, Adhikari P, de Souza EB, Carlin N, Choi S, et al. Muon detector for the COSINE-100 experiment. J Instrum (2018) 13:T02007. doi:10.1088/1748-0221/13/02/t02007
27. Prihtiadi H, Adhikari G, de Souza EB, Carlin N, Choi J, Choi S, et al. Measurement of the cosmic muon annual and diurnal flux variation with the COSINE-100 detector. J Cosmol Astropart Phys (2021) 02:013. doi:10.1088/1475-7516/2021/02/013
28. Zhu JJ, Kang KJ, Li YJ, Li J, Kwak JW, Bhang H, et al. Study on the muon background in the underground laboratory of KIMS. High Energ Phys Nucl Phys (2005) 29:721.
29. Lee M, Bhang HC, Kim SC, Kim SK, Lee SJ, Li J, et al. Radon environment in the Korea invisible mass search experiment and its measurement. J Korean Phys Soc (2011) 57:713–8. doi:10.3938/jkps.58.713
30. Lee HS, Bhang H, Choi J, Hahn I, He D, Hwang M, et al. First limit on WIMP cross section with low background CsI(Tℓ) crystal detector. Phys Lett B (2006) 633:201–8. doi:10.1016/j.physletb.2005.12.035
31. Adhikari G, Adhikari P, Barbosa de Souza E, Carlin N, Choi S, Choi WQ, et al. Initial performance of the COSINE-100 experiment. Eur Phys J C (2018) 78:107. doi:10.1140/epjc/s10052-018-5590-x
32. Adhikari G, Adhikari P, Barbosa de Souza E, Carlin N, Choi S, Djamal M, et al. Author Correction: An experiment to search for dark-matter interactions using sodium iodide detectors. Nature (2018) 564:83–6. [Erratum: Nature 566, E2 (2019)]. doi:10.1038/s41586-019-0890-3
33. Alenkov V, Bae HW, Beyer J, Boiko RS, Boonin K, Buzanov O, et al. First Results from the AMoRE-Pilot neutrinoless double beta decay experiment. Eur Phys J C (2019) 79:791. doi:10.1140/epjc/s10052-019-7279-1
34. Leonard DS, Hahn K, Kang W, Kazalov V, Kim G, Kim Y, et al. Development of an array of fourteen HPGe detectors having 70% relative efficiency each. Nucl Instr Methods Phys Res Section A: Acc Spectrometers Detectors Associated Equipment (2021) 989:164954. doi:10.1016/j.nima.2020.164954
35. Kim H, Adhikari G, Barbosa de Souza E, Carlin N, Choi J, Choi S, et al. The environmental monitoring system at the COSINE-100 experiment. J Instrum (2022) 17:T01001. doi:10.1088/1748-0221/17/01/t01001
36.[Dataset] Durridge. Durridge RAD7 radon detector (2022). Available from: https://durridge.com/products/rad7-radon-detector (Accessed May 1st, 2022).
37.[Dataset] RadonEye. RadonEye RD200 radon detector (2022). Available from: http://radoneye.com/ (Accessed May 1st, 2022).
38. Wojcik M, Zuzel G, Simgen H. Review of high-sensitivity Radon studies. Int J Mod Phys A (2017) 32:1743004. doi:10.1142/s0217751x17430047
39. Arvela H, Holmgren O, Hanninen P. Effect of soil moisture on seasonal variation in indoor radon concentration: Modelling and measurements in 326 Finnish houses Radiat Prot Dosimetry (2016) 168:277–90. doi:10.1093/rpd/ncv182
40. Kim Y, Lee H, Kim C, Chang B, Rho B, Kim C, et al. Indoor radon, thoron, and thoron daughter concentrations in Korea. Int Congress Ser (2005) 1276:46–9. doi:10.1016/j.ics.2004.11.161
41. Kim CK, Lee SC, Lee DM, Chang BU, Rho BH, Kang HD. Nationwide survey of radon levels in Korea. Health Phys (2003) 84:354–60. doi:10.1097/00004032-200303000-00008
42. Sakoda A, Ishimori Y. Calculation of temperature dependence of radon emanation due to alpha recoil. J Radioanal Nucl Chem (2014) 299:2013–7. doi:10.1007/s10967-013-2869-0
43. Adhikari G, Barbosa de Souza E, Carlin N, Choi J, Choi S, Ezeribe A, et al. Three-year annual modulation search with cosine-100. Phys Rev D (2022) 106:052005. doi:10.1103/physrevd.106.052005
Keywords: radon, dark matter, annual modulation, underground radioactivity, WIMP
Citation: Ha C, Jeong Y, Kang WG, Kim J, Kim KW, Kim SK, Kim YD, Lee HS, Lee MH, Lee MJ, Lee YJ and Seo KM (2022) Radon concentration variations at the Yangyang underground laboratory. Front. Phys. 10:1030024. doi: 10.3389/fphy.2022.1030024
Received: 28 August 2022; Accepted: 25 October 2022;
Published: 08 November 2022.
Edited by:
Paola Ferrario, Donostia International Physics Center (DIPC), SpainReviewed by:
Susana Cebrian Guajardo, University of Zaragoza, SpainJoaquim Palacio Navarro, Laboratorio Subterráneo de Canfranc, Spain
Grzegorz Zuzel, Jagiellonian University, Poland
Copyright © 2022 Ha, Jeong, Kang, Kim, Kim, Kim, Kim, Lee, Lee, Lee, Lee and Seo. This is an open-access article distributed under the terms of the Creative Commons Attribution License (CC BY). The use, distribution or reproduction in other forums is permitted, provided the original author(s) and the copyright owner(s) are credited and that the original publication in this journal is cited, in accordance with accepted academic practice. No use, distribution or reproduction is permitted which does not comply with these terms.
*Correspondence: C. Ha, Y2hoYUBjYXUuYWMua3I=