 Jing Zhao
 Yanfeng He
 Jun Yang
- School of Petroleum and Natural Gas Engineering, Changzhou University, Changzhou, Jiangsu, China
Foam has been used as an effective displacing fluid for gas mobility control in enhanced oil recovery (EOR) and subsurface remediation. In this study, a series of core flooding experiments are performed on cores with a wide permeability ranging from 3.3 to 2749 mD to evaluate the impact of foam quality and permeability on foam performance. It is found that the steady-state foam mobility control factor is related to permeability in a non-linear, non-monotonic manner. A full physics, mechanistic foam model is proposed by incorporating a novel flowing foam fraction relation grounded-up from pore-level observations, and a new kinetic expression of foam coalescence rate by oil based on pinch-off foam rupture mechanism into the population-balance framework of Almajid et al. (Advances in Water Resources, 2021, 150: 103877). The proposed model is applied to match foam flow experimental results in the absence and in the presence of oil. Results show that our model captures the high-quality and low-quality foam regimes observed in previous oil-free foam flow experiments. Within the medium permeability range, in the absence of oil, lower gas mobility is observed in the lower permeability core due to faster foam film thinning at higher capillary pressure, while in the presence of residual oil, the difference in foam mobility fades away due to the insignificant impact of capillary pressure on the stability of pseudoemulsion films.
1 Introduction
The substantial increase in CO2 emissions due to the increase in fossil fuel energy consumption leads to global climate warming [1, 2]. CO2 enhanced oil recovery (EOR), a promising technology to promote geological sequestration of CO2 in oil reservoirs, has gained the spotlight in reducing carbon emissions. However, CO2-EOR processes often suffer from severe viscous fingering and gas channeling, thereby CO2 mobility control techniques are required to improve sweep efficiency. Foam fluids have been used for decades to control gas mobility due to its peculiar rheology and low environmental pollution. Understanding foam propagation characterises in porous media is of primary importance for CO2-EOR processes optimization. Steps have been taken in this direction by previous authors [3–6]. It is recognized that foam mobility is directly dependent on the correlation between foam texture (i.e., number density of foam bubbles per unit volume) and medium permeability. Tsau and Heller [7] performed foam flow experiments with core permeabilities ranging from 30 to 900 mD and found foam mobility presents a linear relationship with core permeability in a log-log coordination. Zhao et al. [8] analyzed the foam flow phenomenology in porous media, including foam preferential flow path, local flow intermittency, and addressed that the correlation between bubble size and local permeability of the medium should be taken into account in large-scale mechanistic model development. However, at this point, most previous studies focused on limited range of permeability (>100 mD), and therefore some notably features of foam flow remain unclear. In this study, we set out to investigate foam behavior within a comprehensive permeability range (i.e., 3.3∼2749 mD).
A popular choice of modeling foam propagation in porous media is population balance models (PBM) [9, 13, 14]. Typical foam PBMs tracks foam texture over time and tend to separate gas mobility into the effects of gas trapping and rheology. These models concentrated primarily on predicting transient and steady-state foam flow characteristics in oil-free media. However, foam physics is even more complicated when oil is involved. Previous authors showed that the prevalent classical entering (E), spreading (S), and bridging (B) coefficients Eqs. 1–3 cannot consistently predict the behavior of oil droplets at gas-water interface, thereby cannot accurately predict foam stability in the presence of oil; foam stability is essentially dependent on the stability of pseudoemulsion film (i.e., the asymmetrical aqueous film between oil and gas) [10].
Where σ denotes the interfacial tension, and the subscripts g, w, and o are gas, water, and oil, respectively. In recognition of this, in the pioneering work by Myers and Radke [9], a kinetic expression of the rate of foam coalescence by oil is derived based on the concept of pseudoemulsion film and is incorporated in the general population balance framework to elucidate foam behavior the presence of residual oil. Their model shows that foam is destabilized by oil and foam mobility is lower in higher permeability core whether or not the residual oil is present. In fact, the macroscopic foam flow processes can only be adequately simulated given that the values or functional relations of model parameters, such as flowing foam fraction (i.e., the ratio of flowing gas saturation to total gas saturation), foam generation rate and foam coalescence rate, are known [11]. Although many attempts have been made by previous authors on the modification of flowing foam fraction [12, 13], it is still not fully consistent with the experimental and statistics pore network results. Therefore, another motivation of the present work is to develop a full physics, mechanistic PBM for foam flow in porous media by inserting more meaningful mechanistic expressions for gas mobility and foam coalescence rate caused by oil.
In a summary, a series of core flooding experiments is performed in cores with permeabilities ranging from 3.3 to 2749 mD in the absence and in the presence of residual oil. The impact of foam quality and core permeability on foam mobility are examined. A foam population balance model based on a new flowing foam fraction relation which is more physical to foam flow in porous media, and a new expression of the rate of foam coalescence by oil, is proposed. The proposed model is evaluated by core flooding results in terms of aqueous phase saturation and pressure drop profiles. The results find application to the design of CO2 foam EOR and environmental remediation.
2 Materials and methods
2.1 Experiment
2.1.1 Materials
The formation water is prepared with distilled water with a total salinity of 26,500 mg/L using sodium, calcium, magnesium and chloride ions. CO2 with a purity of 99.9% is used to generate foam in core flooding experiments. The surfactant solution is a mixture of 0.5 wt% internal olefin sulfonate (IOS) and 0.5 wt% lauryl betaine (LB) in a 1:1 ratio. The crude oil sample is collected from an oil field in XinJiang province, and is centrifuged at 2000 rpm for 9 h to remove any solids and contaminations. The viscosity and density of crude oil are 10 cP and 0.82 g/cm3, respectively. Four types of artificial cores are compressed under high pressure using minerals (i.e., quartz, kaolinite, illite, and calacite) with different concentrations. The permeabilities of artificial cores are 3.3, 55, 425, 1,580, and 2749 mD, respectively. All cores have a length and diameter of 50.16 and 3.5 cm. In order to avoid moisture, the cores are dried in the oven for 6 h at constant temperature of 110°C and then vacuumed before each test [14].
2.1.2 Experimental procedures
During oil-free foam flow experiments, the core is pre-saturated with brine. Two pore volume (PV) of brine and CO2 are co-injected into the core using an ISCO 500D syringe pump and a gas mass flow controller (Brooks, United States) at varying flowrates. After that, CO2 and surfactant solution are injected into the core simultaneously at varying foam qualities (fg = (qg× 100%)/(qg + ql), where qg and ql are gas and liquid flowrates, respectively) until the pressure difference across the core reaches a steady-state.
For model validation, the procedures of oil-free foam flow experiments are similar to those stated above, except that CO2 and surfactant solution are co-injected at a foam quality of 80% from the very beginning. In the presence of oil, the core is pre-saturated with the crude oil. 2 PV of brine is first injected, followed by co-injecting of surfactant solution and CO2 at a foam quality of 80%. The total injection rate for all experiments is 0.1 cm3/min, unless otherwise indicated. Six pressure taps are placed evenly (about 10 cm apart) to monitor the pressure evolution along the core sample. A back pressure regulator (BPR) is set at 3.0 MPa to control the pressure at core downstream (Figure 1). All experiments are performed at ambient temperature and pressure (Tamb = 22°C, Pamb = 1.0 atm).
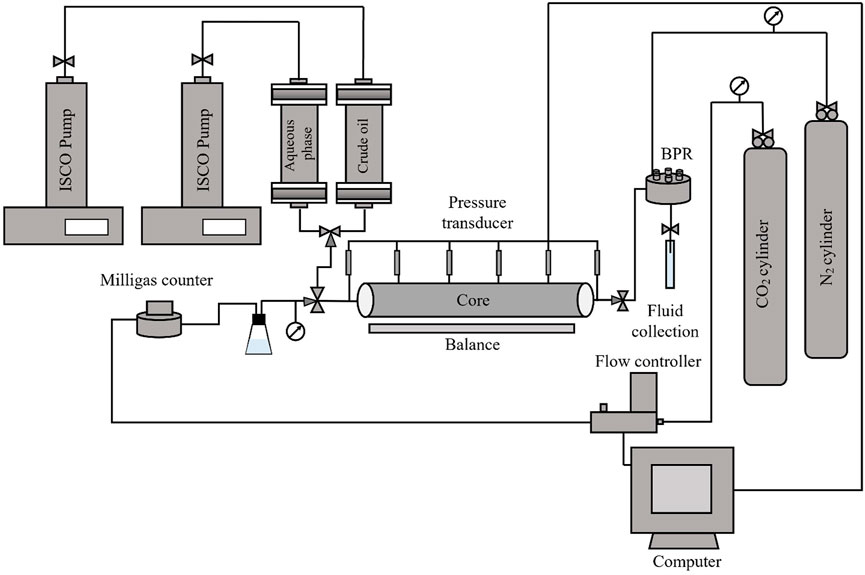
FIGURE 1. Schematic of foam flow experimental setup.
2.2 Model development
In 1-D porous media, the mass balance of flowing bubble density can be described by [15],
where Sg is the gas saturation, and subscripts f and t are the flowing and trapped gas, respectively. φ is porosity, uf is the Darcy velocity, Qb is a source/sink term of foam bubbles. rg and rc denote foam generation rate and foam coalescence rate. The competition of rg and rc governs the evolution of foam texture, and hence the mobility control ability of foam. The kinetic expressions of rg and rc are given as [1, 26]
where
where
where Cs is the surfactant concentration, Cs* is a reference surfactant concentration for strong foam generation (Cs* is set at 0.1 wt% throughout this paper), and
Phase mobilities are described by the standard Darcy’s law,
where K is the absolute permeability of the porous media. kri is the relative permeability to phase i, µi, pi and ρi are the viscosity, pressure and density of phase i. g and z denote the gravitational constant and depth.
The gas apparent viscosity (µf) is given by,
where µg is the gas viscosity, α is a constant dependent on the surfactant system. c is a power point exponent close to 1/3.
As indicated by Chen et al. [17], during the flow of a fluid with yield stress (i.e., Bingham fluid), the fraction of pores belonging to the open paths is strongly dependent on the applied pressure gradient. Considering the fact that in the flow of foam in porous media is essentially analogous to that of a Bingham fluid, we borrow from Chen et al. [17], and found a S shape change in flowing foam fraction (Xf = Sgf/Sg) with pressure gradient [18]. Therefore, instead of following the previous PBMs by reflecting the dependence of Xf on the trapped foam texture i.e., Xf = 1-Xt = 1-
where Ψ is a constant of proportionality, and b is a percolation exponent which equals to 0.4 in this study.
As indicated previously, additional complications arise when oil is involved. In the presence of residual oil, foam stability strongly depends on the stability of pseudoemulsion film. Under this circumstance, oil exists in two forms, i.e., emulsified oil and solubilized oil. It is known that surfactant micelles containing solubilized oil is detrimental to foam film stability [20]. However, considering that the amount of solubilized oil is negligible compared with that of emulsified oil, we here only focus on the impact of emulsified oil. Therefore, foam coalescence rate by oil (rco) is given by [9],
where So is oil saturation, є is a constant, Pcpf denotes imposed capillary pressure, and Pcpf* is the critical rupture capillary pressure of the pseudoemulsion film [20].
where σow and σgw are set as 6 and 31 mN/m uw and ug are set 1.0, and 0.018 mPa·s throughout this study.
3 Results and discussions
3.1 Oil-free core flooding experiments
A series of core flooding tests in the absence of oil are performed on the core with the permeability of 55 mD. As seen, a critical foam quality (fg* = 66.7%) exists in Figure 2A: in the upper left portion where fg > fg*, the steady-state pressure gradient (∇Pss) is only dependent on the liquid velocity (i.e., high-quality regime), while in the lower right portion where fg < fg*, ∇Pss is only sensitive to gas velocity (i.e., low-quality regime). This phenomenon agrees well with previous experimental observation of Almajid et al. [1] and Osterloh and Jante [21]. The dots in Figure 2A are acquired from the core flooding experiment. The experiment consists of surfactant solution and CO2 co-injection at different injection velocities from 0.5 to 2.8 m/day, one of which is kept constant while the other changes for evaluation. Clearly, the agreement obtained between experimental and simulation results is quite good within the range of injection velocities investigated. Figure 2B presents the microscopic images of morphology of the produced foam bubbles produced and the corresponding bubble size distribution histograms at different injection conditions. It is seen that when ug and ul of 0.5 and 2.5 m/day (within Region I) are imposed, foam with small average bubble size (≈0.26 mm2) is generated, while when ug and ul of 1.0 and 0.8 m/day (within Region II) are imposed, foam with much larger average bubble size (≈1.08 mm2) is generated, which further proves that Regions I and II correspond to high-quality foam (or, equivalently, strong foam) and low-quality foam (weak foam), respectively. This result implies that foam mobility control performance is better at a lower liquid but larger gas velocity.
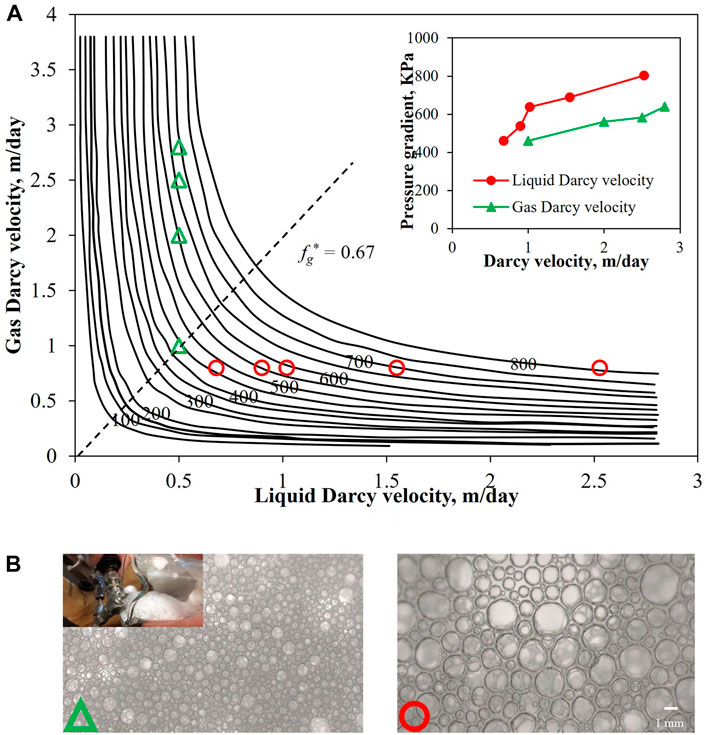
FIGURE 2. (A) Predicted (solid line) and measured (dots) steady-state pressure gradient as a function of gas and liquid Darcy velocities in the core with the permeability of 55 mD. Red dots are measured by varying the liquid velocity from 0.68 to 2.52 m/day at constant gas velocity of 0.8 m/day, and green dots are measured by varying the gas velocity from 1.0 to 1.75 m/day at constant liquid velocity of 0.5 m/day. (B) Optical micrographs of foam collected at the outlet of core at gas and liquid velocity of 0.5 and 2.5 m/day (left), 1.0 and 0.8 m/day (right), respectively.
Figure 3A illustrates evolution of pressure difference over the course of core flooding experiments in cores with permeabilities of 3.3 and 425 mD. The fluctuating pressure drop is attributed to the oscillatory or chaotic nature of foam flow and the core heterogeneity. It can be seen that in the first stage when CO2 and brine are co-injected, the incremental in pressure gradient is small, indicating weak blocking effect, while in the second stage when foam is participated, the pressure gradient increases significantly. This phenomenon is attributed to Jamin effect; when foam propagates along the core, foam bubbles deform and produce additional resistance, thereby greater pressure drop is required to initiate and keep foam flowing. Similar trend is observed in the profiles of gas saturation during flooding in cores (Figures 3Bi). During CO2 and brine co-injection, the gas saturation rises slowly and reaches a plateau value of around 10% for all tests. When foam injection starts, however, the gas saturation increases noticeably due to the formation of strong foam (more effective gas trapping). Meanwhile, it is noted that in the same core, the pressure gradient at the end of foam injection is the highest at fg = 66.7% (rather than at fg = 80% which possesses the highest gas fraction). If we look deeper, the complex interplay between flowrate and foam texture determines the blocking effect of foam [2]. Foam texture (the number of foam lamellae per unit volume of gas in porous media) is in fact very low at extremely high fg (e.g., fg = 80%). Therefore, an optimal fg that well balances the relationship between flowrate and foam texture must exist, which is 66.7% in this study. Also, only the pressure difference at fg = 20% reaches a steady-state, while the rest are unstable by the end of foam injection. A possible explanation is that at fg = 20% (i.e., weak foam), most of gas is flowing as a continuous phase, and therefore, after initial pressure incremental induced by foam generation, foam lamellae creation and destruction balance with each other within a shorter period of time.
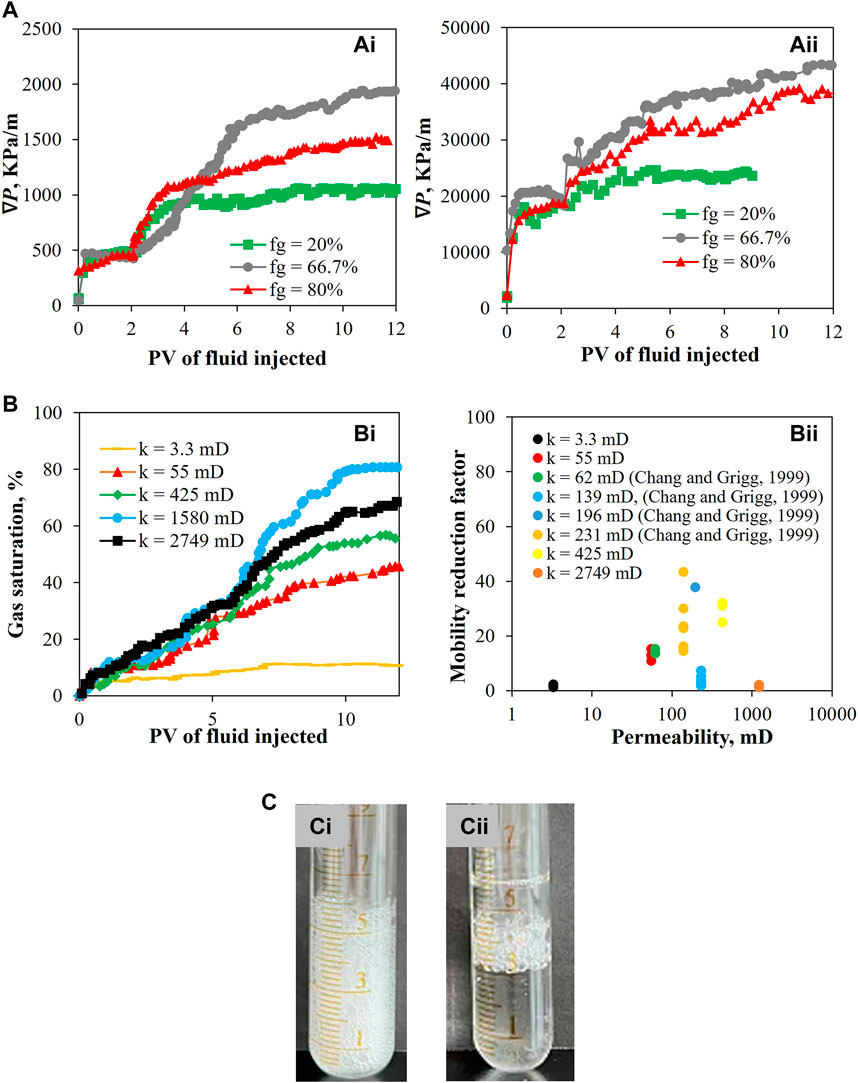
FIGURE 3. (A) Pressure difference evolution over the course of core flooding experiments in cores with permeabilities of (Ai) 3.3 mD, and (Aii) 425 mD, respectively. (Bi) Gas saturation evolution for foam flow experiments with different core permeabilities. (Bii) Steady-state mobility reduction factor for foam flow experiments with different core permeabilities obtained in the current work and previous work of Chang and Grigg [24]. (C) Foam produced at the outlet of cores with permeability of (Ci) 425 mD, and (Cii) 2749 mD, respectively.
Foam blocking ability is characterized by mobility reduction factor (MRF = ΔPf/ΔPCO2+brine, where ΔPf and ΔPCO2+brine denote the pressure differences along the core during foam flooding and CO2-brine co-injection) [22]. Figure 3Bii shows the steady-state MRF in core permeabilities ranging from 3.3 to 1,580 mD. It is seen that MRF demonstrates a nonlinear, non-monotonic function of core permeability, i.e., MRF first rises distinctly with permeability in the low-medium permeability range, and then decreases in the high permeability range, which is in consistent with the gas saturation results shown in Figure 3Bi. Foam mobility control ability is essentially related to Jamin effect, and thus to the underlying pore space characteristics. When foam flows along the core whose channels are much smaller than the bubble size (i.e., low permeability cores), foam lamellae are sporadically generated, thereby only a small fraction of gas is trapped [23]. Moreover, the high local capillary pressure in low permeability media accelerates the thinning process of the existing foam lamellae; the gas trapping becomes even less effective, which consequently results in low MRF and gas saturation in low core permeability. When foam flows along the core whose channels are larger than the bubble size (i.e., high permeability cores), the flow of foam involves weaker bubble deformation (or, lower pressure difference), and thus foam tends to completely flow through the main channels instead of occupying them, which also results in low MRF and gas saturation. High permeability cores possess low pressure condition, and hence the pore space is occupied by enlarged bubbles due to gas compressibility, resulting in lower gas saturation (Figure 3Bi), This is further proved by the much coarser bubbles collected at the core outlet at k = 2749 mD (Figure 3Cii).
3.2 Foam flow characteristics in the absence and in the presence of residual oil
We simulate the foam flow process in cores with the permeabilities of 425 and 1,580 mD in the absence and in the presence of residual oil, respectively. The parameters used in oil-free cases for lower permeability core (k = 425 mD) are
Figure 4A shows the measured and simulated aqueous phase saturation (Sw) and pressure drop (ΔP) profiles. It is seen that in both cores, the gas phase initially advances through the core quickly, leading to the drainage of a considerable amount of liquid. A dramatic decrease in Sw is observed when the front arrives at a dimensionless distance of approximately 0.3, indicating the generation of strong foam; the generation of strong foam accompanies with more trapped gas in pore space, significantly reduced gas mobility, and more liquid displaced from additional pores. The model indeed predicts slightly slower front advancement. This may be attributed to the viscous instabilities or gas override, which are not accounted for in the present model. It is worthwhile noticing that in Myers and Radke’s [9] model, the simulated aqueous phase saturation in the entrance region is normally underestimated due to the overprediction of foam bubble density. However, as pointed by Chen et al. [25], the entry length for net foam generation is approximately 12 cm, indicating that strong foam has not been generated in the entrance region; very small amount of gas is trapped in the core at the initial stage of displacement. Our model successfully captures this feature and predict the location where strong foam starts to form.
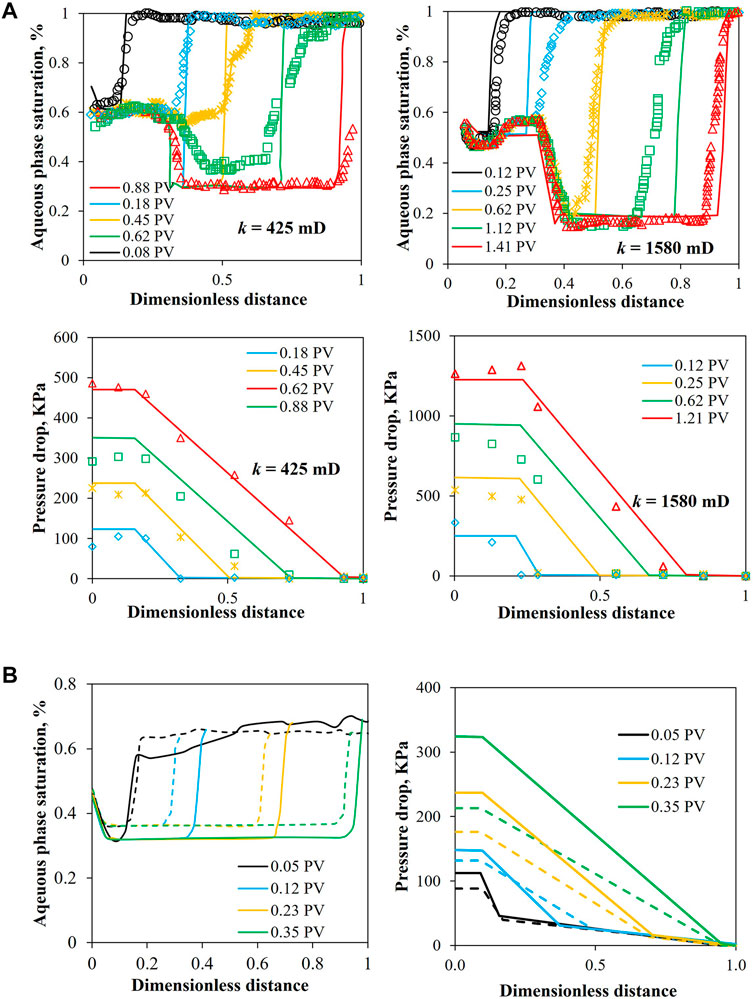
FIGURE 4. (A) Up: measured and predicted aqueous phase saturation profiles for oil-free foam flow in cores with permeabilities of 425 and 1,580 mD. Down: measured and predicted pressure drop profiles for oil-free foam flow in cores with permeabilities of 425 and 1,580 mD. (B) Predicted aqueous phase saturation profile and pressure drop profile in cores with permeabilities of 425 (dashed lines) and 1,580 mD (dotted lines) in the presence of residual oil.
Figure 4B shows the simulated aqueous phase saturation and pressure drop profiles during foam flooding after 2 PV of brine injection. The residual oil saturations after brine injection are similar (∼40% OOIP) for both cores. It is seen that the aqueous phase saturation profiles in the presence of oil are in general less sharper than those in the absence of oil, demonstrating less efficient water displacement. The pressure drop in the lower permeability core (k = 425 mD) is obviously lower than that in the higher core (k = 1,580 mD), while in the absence of oil, on the contrary, the pressure drop in two cores is similar. In the absence of oil, the pressure drop depends on the stability of individual foam films; larger capillary pressure in lower permeability core results in faster foam film thinning, coarser foam texture, and consequently in lower pressure drop. In the presence of oil, the pressure drop depends on the stability of individual pseudoemulsion films. An additional parameter, foam coalescence rate due to oil Eq. 11 is included in the PBM of Almajid et al. [1] to signify pseudoemulsion film stability [25–27]. The properties of surfactant solution and oil used here result in positive E and S coefficients, and hence in a Pcpf/Pcpf* value larger than one; the vast majority of pseudoemulsion films already rupture under this condition. Therefore, capillary pressure has insignificant impact on pseudoemulsion film stability, leading to similar pressure drop.
4 Conclusion
1) In the absence of oil, two distinct foam flow regimes: High-quality and low-quality regimes, are observed. At the core permeability of 55 mD, the critical foam quality (fg*) at which the transition of foam regime occurs is around 66.7%. Foam mobility in porous media is non-monotonically related to core permeability: At low-medium permeability range, foam mobility increases with permeability, while at high permeability range, foam mobility decreases significantly with permeability.
2) A mechanistic, full-physics foam population balance model is proposed based on a new flowing foam fraction and a kinetic expression of foam coalescence due to oil. In the absence of oil, agreement between experiment and simulation in cores with permeabilities of 425 and 1,580 mD is satisfactory in terms of aqueous phase saturation and pressure drop profiles. The small discrepancies are probability attributed to the ignorance of viscous instabilities in the current model. The location where strong foam starts to generate is at the dimensionless distance of approximately 0.3 for both cores.
3) In the absence of residual oil, the pressure drop is lower in lower permeability core due to the faster foam film thinning under higher capillary pressure. In the presence of residual oil, the pressure drop in both cores is similar. A possible explanation is that majority of pseudoemulsion films already rupture within the permeability range investigated, thereby the impact of capillary pressure on foam film rupture is insignificant.
Data availability statement
The original contributions presented in the study are included in the article/supplementary material, further inquiries can be directed to the corresponding author.
Author contributions
JZ: Formal analysis, Writing-original draft preparation, Writing-review and editing, Funding, JY: Methodology, Conceptualization, Drawing figures, YH: Methodology, Conceptualization, Project administration, Supervision, Funding acquisition.
Funding
The authors declare that this research is supported by National Natural Science Foundation of China (No. 52004038).
Conflict of interest
The authors declare that the research was conducted in the absence of any commercial or financial relationships that could be construed as a potential conflict of interest.
Publisher’s note
All claims expressed in this article are solely those of the authors and do not necessarily represent those of their affiliated organizations, or those of the publisher, the editors and the reviewers. Any product that may be evaluated in this article, or claim that may be made by its manufacturer, is not guaranteed or endorsed by the publisher.
Abbreviations
References
1. Almajid MM, Wong ZY, Kovscek AR. Mechanistic foam flow model with variable flowing foam fraction and its implementation using automatic differentiation. Adv Water Resour (2021) 150:103877. doi:10.1016/j.advwatres.2021.103877
2. Géraud B, Jones SA, Cantat I, Dollet B, Méheust Y. The flow of a foam in a two-dimensional porous medium. Water Resour Res (2016) 52:773–90. doi:10.1002/2015wr017936
3. Zhang K, Li S, Liu L. Optimized foam-assisted CO2 enhanced oil recovery technology in tight oil reservoirs. Fuel (2020) 267:117099. doi:10.1016/j.fuel.2020.117099
4. Fu WQ, Yu J, Xu YH, Wang CL, Huang BX, Sun BJ. A pressure drop prediction model for hydrate slurry based on energy dissipation under laminar flow condition. SPE J (2022) 27(04):2257–67. doi:10.2118/209586-pa
5. Fu WQ, Chen BG, Zhang KB, Liu J, Sun XH, Huang BX, et al. Rheological behavior of hydrate slurry with xanthan gum and carboxmethylcellulose under high shear rate conditions. Energy Fuels (2022) 36(6):3169–83. doi:10.1021/acs.energyfuels.1c04359
6. Zhao J, Torabi F, Yang J. The role of emulsification and IFT reduction in recovering heavy oil during alkaline-surfactant-assisted CO2 foam flooding: An experimental study. Fuel (2022) 313:122942. doi:10.1016/j.fuel.2021.122942
7. Zhang B, Lu N, Guo Y, Wang Q, Cai M, Lou E. Modeling and analysis of sustained annular pressure and gas accumulation caused by tubing integrity failure in the production process of deep natural gas wells. J Energ Resour Tech (2022) 144(06):063005. doi:10.1115/1.4051944
8. Zhao J, Torabi F, Yang J. The synergistic role of silica nanoparticle and anionic surfactant on the static and dynamic CO2 foam stability for enhanced heavy oil recovery: An experimental study. Fuel (2021) 287:119443. doi:10.1016/j.fuel.2020.119443
9. Myers TJ, Radke CJ. Transient foam displacement in the presence of residual oil: Experiment and simulation using a population-balance model. Ind Eng Chem Res (2000) 39(8):2725–41. doi:10.1021/ie990909u
10. Mensire R, Lorenceau E. Stable oil-laden foams: Formation and evolution. Adv Colloid Interf Sci (2017) 247:465–76. doi:10.1016/j.cis.2017.07.027
11. Kharabaf H, Yortsos YC. Pore network model for foam formation and propagation in porous media. SPE J (1998) 3(01):42–53. doi:10.2118/36663-pa
12. Kovscek AR, Patzek TW, Radke CJ. A mechanistic population balance model for transient and steady-state foam flow in Boise sandstone. Chem Eng Sci (1995) 50(23):3783–99. doi:10.1016/0009-2509(95)00199-f
13. Kovscek AR, Chen Q, Gerritsen M. Modeling foam displacement with the local-equilibrium approxima- tion: Theory and experimental verification. SPE J (2010) 15(01):171–83.
14. Fu WQ, Yu J, Xiao Y, Wang CL, Huang BX, Sun B. A pressure drop prediction model for hydrate slurry based on energy dissipation under turbulent flow condition. Fuel (2022) 311(2022):12218. doi:10.1016/j.fuel.2021.122188
16. Aronson AS, Bergeron V, Fagan ME, Radke CJ. The influence of disjoining pressure on foam stability and flow in porous media. Colloids Surf A: Physicochemical Eng Aspects (1994) 83(2):109–20. doi:10.1016/0927-7757(94)80094-4
17. Chen M, Rossen W, Yortsos YC. The flow and displacement in porous media of fluids with yield stress. Chem Eng Sci (2005) 60(15):4183–202. doi:10.1016/j.ces.2005.02.054
18. Zhao J, Torabi F, Yang J. Role of viscous forces in foam flow in porous media at the pore level. Ind Eng Chem Res (2021) 60(7):3156–73. doi:10.1021/acs.iecr.0c05735
19. Tang G-Q, Kovscek AR. Trapped gas fraction during steady-state foam flow. Transp Porous Med (2006) 65(2):287–307. doi:10.1007/s11242-005-6093-4
20. Myers TJ. The role of residual oil in the mechanistic simulation of foam flow in porous media: Experiment and simulation with the population-balance method. Berkeley, CA: Ph.D. Dissertation, University of California (1999).
21. Oolman T, Godard ST, Pope GA, Jin M, Kirchner K. DNAPL flow behavior in a contaminated aquifer: Evaluation of field data. Groundwater Monit Remediation (1995) 15(4):125–37. doi:10.1111/j.1745-6592.1995.tb00560.x
22. Zhao J, Torabi F. Experimental investigation and modelling of CO2 ‐foam flow in heavy oil systems. Can J Chem Eng (2019) 98(1):147–57. doi:10.1002/cjce.23573
23. Conn CA, Ma K, Hirasaki GJ, Biswal SL. Visualizing oil displacement with foam in a microfluidic device with permeability contrast. Lab Chip (2014) 14(20):3968–77. doi:10.1039/c4lc00620h
24. Chang S-H, Grigg RB. Effects of foam quality and flow rate on CO2-foam be- havior at reservoir temperature and pressure. SPE Reservoir Eval Eng (1999) 2(3):248–54. doi:10.2118/56856-pa
25. Chen Q, Gerritsen M, Kovscek AR. Modeling foam displacement with the local-equilibrium approximation: Theory and experimental verification. SPE J (2010) 15(01):171–83. doi:10.2118/116735-pa
26. Denkov ND. Mechanisms of foam destruction by oil-based antifoams. Langmuir (2004) 20(22):9463–505. doi:10.1021/la049676o
Keywords: foam behavior, enhanced oil recovery, flow regime, population balance model, CO2 channeling
Citation: Zhao J, He Y and Yang J (2022) Experimental and population balance model interpretation of foam physics in porous media. Front. Phys. 10:1028414. doi: 10.3389/fphy.2022.1028414
Received: 26 August 2022; Accepted: 06 September 2022;
Published: 23 September 2022.
Edited by:
Zhiyuan Wang, China University of Petroleum, Huadong, ChinaReviewed by:
Xiukun Wang, China University of Petroleum, Beijing, ChinaWanju Yuan, Geological Survey of Canada, Canada
Copyright © 2022 Zhao, He and Yang. This is an open-access article distributed under the terms of the Creative Commons Attribution License (CC BY). The use, distribution or reproduction in other forums is permitted, provided the original author(s) and the copyright owner(s) are credited and that the original publication in this journal is cited, in accordance with accepted academic practice. No use, distribution or reproduction is permitted which does not comply with these terms.
*Correspondence: Jun Yang, eWFuZzIzM2pAdXJlZ2luYS5jYQ==