
95% of researchers rate our articles as excellent or good
Learn more about the work of our research integrity team to safeguard the quality of each article we publish.
Find out more
BRIEF RESEARCH REPORT article
Front. Phys. , 22 November 2022
Sec. Statistical and Computational Physics
Volume 10 - 2022 | https://doi.org/10.3389/fphy.2022.1027192
 Juhi Singh
 Sutapa Roy*
When two unequal sized droplets coalesce to form a final product drop, the product forms closer to the larger of its two parents—a phenomenon known as the coalescence-preference dynamics. In this paper, using the state-of-the-art molecular dynamics simulations, we study the time-dependent properties of coalescence preference for phase segregating single-component fluids, over a broad range of fluid density and temperature. Hydrodynamics is fully taken into account. Coalescence time is observed to be shorter for parents with larger size ratio. Our simulation data also points towards an interesting power-law dependence of the coalescence time on the droplet size ratio, which is universal for both droplets and microbubbles.
In the last decade there has been huge scientific involvement to understand the coalescence properties of bubbles and droplets. Coalescence and breakage of bubbles is common in nature; two bubbles upon touching each other try to reduce their surface energy in order to form a stable configuration [1] and during this process, which is known as coalescence, the droplets undergo changes in shape. Most of the literature for coalescence is dedicated to the study of liquid bridge, spreading and jumping of bubbles on a solid surface, coalescence of sessile droplets, etc [2–4]. Investigations on the coalescence preference dynamics are very few and started only recently [5–8]. When two liquid droplets (bubbles) touch each other and eventually coalesce to form a single final droplet (bubble), the spatial position of the product droplet (bubble) is observed to be closer to the larger of its two parents—a phenomenon known as coalescence preference (CP) dynamics. The relative positioning of the product drop (bubble) with respect to its parents has been reported earlier [5] to obey a power law scaling as a function of the parent size inequality. The higher the difference in the size of the two parents, the closer the final droplet forms to the larger parent. Experimentally, the quantification of such spatial and temporal properties of coalescence preference is highly challenging due to the hurdles involved with the precision measurements of the droplet centers and their radii. In highly dense fluids, this becomes even harder because of the overlap of nearby droplets. From computer simulation point of view, such studies are difficult because of the requirement of large system sizes (in order to avoid finite-size effects) which in turn makes the molecular dynamics simulations very expensive. Beside, to reach the limit of large droplet size ratio one requires a high droplet size dispersion which is difficult to achieve. Despite these obstacles, there have been successful attempts in the last decade trying to understand the coalescence preference for droplets [5, 6], microbubbles [5]; albeit for spatial properties. Time-dependent properties of coalescence preference are very rarely studied [7] and requires significant future investigations encompassing theory, experiments, and computer simulations. Knowledge on the universal features of various spatial and temporal quantities and the relevant power-law exponents are also crucial for a better understanding of this phenomenon.
An important class of systems which show coalescence of droplets are phase segregating fluids. The mechanism and dynamics of phase separation in fluids depend on a variety of control parameters, viz., fluid critical density, fluid temperature, viscosity, hydrodynamic effects, etc. A single-component fluid exhibits a second-order phase transition at its critical point of vapor–liquid transition which is exemplified schematically in Figure 1. Here, Tc marks the critical temperature above which the fluid happens to be in a homogeneous state. Density of the fluid at the critical point is ρc. The equilibrium state below Tc is the coexistence of liquid and vapor phases. When an initially homogeneous fluid at a very high temperature (T > Tc) is suddenly quenched below Tc, it falls out-of-equilibrium and undergoes a non-equilibrium phase separation process [9, 10]. If the fluid is quenched at its critical density ρc percolating domain structure is formed which grows with time. On the other hand, when the fluid is rapidly quenched at an off-critical density (marked by a cross in Figure 1), phase segregation proceeds via the formation of liquid droplets floating in the background vapor phase. With time, these liquid droplets undergo Brownian motion, they collide with each other [11, 12] and form bigger coalesced drops. This coalescence process conserves the total mass of the colliding droplets [13, 14] and takes place under the influence of hydrodynamics.
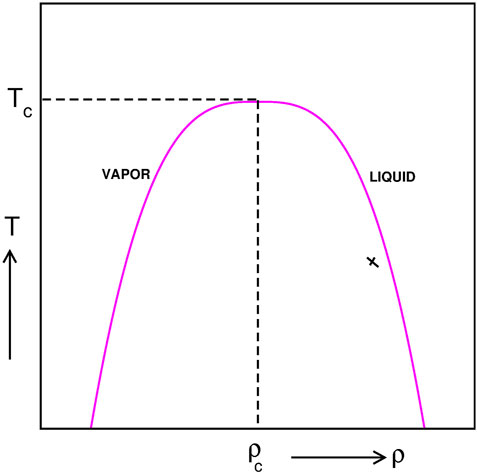
FIGURE 1. Schematic phase diagram of a single-component fluid in the temperature-density plane. Tc and ρc mark the critical temperature and critical density, respectively. Above Tc the fluid is in a homogeneous state and below Tc it is in a two-phase coexistence state. Upon a temperature quench from a high temperature inside the binodal at ρc percolating domain morphology is observed. Cross refers to an off-critical quench for which droplets form and they grow in size by coalescence among each other.
In this paper, using the state-of-the-art molecular dynamics (MD) simulations, we study the coalescence preference of liquid droplets during phase separation of a three-dimensional off-critical single-component fluid. The mechanism of coalescence of droplets involve hydrodynamics. Our primary focus is on the effects of the droplet size ratio on the time-dependent properties of coalescence preference (CP). To the best of our knowledge, this is the first study on the temporal properties of CP for phase segregating liquids.
A typical coalescence event is explained in Figure 2 schematically. Here, L, S, p mark the centres of the larger parent, smaller parent, and the product, respectively. Larger parent has radius RL and the smaller one RS. The distance between the product and the larger (smaller) parent is denoted by aL (aS). As reported in earlier studies in the literature [5], the relative positioning of the product droplet exhibits an algebraic scaling with respect to the parent size ratio as
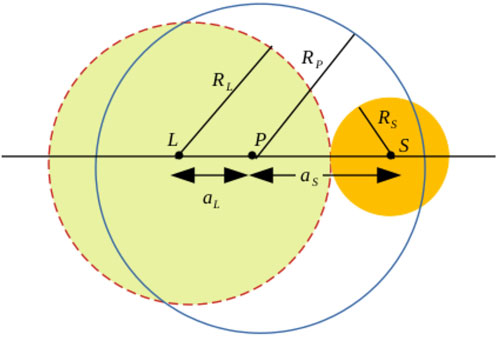
FIGURE 2. Schematic of two unequal-sized coalescing parent droplets with centres at L (large) and S (small) and the product droplet with a centre at P. The separation distances between the larger and smaller parents from the centre of the coalesced drop are marked as aL and aS, respectively. The radii of the droplets are denoted by RL (larger parent), RS (smaller parent), and RP (product).
In this paper, we focus on the temporal properties of such coalescence events. Particular focus is on the coalescence time τ which is defined as the time required for the product droplet to form completely starting from the time when the two parents just touch each other. Our study reveals that the larger the size inequality of the parent droplets, the shorter time it takes for the product to form. Within the range of droplet size dispersion available in our study, our MD simulation data indicates the presence of a power-law dependence of τ on the droplet size ratio:
A single-component fluid is considered which is modelled by mono-disperse particles of diameter σ and mass m which are interacting with each other via a 12–6 Lennard-Jones potential
where, ɛ is the interaction strength and rij is the spatial distance between two particles i and j. To reduce computational time, this potential is truncated at a suitable distance r = rc = 2.5σ and further modified [15, 16] to make both the potential and force continuous at rc as follows:
and 0 otherwise. Here, the density is expressed as ρ = Nσ3/L3; N being the total number of particles in a cubic simulation box of side length L. Periodic boundary conditions [17] are applied along all Cartesian directions. The phase diagram of this model fluid in the temperature-density plane (equivalent to Figure 1) was studied before [18] which estimated the values of the critical density ρc ≃ 0.3 and the critical temperature kBTc ≃ 0.9ɛ, for ɛ = 1. Based on this knowledge on the critical point we decided the quench temperature T of the fluid to be 0.67Tc which corresponds to a phase segregated state.
The initial configurations of the fluid are prepared at a very high temperature Ti = 5Tc using molecular dynamics (MD) simulation method [17, 19]. For this purpose, particles are assigned random positions within a cubic simulation box of length L by making sure that there is no particle overlap. Initial velocity is given from a Gaussian distribution at Ti = 5Tc. Next, the positions and velocities of the particles are updated within the MD scheme [20]. A velocity Verlet algorithm is used for the velocity update. Inter-particle forces for this purpose is calculated using Eq. 2. By running MD steps over a sufficiently long time, an equilibrium configuration at the temperature 5Tc is obtained. Next, this configuration is rendered a sudden temperature change at Tf = 0.67Tc. For this purpose, particles are given new velocities from a Gaussian distribution at Tf following the equipartition theorem. Next, the particle positions and velocities are updated again within the MD simulation [19] in the canonical ensemble using the Nosé-Hoover thermostat (NHT) [21]. A thermostat is required to maintain the system temperature to a desired fixed value (in this case, Tf). During MD runs, Newton’s equations of motion are solved using the velocity-Verlet algorithm, with a time step of integration dt = 0.005τ0;
In order to be able to identify the droplets from the MD simulation data, a smart mapping technique is applied [22]. First, the local density
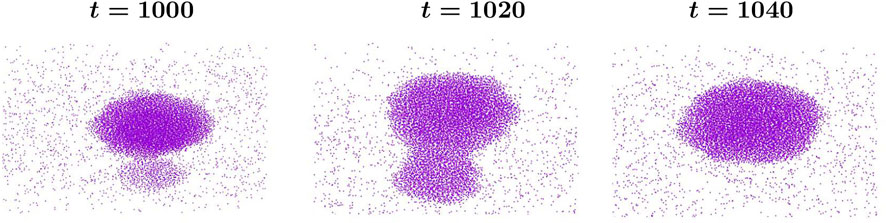
FIGURE 3. Molecular dynamics simulation snapshots of a coalescence event at different times t expressed in units of τ0. See main text for the definition of τ0. Two droplets touch at time t =1000, a thin liquid bridge forms and evolves with time until a single product drop forms at t =1040, in the background of the low-density vapor phase. System size and temperature are L =100 and T =0.68Tc, respectively. Phase separation progresses via the coalescence of liquid droplets.
Coalescence time for a coalescence event here is defined as the time interval from the moment two droplets just touch to the time when their centres have coincided with each other and no longer change. This will be further illustrated in Figure 4.
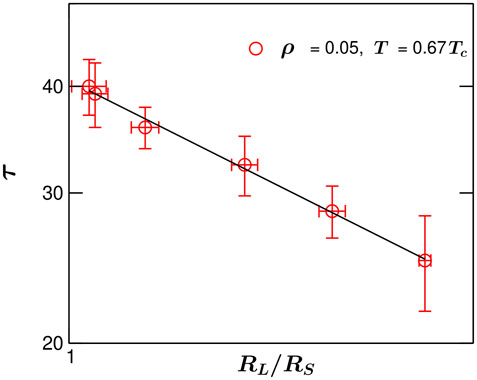
FIGURE 4. Coalescence time τ vs. the parent droplet size ratio RL/RS on the double-logarithmic scale, during droplet coalescence in a phase-segregating single-component fluid. Data correspond to the overall system density ρ =0.05 and the quench temperature T =0.67Tc and coalescence events are collected from various system sizes L*. The solid line refers to a power-law decay with an exponent n =1.1.
Figure 4 represents the time evolution of two unequal sized coalescing droplets. Data are from molecular dynamics (MD) simulations. Morphologies at a few subsequent times are shown. Time t is in unit of τ0 defined before. Various stages of the coalescence event are shown here: (a) touching of the two droplets, (b) formation of a dumbell-like neck, and (c) the final single product drop. Note that these droplets are three-dimensional and they are spherical only in a statistical sense. The constituent particles of the background low-density vapor phase are also marked in the snapshots. Clearly, the droplet density is much higher than the background fluid. The physical mechanism of this coalescence is the Brownian coagulation as described in [14].
In Figure 5 the dependence of the coalescence time τ on the droplet size ratio is presented for a value of density ρ = 0.05 and the quench temperature T = 0.67Tc. Here, τ is defined as the time required for a coalescence process to complete starting from the first touching between the two parents. The dependence of τ on the parent size ratio RL/RS is plotted on a double-logarithmic scale. One major hurdle with the simulation of such droplet coalescence is that the droplet size dispersion very low. Hence, finding coalescence of droplets of very different sizes is rare. Thus the x − axis in this plot is limited to a rather short window. Because these droplets are three-dimensional, pinpointing the exact time when they touch is also difficult. This leads to a large errorbar in the coalescence time τ. Each point in Figure 5 corresponds to 7-8 coalescence events and the errorbars are calculated by considering the average of all these coalesence events at a particular combination of RL/RS. Note that the errorbar in RL/RS arises from the fact that the numerical mapping of the spherical droplets is very tricky in three spatial dimensions and this makes the estimate of dropler radius and thus RL/RS subjected to error. Due to the same reason the estimataion of the exact time when two droplets touch each other is also prone to error. In Figure 5, the solid line corresponds to a power-law behavior [7].
where, n is the associated dynamic exponent. This phenomenological relation describes the dependence of coalescence time on the size inequality of the parents. For a finite positive value of n, coalescence time τ decreases as the parent size ratio RL/RS becomes larger. In the limiting case of RL/RS → ∞, one obtains τ → 0. An algebraic trend is captured within our MD simulation data; albeit over a rather short size ratio range. It is evident that the formation of a product drop takes lesser time for parents with more size inequality. In Figure 4, the solid line refers to a fit to the data using Eq. 3. Which yields n ≃ 1.1. Chi-square of fitting is 2.744 and the correlation coefficient 0.993. This value of n for liquid droplets is rather different from the one (n ≃ 0.7) observed in case of bubbles [7].
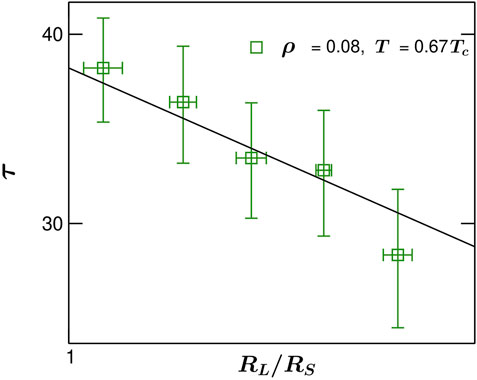
FIGURE 5. Same as Figure 4, but for density ρ =0.08 and temperature T =0.67Tc. Symbols correspond to molecular dynamics simulation data and the solid line is a fit to that with n ≃0.67.
Next, in order to study the effects of density change on the temporal decay exponent, in Figure 5, we present the temporal scaling of τ for a higher density ρ = 0.08 and temperature same as in Figure 4 (T = 0.67Tc). Both the ρ values are chosen judicially such that at those densities one observes spherical droplets in the fluid. It was demonstrated [12] that as the density of a fluid changes beyond a certain threshold value one observes percolating morphology (not droplets). The ρ values used in this work are suitable for droplet coalescence events. In Figure 5, the symbols stand for the MD simulation data and the solid line is a fit. The value of the power-law decay exponent n turns out to be slightly lower 0.67. However, at this point we do not aim to conclude about the dependence of this decay exponent on the fluid density due to the lack of very high precision data. With higher computer resources and more refined temporal and spatial resolutions one can of course investigate the dependence on density.
Our study points towards the presence of an algebraic dependence of coalescence time τ during coalescence on the parent size ratio RL/RS which appear to be universal for both microbubbles [23] and droplets. However, it seems like the value of the temporal exponent n is susceptible to bubbles/droplets. For bubbles the reported exponent value is 0.7 whereas our work points towards a value 1.1 for droplets. Here we point out that the density and viscosity of the background host fluid will influence the coalescence preference dynamics and hence the associated power-law exponents as well. For droplets which are suspended in a vapor phase the background density is much lower as compared to the bubbles suspended in a liquid. Hence, differences in the exponents for droplets and bubbles are also expected.
In conclusion, we present the first molecular dynamics simulation study of the coalescence preference dynamics for liquid droplets in a single-component fluid undergoing phase separation. The droplets undergo coalescence during which the total mass of the two coalescing droplets is conserved. The effects of the parent droplet size ratio for unequal-sized droplets is investigated systematically in details. It is observed that the formation of the product droplet is faster for parent droplets with stronger size inequality. Unequal sized droplets always coalesce much faster than equal sized droplets. Interestingly, our results indicates the presence of a power-law dependence of coalescence time τ on the droplet size ratio RL/RS. The associated exponent n as estimated from our molecular dynamics data n ≃ 1.1 is slightly different from that for microbubbles in water. Because of the short coalescence time and rather narrow range of droplet size, quantitative analysis of such scaling behavior within the framework of molecular dynamics simulations is quite challenging. Also, tracking the three dimensional droplets is another tricky job. In future, we will undertake the study of flow pattern around two coalescing droplets in order to understand how this might affect the coalescence time. Investigating similar phenomenon for liquid droplets in a binary fluid will provide important information about universality which we leave out as a future exercise. We hope this work will promote future studies on the time-dependence of coalescence preference for which till date there is no report from experiments. To the best of our knowledge, this is the first study on the temporal scaling of coalescence preference dynamics for non-equilibrium phase segregation phenomena.
The raw data supporting the conclusion of this article will be made available by the authors, without undue reservation.
JS contributed in the analysis of the data and writing the manuscript. SR conceived the project and contributed to the analysis of the data, writing the manuscript.
The authors declare that the research was conducted in the absence of any commercial or financial relationships that could be construed as a potential conflict of interest.
All claims expressed in this article are solely those of the authors and do not necessarily represent those of their affiliated organizations, or those of the publisher, the editors and the reviewers. Any product that may be evaluated in this article, or claim that may be made by its manufacturer, is not guaranteed or endorsed by the publisher.
1. Lohse D, Zhang X. Surface nanobubbles and nanodroplets. Rev Mod Phys (2015) 87:981–1035. doi:10.1103/revmodphys.87.981
2. Koplik J. Surface impacts and collisions of particle-laden nanodrops. Phys Fluids (1994) (2015) 27:082001. doi:10.1063/1.4928029
3. Gross M, Steinbach I, Raabe D, Varnik F. Viscous coalescence of droplets: A lattice Boltzmann study. Phys Fluids (2013) 25:052101. doi:10.1063/1.4803178
4. Li T, Li M, Zhang L, Yan M, Li H. Molecular dynamics study of the temperature-dependent coalescence of liquid nanodrops: Implications for microfluidics. ACS Appl Nano Mater (2019) 12:7978–88. doi:10.1021/acsanm.9b02018
5. Weon BM, Je JH. Coalescence preference depends on size inequality. Phys Rev Lett (2012) 108:224501. doi:10.1103/physrevlett.108.224501
6. Kim Y, Lim SJ, Gim B, Weon BM. Coalescence preference in densely packed microbubbles. Sci Rep (2015) 5:7739. doi:10.1038/srep07739
7. Chen R, Yu H, Zhu L, Patil RM, Lee T. Spatial and temporal scaling of unequal microbubble coalescence. Aiche J (2017) 63:1441–50. doi:10.1002/aic.15504
8. Roy S. Coalescence preference and droplet size inequality during fluid phase segregation. EPL (2018) 121:34001. doi:10.1209/0295-5075/121/34001
9. Bray AJ. Theory of phase-ordering kinetics. Adv Phys X (2002) 51:481–587. doi:10.1080/00018730110117433
11. Roy S, Das SK. Dynamics and growth of droplets close to the two-phase coexistence curve in fluids. Soft Matter (2013) 9:4178–87. doi:10.1039/c3sm50196e
12. Roy S, Das SK. Effects of domain morphology on kinetics of fluid phase separation. J Chem Phys (2013) 139:044911. doi:10.1063/1.4816372
13. Binder K. In: RW Cahn, P Haasen, and EJ Kramer, editors. Phase transformation of materials, 5. VCH, Weinheim (1991), 405.
14. Binder K, Stauffer D. Theory for the slowing down of the relaxation and spinodal decomposition of binary mixtures. Phys Rev Lett (1974) 33:1006–9. doi:10.1103/physrevlett.33.1006
15. Das SK, Horbach J, Binder K, Fisher ME, Sengers JV. Static and dynamic critical behavior of a symmetrical binary fluid: A computer simulation. J Chem Phys (2006) 125:024506. doi:10.1063/1.2215613
16. Roy S, Das SK. Finite-size scaling study of shear viscosity anomaly at liquid-liquid criticality. J Chem Phys (2014) 141:234502. doi:10.1063/1.4903810
18. Midya J, Das SK. Publisher’s note: “Finite-size scaling study of dynamic critical phenomena in a vapor-liquid transition” [J. Chem. Phys. 146, 044503 (2017)]. J Chem Phys (2017) 146:069901. doi:10.1063/1.4976556
19. Frenkel D, Smit B. Understanding molecular simulations:from algorithm to applications. San Diego: Academic Press (2002).
20. Roy S, Das SK. Study of critical dynamics in fluids via molecular dynamics in canonical ensemble. Eur Phys J E (2015) 38:132. doi:10.1140/epje/i2015-15132-2
21. Martyna GJ, Klein ML, Tuckerman M. Nosé–Hoover chains: The canonical ensemble via continuous dynamics. J Chem Phys (1992) 4:2635–43. doi:10.1063/1.463940
22. Roy S, Das SK. Nucleation and growth of droplets in vapor-liquid transitions. Phys Rev E (2012) 85:050602. doi:10.1103/physreve.85.050602
Keywords: droplet, coalescence-preference, molecular dynamics, phase separation, droplets
Citation: Singh J and Roy S (2022) Coalescence preference dynamics for droplet growth during single-component fluid phase separation. Front. Phys. 10:1027192. doi: 10.3389/fphy.2022.1027192
Received: 24 August 2022; Accepted: 09 November 2022;
Published: 22 November 2022.
Edited by:
Nuno A. M. Araújo, University of Lisbon, PortugalReviewed by:
Paolo Malgaretti, Helmholtz Institute Erlangen-Nürnberg, GermanyCopyright © 2022 Singh and Roy. This is an open-access article distributed under the terms of the Creative Commons Attribution License (CC BY). The use, distribution or reproduction in other forums is permitted, provided the original author(s) and the copyright owner(s) are credited and that the original publication in this journal is cited, in accordance with accepted academic practice. No use, distribution or reproduction is permitted which does not comply with these terms.
*Correspondence: Sutapa Roy, cm95QGlpdGduLmFjLmlu
Disclaimer: All claims expressed in this article are solely those of the authors and do not necessarily represent those of their affiliated organizations, or those of the publisher, the editors and the reviewers. Any product that may be evaluated in this article or claim that may be made by its manufacturer is not guaranteed or endorsed by the publisher.
Research integrity at Frontiers
Learn more about the work of our research integrity team to safeguard the quality of each article we publish.