- 1School of Electronic and Information Engineering, Guangxi Normal University, Guilin, China
- 2School of Integrated Circuits, Guangxi Normal University, Guilin, China
- 3Key Laboratory of Integrated Circuits and Microsystems (Guangxi Normal University), Education Department of Guangxi Zhuang Autonomous Region, Guilin, China
Glycerol is widely used in medicine, industry and skin care products. This study investigated a high-sensitivity glycerol concentration sensor based on double Fano resonances in a metal-insulator-metal (MIM) waveguide structure, established a coupling model of a baffle waveguide (BW) and a circular split ring resonator (CSRR), and generated asymmetric double Fano resonances in the waveguide structure. The Fano resonance transmittance reached 0.82, and the linear relationship between the refractive index (RI) and the glycerol concentration was obtained using the sensitivity of the Fano resonance spectrum. The application of the proposed sensor for glycerol concentration detection revealed that the Fano resonance wavelength was redshifted with the RI and that the sensing sensitivity reached 1153.85 nm/refractive index unit (RIU); therefore, the quick detection of the corresponding glycerol concentration can be realized. This proposed structure has significance in the research of optical sensors and optical switches.
1 Introduction
The Fano resonance spectrum is very sensitive [1, 2], and the research on the sensing characteristics [3], especially the interaction between surface plasmons and light, can be used to develop new nanoscale photonic devices [4–6]; Based on the physical properties of surface plasmas such as strong binding force, low loss, low power consumption, small size and easy integration, SPP and Fano MIM waveguide devices can be manufactured for optical sensors and filters. It is very promising to study the sensitivity of Fano resonance spectral lines to fabricate MIM waveguide structures for concentration sensors [7]. At present, the MIM waveguide sensor based on Fano resonance have become a hot topic that people continue to overcome [8]. Surface plasmon resonance-based high-sensitivity refractive index sensors have been proposed, and biosensors have been studied to perform better in the infrared region than graphene-based biosensors, with a sensitivity exceeding 970/RIU [9]. Based on the multiple Fano resonance characteristics in the surface plasmon resonance sensor, it has been shown that multiple Fano resonances can be generated by changing the structure, and the quality factor of high sensitivity is 4 times higher than that of the general surface plasmon resonance sensor [10]. A refractive index sensor composed of nanoring arrays and Fabry-Perot (FP) resonators based on multiple Fano resonances has been proposed, with corresponding sensing sensitivities up to 621.5 nm/RIU and 906.9 nm/RIU [11]. Based on Fano resonance, an optical refractive index sensor based on the “lucky knot” nanostructure in the mid-infrared region has been proposed, with a sensitivity of 986 nm/RIU and a maximum quality factor of 32.7, which is superior to the sensor based on metal materials [12]. The super surface device based on nano metal medium metal plasma cavity array has been proposed. The super surface is sensitive to the environmental refractive index, and the sensitivity of the refractive index temperature sensor studied is 667 nm/RIU [13].
In this paper, based on the research on the sensing characteristics of SPP, an MIM waveguide structure composed of BW and a CSRR was proposed, and the application of SPP-based sensor was studied. The detection method of glycerol concentration was proposed, i.e., the glycerol concentration has a linear relationship with the RI, and RI can affect the Fano resonance spectrum; therefore, the relationship between the glycerol concentration and Fano resonance spectrum can be established, and a concentration sensor based on surface plasmon can be achieved. The glycerol concentration sensor we proposed is a better method to process samples, which is uncommon in the current glycerol concentration sensor. The sensitivity is up to 1153.85 nm/RIU calculated through experiments. Compared with other similar studies, the sensitivity of this structure in optical sensors has been improved. This structure is of great significance in the research of optical sensors.
2 Propagation characteristics and numerical calculation
2.1 Propagation analysis
In this paper, the waveguide structure method is used to excite the SPP, and the principle is that the incident light generates an evanescent wave in the waveguide structure. Since it matches the wave vector of the surface SPP, the SPP can be activated when the evanescent wave passes through the metal layer [14]. In the waveguide,
The dielectric constant is modeled using the Drude model [17]:
where,
Where, the dielectric constant of the medium is
Effective length
The formulas of the three parameters, the sensitivity S, the quality factor FOM, and quality factor
FWHM represents the full width half maximum of the spectral line [25, 26].
2.2 Model calculation and analysis
The MIM waveguide structure is shown in Figure 1A, which is composed of a BW and a CSRR. For the two-dimensional (2D) structure diagram, its simulation is fast, it can reflect the overall structure, and its final result reaches the expectations, so it was selected for the simulation in this paper. The waveguide structure to be measured is the yellow region. The BW and CSRR can be etched by electron beam etching, and the material to be measured can be filled with capillary attraction, and finally, the structure was sealed with a transparent insulator. In the waveguide structure, Pin is the input power, Pout is the output power [27], g represents the distance between BW and CSRR, w represents the height of the straight waveguide, d and y denote the width of the main waveguide baffle and the ring waveguide baffle, respectively, the width of the middle baffle is f, the height of the waveguide is L, r and R are the radius of the small and big circles, respectively.
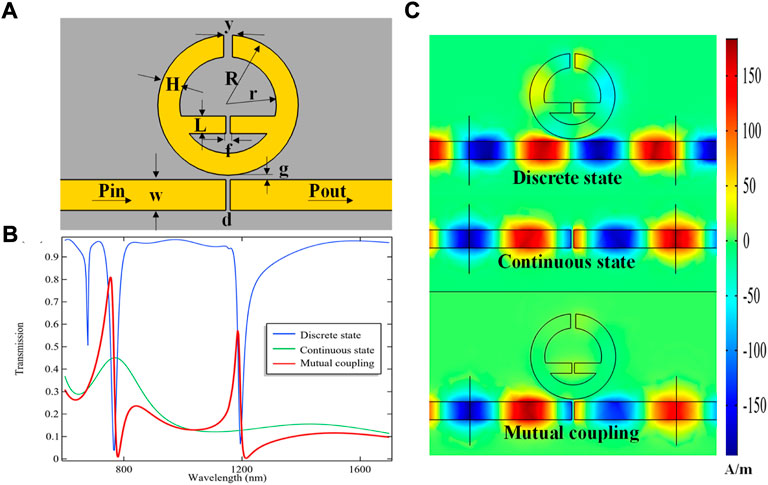
FIGURE 1. (A) The waveguide structure composed of a BW and a CSRR, (B) Transmission lines of the entire structure (C) the magnetic field distributions in the discrete state, continuous state, and mutual coupling.
Fano resonance is a kind of scattering resonance phenomenon that produces asymmetric line shape, which is formed by the mutual coupling of continuous state energy level and discrete state energy level. The incident light is TM polarization mode, because the excited surface plasmon polaritons can only exist in TM polarization mode. Figure 1B shows the transmission lines when the waveguide structure is in discrete state, continuous state, and coupled state, respectively [28]. As shown in Figure 1C, when the CSRR is not coupled with a baffle, the spectrum can be viewed as a discrete state, when the CSRR is coupled with a baffle, a continuous state can be formed, and the magnetic field distribution can be viewed as an energy distribution [29, 30]. In this waveguide structure, two lowest points are formed at 800 nm and 1200 nm through the mutual coupling of the continuous state and the discrete state, thereby forming the double Fano resonances [31]. Further study of the resulting asymmetric line spectral shape, especially the variation of parameters, affects the sensing properties of Fano resonance [32].
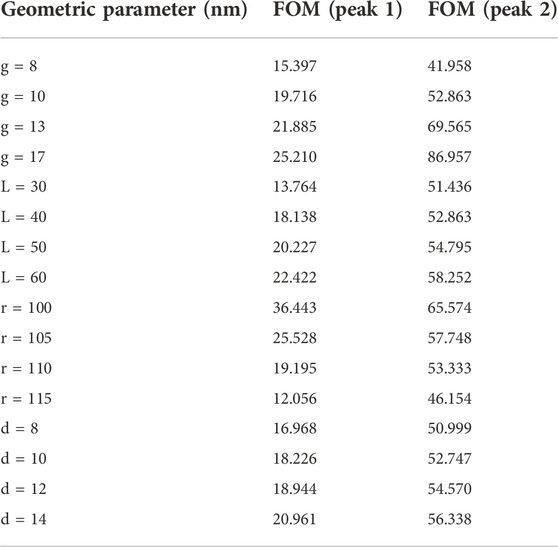
The waveguide structure directly affects the Fano resonance lines [33]. Figure 2 shows the transmission lines of different geometric parameters. Table 1 is the value of the corresponding geometric parameters for the FOM [34]. Figure 2A shows the transmission lines of the BW and CSRR coupling distances g from 8 nm to 17 nm. First, the other variables are controlled, i.e., d = 10 nm, y = 20 nm, f = 10 nm, r = 110 nm, R = 165 nm, and L = 40 nm. In Figure 2A, with the increase of g, the Fano resonance spectrum appears redshifted, and the transmission peak decreases from 0.841 to 0.696. Table 1 shows that, at Peak 1 and Peak 2, the FOM reaches the maximum, but the transmission peak is the lowest, and the FOM at Peak 2 is generally greater than that at Peak 1. Figure 2B shows the transmission lines when the L of middle waveguide of the CSRR increases from 30 nm to 60 nm. The other fixed variables are as follows: d = 10 nm, y = 20 nm, f = 10 nm, r = 110 nm, R = 165 nm, and g = 8 nm. With the increase of L of middle waveguide of the CSRR, the Fano resonance spectrum exhibits a blueshift, the transmittance at Peak 1 increases with the increase of L to reach 0.82, and the transmittance at Peak 2 changes slightly from 0.57 to 0.55. Table 1 shows that the FOM reaches the highest value of 58.252 at Peak 2. Figure 2C shows the transmission lines when the r changes from 110 nm to 115 nm. The other fixed variables are as follows: d = 10 nm, y = 20 nm, f = 10 nm, R = 160 nm, L = 60, and g = 8 nm. Figure 2C shows that as r increases, the Fano resonance spectrum appears redshifted, and the transmission peak reaches 0.809 at Peak 1. Table 1 shows that the FOM at Peak 1 and Peak 2 decreases from 36.443 to 12.056 and 65.574 to 46.154, respectively. Figure 2D shows the transmission lines when the d changes from 8 nm to 14 nm. The other fixed variables are as follows: y = 20 nm, f = 10 nm, r = 110, R = 165 nm, L = 60 nm, and g = 8 nm. Figure 2D shows that as d increases, the Fano resonance spectrum appears redshifted, and the transmission peak at Peak 1 reaches 0.844. According to the data in Table 1, the FOM at Peak 2 increases from 50.999 to 56.338. Finally, the reference literature shows that the quality factor combined with the transmittance can reflect the sensing characteristics of the waveguide [35, 36]. In summary, the appropriate geometric parameters selected in this paper are as follows: r = 110 nm, y = 20 nm, f = At 10 nm, R = 165 nm, d = 10 nm, L = 40 nm, and g = 10 nm.
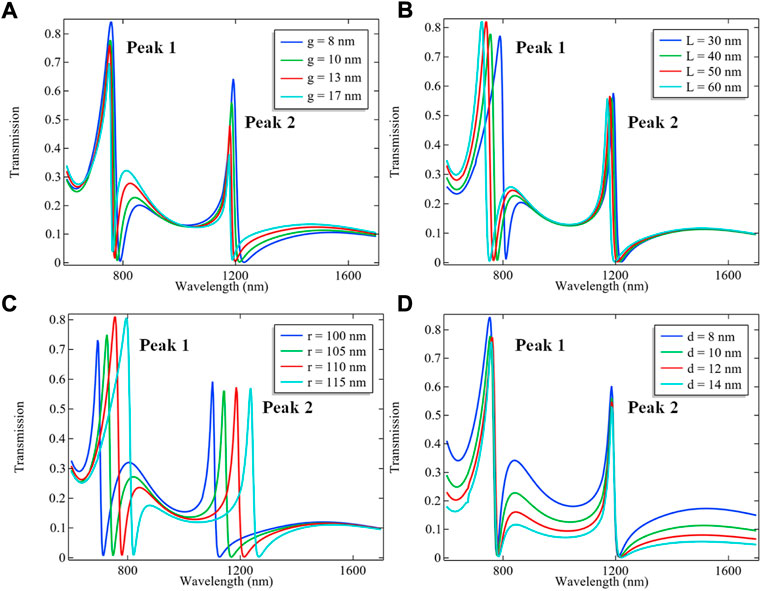
FIGURE 2. (A) Fano resonance transmission lines with different g values (B) Fano resonance transmission lines with different L values (C) Fano resonance transmission lines with different r values (D) Fano resonance transmission lines with different d values.
3 Sensing performance analysis
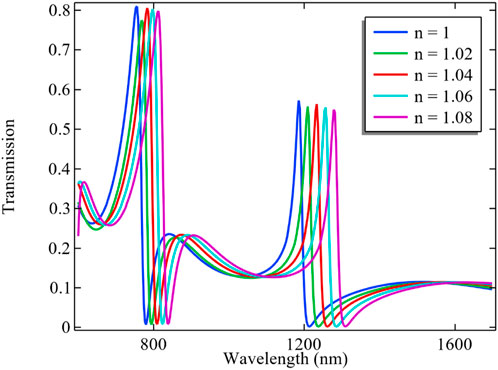
In this paper, the influence of the Fano transmission spectrum on the RI was further studied, which provides the possibility for the study on optical sensors [37, 38]. Figure 3A shows the Fano transmission lines of the waveguide with different RI (n = 1–1.08). Table 2 shows the FOM and RI at Peak 1 and Peak 2. In Figure (a), the transmission peak at Peak 1 is redshifted from 753 nm to 813 nm, and the peak at Peak 2 is redshifted from 1185 nm to 1281 nm. According to Eqs. 4, 5, The maximum S and FOM are 1200 nm/RIU and 53, respectively. This is because the coupling electric field at peak 2 decreases and the transmissivity decreases, and the Fano resonant transmission peak narrows. The calculated FWHM ratio at peak 1 decreases, and because the sensitivity at peak 2 is greater than that at peak 1, according to formula (5), the FOM at peak 2 is usually greater than that at peak 1.
As shown in Table 3 comparing the results of this study with those of other studies, it shows that the sensing performance of the studied structure is significantly improved.
4 Glycerol concentration detection
Glycerol is widely used in medicine, industry and skin care. When glycerol is used in different types of preparations in our daily life, there are strict requirements on its concentration. Especially when glycerol is used on humans, the use of different glycerol concentrations requires our attention. As shown in Table 4, the actual application of several different glycerol concentrations.
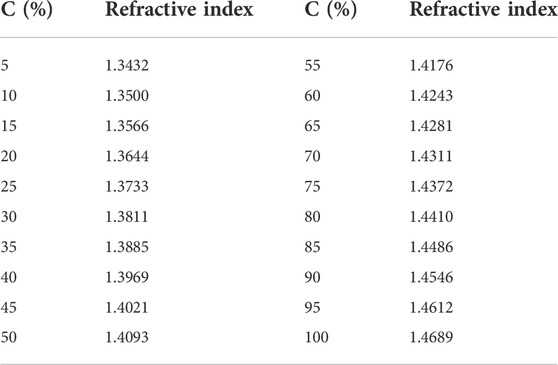
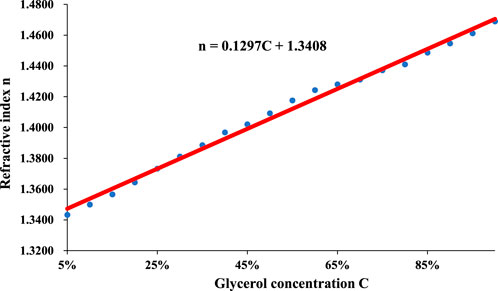
In this paper, a glycerol concentration sensor with MIM waveguide structure is proposed by taking advantage of the sensitivity of Fano resonance lines [46–48]. In this study, the sensitivity
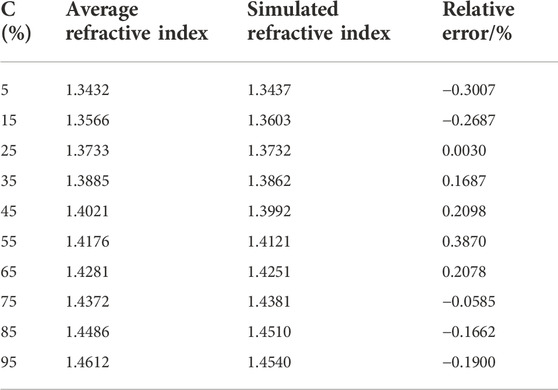
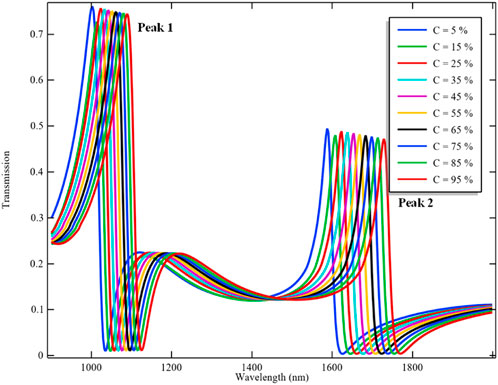
Figure 5 shows that the Fano resonance wavelengths generated by filling multiple glycerol samples with different concentrations into the waveguide cavity are different, and the transmission spectrum exhibits a redshift phenomenon as the concentration of glycerol increases. The data are shown in Table 7, and the fitting curves of different concentrations of glycerol and Fano resonance wavelength were made at Peak 1 and Peak 2 respectively as shown in Figure 6. The results show that
5 Conclusion
In this paper, based on the research on the sensing characteristics of SPP, an MIM waveguide structure composed of BW and a CSRR was proposed. The finite element method and simulation show that the transmission spectrum of this structure is a double Fano resonance spectrum. The effect of geometric parameters on the Fano resonance lines was investigated, and the results showed that the Fano resonance transmittance was as high as 0.8, the sensitivity reached 1200 nm/RIU, and the quality factor was 53. This study found that when the MIM waveguide structure was filled with glycerol, the RI of glycerol with different concentrations was different, and the Fano resonance spectrum was affected by the RI; therefore, based on the relationship between the RI and Fano resonance spectrum, the glycerol concentration could be detected according to the change in the Fano resonance wavelength.
Data availability statement
The original contributions presented in the study are included in the article/Supplementary Material, further inquiries can be directed to the corresponding author.
Author contributions
QX and JZ drafted the manuscript. Zhu jun participated in the design of the study and performed the statistical analysis. All authors read and approved the final manuscript.
Funding
National Natural Science Foundation of China (Grant No. 51965007); Guangxi Natural Science Foundation (2021GXNSFAA220013).
Acknowledgments
We thank Shenzhen Wekmo Technology Group Co., Ltd. and Shanghai Majorbio Bio-pharm Technology Co., Ltd. for their support and assistance in bioinformatics technology. The companies were not involved in the study design, collection, analysis, interpretation of data, the writing of this article or the decision to submit it for publication.
Conflict of interest
The authors declare that the research was conducted in the absence of any commercial or financial relationships that could be construed as a potential conflict of interest.
Publisher’s note
All claims expressed in this article are solely those of the authors and do not necessarily represent those of their affiliated organizations, or those of the publisher, the editors and the reviewers. Any product that may be evaluated in this article, or claim that may be made by its manufacturer, is not guaranteed or endorsed by the publisher.
References
1. Wang Y, Liu H, Wang S, Cai M, Ma L. Optical transport properties of graphene surface plasmon polaritons in mid-infrared band. Crystals (2019) 9(7):354. doi:10.3390/cryst9070354
2. Awada C, Dab C, Zhang J, Ruediger A. Observation of propagating surface plasmon polaritons by using functionalized tip-enhanced Raman spectroscopy. J Raman Spectrosc (2020) 51(8):1270–7. doi:10.1002/jrs.5855
3. Zhu J, Li N. MIM waveguide structure consisting of a semicircular resonant cavity coupled with a key-shaped resonant cavity. Opt Express (2020) 28(14):19978. doi:10.1364/oe.395696
4. Winter G, Barnes LW. Emission of light through thin silver films via near-field coupling to surface plasmon polaritons. Appl Phys Lett (2006) 88(5):051109. doi:10.1063/1.2170426
5. Yang X, Hua E, Wang M, Wang Y, Yan S. Fano resonance in a MIM waveguide with two triangle stubs coupled with a split-ring nanocavity for sensing application. Sensors (2019) 19(22):4972. doi:10.3390/s19224972
6. Li S, Wang Y, Jiao R, Wang L, Li Y, Yu L. Fano resonances based on multimode and degenerate mode interference in plasmonic resonator system. Opt Express (2017) 25(4):3525–33. doi:10.1364/oe.25.003525
7. Reza MR, Ali M. A high-sensitivity sensor based on three-dimensional metal–insulator–metal racetrack resonator and application for hemoglobin detection. Photon Nanostructures - Fundamentals Appl (2018) 32:28–34. doi:10.1016/j.photonics.2018.08.002
8. Amarie D, Mosavian N, Waters EL, Stupack DG. Underlying subwavelength Aperture architecture drives the optical properties of microcavity surface plasmon resonance sensors. Sensors (Basel) (2020) 20(17):4906. doi:10.3390/s20174906
9. Xu Y, Wu L, Ang LK. MoS2-Based highly sensitive near-infrared surface plasmon resonance refractive index sensor. IEEE J Sel Top Quan Electron (2018) 25(2):1–7. doi:10.1109/jstqe.2018.2868795
10. Yang L, Wang J, Yang ZL, Hu DZ, Wu JX, Zheng GG. Characteristics of multiple Fano resonances in waveguide-coupled surface plasmon resonance sensors based on waveguide theory. Sci Rep (2018) 8(1):2560. doi:10.1038/s41598-018-20952-7
11. Shen Z, Mengyuan D. High-performance refractive index sensing system based on multiple Fano resonances in polarization-insensitive metasurface with nanorings. Opt Express (2021) 29(18):28287. doi:10.1364/oe.434059
12. Zhang YH, Liang ZZ, Meng DJ, Qin Z, Fan YD, Shi X, et al. All-dielectric refractive index sensor based on Fano resonance with high sensitivity in the mid-infrared region. Results Phys (2021) 24:104129. doi:10.1016/j.rinp.2021.104129
13. Sun YH, Zhang L, Shi H, Yang S, Wu YQ. Near-infrared plasma cavity metasurface with independently tunable double Fano resonances. Results Phys (2021) 25:104204. doi:10.1016/j.rinp.2021.104204
14. Kim MK, Lakhani AM, Ming CW. Efficient waveguide-coupling of metal-clad nanolaser cavities. Opt Express (2011) 19(23):23504–12. doi:10.1364/oe.19.023504
15. Chen X, Donaldson S, Sun S. Kähler-Einstein metrics on Fano manifolds. III: Limits as cone angle approaches \boldmath2π and completion of the main proof. J Amer Math Soc (2013) 28(1):235–78. doi:10.1090/s0894-0347-2014-00801-8
16. Zhu J, Jin GM. Detecting the temperature of ethanol based on Fano resonance spectra obtained using a metal-insulator-metal waveguide with SiO2 branches. Opt Mater Express (2021) 11(9):2787. doi:10.1364/ome.432107
17. Gric T. Surface plasmons at the interface of metamaterial and topological insulator. Opt Quan Electron (2019) 51(7):232–14. doi:10.1007/s11082-019-1950-5
18. Zhang Q, Li J, Liu X, Gelmecha D. Dispersion, propagation, and transverse spin of surface plasmon polaritons in a metal-chiral-metal waveguide. Appl Phys Lett (2017) 110(16):161114. doi:10.1063/1.4982158
19. Zhu J, Yin JG. Optical method for detecting the concentration of sucrose based on plasmonic nanostructures. Carbon Lett (2021) 32(2):629–37. doi:10.1007/s42823-021-00302-w
20. Hu F, Yi H, Zhou Z. Wavelength demultiplexing structure based on arrayed plasmonic slot cavities. Opt Lett (2011) 36(8):1500–2. doi:10.1364/ol.36.001500
21. Zhang Y, Li S, Chen Z, Jiang P, Jiao R, Zhang Y, et al. Ultra-high sensitivity plasmonic nanosensor based on multiple fano resonance in the MDM side-coupled cavities. Plasmonics (2017) 12(4):1099–105. doi:10.1007/s11468-016-0363-6
22. Chou YF, Chao C, Huang HJ, Kumara N, Lim CM, Chiang HP. Ultra-high refractive index sensing structure based on a metal-insulator-metal waveguide-coupled T-shape cavity with metal nanorod defects. Nanomaterials (Basel) (2019) 9(10):1433. doi:10.3390/nano9101433
23. Qiong W, biao OZ, ing SY, Mi L, Qiang L, liang ZG, et al. Tunable nanosensor based on fano resonances created by changing the deviation angle of the metal core in a plasmonic cavity. Sensors (Basel) (2018) 18(4):1026. doi:10.3390/s18041026
24. Wang Y, Li S, Zhang Y, Yu L. Ultrasharp fano resonances based on the circular cavity optimized by a metallic nanodisk. IEEE Photon J (2018) 8(6). doi:10.1109/JPHOT.2016.2628805
25. Peng L, Zhou G, Li M, Hou Z, Xia C, Ge S. Surface plasmon resonance sensor based on microstructured optical fiber with ring-core configuration. IEEE Photon J (2016) 8(5):1–11. doi:10.1109/jphot.2016.2613964
26. Zhu J, Yin JG, Li N, Qin YB. Novel glucose concentration sensor with unique resonance lineshapes in optical cavity. Measurement (2022) 194(194):111006. doi:10.1016/j.measurement.2022.111006
27. Zhan Z, Luo L, Xue C, Zhang W, Yan S. Fano resonance based on metal-insulator-metal waveguide-coupled double rectangular cavities for plasmonic nanosensors. Sensors (Basel) (2016) 16(5):642. doi:10.3390/s16050642
28. Zhu J, Jin GM. Detecting the temperature of ethanol based on Fano resonance spectra obtained using a metal-insulator-metal waveguide with SiO2 branches. Opt Mater Express (2021) 11(9).
29. Wang X, Li H, Zhou J. Asymmetric transmission in a mie-based dielectric metamaterial with fano resonance. Materials (2019) 12(7):1003. doi:10.3390/ma12071003
30. Lu DY, Li W, Zhou H, Cao X, Zhu YH, Wang KJ, et al. Waveguide-coupled surface plasmon resonance sensor for both liquid and gas detections. Plasmonics (2020) 15(4):1123–31. doi:10.1007/s11468-020-01123-9
31. Zhu J, Wang G. Measurement of water content in heavy oil with cavity resonator. Results Phys (2020) 18:103192. doi:10.1016/j.rinp.2020.103192
32. Qiao L, Zhang G, Wang Z, Fen G, Yan Y. Study on the fano resonance of coupling M-type cavity based on surface plasmon polaritons. Opt Commun (2018) 433:144–9. doi:10.1016/j.optcom.2018.09.055
33. Liu X, Li J, Chen J, Rohimah S, Tian H, Wang JF. Independently tunable triple Fano resonances based on MIM waveguide structure with a semi-ring cavity and its sensing characteristics. Opt Express (2021) 29(13):20829–38. doi:10.1364/oe.428355
34. Zhu J, Wang G. Measurement of water content in heavy oil with cavity resonator. Results Phys (2020):103192.
35. Otte MA, Sepúlveda B, Ni W, Juste JP, Lis-Marzan LM, Lechuga LM. Identification of the optimal spectral region for plasmonic and nanoplasmonic sensing. ACS Nano (2009) 4(1):349–57. doi:10.1021/nn901024e
36. Xie C, Yang H, Fang Z, Zhao M. Refractive index sensing based on multiple fano resonances in a split-ring cavity-coupled MIM waveguide. Photonics (2021) 8(11):472. doi:10.3390/photonics8110472
37. Yu Y, Cui J, Liu G, Zhao R, Zhu R, Zhu M, et al. Research on fano resonance sensing characteristics based on racetrack resonant cavity. Micromachines (2021) 12(11):1359. doi:10.3390/mi12111359
38. Li LX, Zong X, Liu Y. All-metallic metasurfaces towards high-performance magneto-plasmonic sensing devices. Photon Res (2020) 8(11):1742–9. doi:10.1364/prj.399926
39. Mai WJ, Wang YL, Zhang YY, Cui NL, Yu L. Refractive plasmonic sensor based on fano resonances in an optical system. Chin Phys Lett (2017) 6(3):024204. doi:10.1088/0256-307x/34/2/024204
40. Cheng L, Wang SY, Wei Q, Yang Y. Nanoscale temperature sensor based on Fano resonance in metal-insulator-metal waveguide. Opt Commun (2017) 384:85–8. doi:10.1016/j.optcom.2016.09.041
41. Khan AD. Refractive index sensing with fano resonant L-shaped metasurface. Opt Mater (2018) 82(82):168–74. doi:10.1016/j.optmat.2018.05.066
42. Mirzanejhad S, Amin G, Esmaeil Daraei M. Numerical study of nanoscale biosensor based on surface plasmon polariton propagation in Mach-Zehnder interferometer structure. Physica B: Condensed Matter (2018) 557(557):141–6. doi:10.1016/j.physb.2018.12.038
43. Wang ZY, Geng ZX, Fang WH. Exploring performance of THz metamaterial biosensor based on flexible thin-film. Opt Express (2020) 28(18):26370. doi:10.1364/oe.402222
44. Xu T, Xu X, Lin Y -S. Tunable terahertz free spectra range using electric split-ring metamaterial. J Microelectromech Syst (20212021) 30(2):309–14. doi:10.1109/jmems.2021.3057354
45. Wen Y, Sun Y, Deng C, Huang L, Hu G, Yun B, et al. High sensitivity and FOM refractive index sensing based on Fano resonance in all-grating racetrack resonators. Opt Commun (2019) 446:141–6. doi:10.1016/j.optcom.2019.04.068
46. Zhu LC, Wu LN, Yang Y. Research on liquid refractive index measured by the optic-fiber surface plasmon wave sensor. J Transcluction Technol (2004) 17(4):675–8.
47. Wu ZY. Experimentally study on high sensitivity fiber optic refractometers based on mach zehnder interference. Guangzi Xuebao (2012) 41(7):841–4. doi:10.3788/gzxb20124107.0841
48. Surve J, Das S, Patel SK, Parmar J, Madhav BTP, Taya SA. Metamaterial-based refractive index sensor using Ge2Sb2Te5 substrate for glucose detection. Microw Opt Technol Lett (2022) 64(5):867–72. doi:10.1002/mop.33204
49. Chen J, Li J, Liu X, Rohimah S, Tian H, Qi D. Fano resonance in a MIM waveguide with double symmetric rectangular stubs and its sensing characteristics. Opt Commun (2021) 482:126563. doi:10.1016/j.optcom.2020.126563
50. Shobhit KP, Surve J, Parmar J, Natesan A, Katkar V. Graphene-based metasurface refractive index biosensor for hemoglobin detection: Machine learning assisted optimization. IEEE Trans nanobioscience (2022). doi:10.1109/TNB.2022.3201237
51. Patel KS, Jaymit S, Vijay K, Juveriya P, Fahad AA, Kawsar A, et al. Encoding and tuning of THz metasurface-based refractive index sensor with behavior prediction using XGBoost regressor. IEEE Access (2022) 10:24797–814. doi:10.1109/access.2022.3154386
Keywords: high-sensitivity, glycerol concentration sensor, fano resonances, MIM waveguide structure, refractive index unit
Citation: Xu Q and Zhu J (2022) Glycerol concentration sensor based on the MIM waveguide structure. Front. Phys. 10:1026494. doi: 10.3389/fphy.2022.1026494
Received: 24 August 2022; Accepted: 11 October 2022;
Published: 17 November 2022.
Edited by:
Yaping Dan, Shanghai Jiao Tong University, ChinaReviewed by:
Shobhitkumar Kiritkumar Patel, Marwadi University, IndiaHuihui Lu, Jinan University, China
Copyright © 2022 Xu and Zhu. This is an open-access article distributed under the terms of the Creative Commons Attribution License (CC BY). The use, distribution or reproduction in other forums is permitted, provided the original author(s) and the copyright owner(s) are credited and that the original publication in this journal is cited, in accordance with accepted academic practice. No use, distribution or reproduction is permitted which does not comply with these terms.
*Correspondence: Jun Zhu, emh1anVuMTk4NUBneG51LmVkdS5jbg==
 Qining Xu1,2
 Jun Zhu