 A.-M. Philippe1*
 C. Sill2
 S. Westermann1J. Allgaier3M. Staropoli1M. Monkenbusch3D. Gerstner2
 Y. Fleming1A. Wischnewski3
 I. Hoffmann4
 P. Zolnierczuk3,5
 C. Do5
 W. Pyckhout-Hintzen3
- 1Materials Research and Technology Department, Luxembourg Institute of Science and Technology, Esch-sur-Alzette, Luxembourg
- 2Goodyear Innovation Center Luxembourg, Colmar-Berg, Luxembourg
- 3Jülich Centre for Neutron Science (JCNS) and Institute for Complex Systems (ICS), Forschungszentrum Jülich GmbH, Jülich, Germany
- 4Institute Laue-Langevin (ILL), Grenoble, France
- 5Neutron Scattering Division, Oak Ridge National Laboratory (ORNL), Oak Ridge, TN, United States
The dynamics of long polymer chains in the presence of nanoparticles have been investigated. The nanocomposites of interest were inspired by tire industry-like rubber materials and consisted of entangled polyisoprene linear chains mixed with chemically pre-treated silica nanoparticles. Combining rheology, dielectric spectroscopy, and neutron spin echo measurements, we measured the modification of the polymer chain dynamics from bulk state to high filler concentration over a broad range of time and length scales. We show that the end-to-end relaxation does not seem to be impacted, whereas the polymer dynamics is significantly slowed down at a very local scale in the presence of nano-fillers. In addition to this length scale dependent different dynamics, additional Neutron Spin Echo spectroscopy experiments and Small Angle Scattering on labelled polymer chains, irreversibly bound to the filler surface and re-dispersed in a fully deuterated matrix, revealed a negligible dynamical behavior of this particular population of localized chains in the rubber layer. The conformational statistics of these chains is that of self-avoiding walk train within a shell that is thinner than the size of the chain. To the best of our knowledge, this work is the first of its kind which measures the single chain form factor in the bound layer of chemically multi-linked chains to the filler surface.
1 Introduction
Because of their various enhanced physical properties and, especially, their superior mechanical properties [1], polymer nanocomposites (PNC) resulting from mixing polymers with various nanoparticles are of high interest to stakeholders in various fields [2] and are, thanks to their performances, particularly relevant for the tire industry. The versatility of such materials arises from the large number of tunable physico-chemical parameters at play. As shown by the recent review by Kruteva and co-workers [3], there is a vast literature on macroscopic mechanical properties and scattering studies on model systems, some of which are listed below. For polymers, the chemical nature as well as the length of the chain [4] or its conformation (linear, branched, etc … ) can be varied. The polymer matrix can be chemically crosslinked and the crosslink density can be adjusted [5]. The matrix can also be a blend of different species [6]. The fillers can be of different chemical nature [7–9], but one widespread species is silica spheres. For one given filler chemistry, three important parameters can be adjusted: the size, in particular the size compared to the polymer chain length [8], the volume fraction of particles [10] and the coating of the nano-particles [11–13]. The precise nature of the interactions is important. On the one hand, there are the filler-filler interactions that can be tuned by controlling the chemical nature of the particle surface. This can be used, for instance, to enhance the dispersion quality of the fillers in the polymer matrix [14] or to tune the morphology of filler assemblies [15]. Large-scale networks of filler aggregates can also form, inducing stronger than expected reinforcement [10]. On the other hand, filler-polymer interactions play a crucial role as well and are microscopically studied in literature on model compounds for different cases as for instance in absence of attraction [16], with attractive interaction tuned by modified end-group of the polymer chain [17] or with a polymer displaying a high glass transition temperature (Tg) grafted on filler surfaces [18]. In addition to these latter, various other experiments on the chain dimension, both in the bulk around active nanoparticles and grafted to the surface, have been published, see e. g. [19–21]. Of particular interest is the work of Liu et. al. [22] who analyzed the scattering of an immobilized silicone rubber in mixed solvent by the contrast-variation method. From the swelling of the shell a clear signature of a thin bound layer could be concluded. All these studies have led to concepts, like grafting and interphase, whose role in the mechanical reinforcement of nanocomposites is still of high interest.
Recently, very valuable efforts to relate the so-called bound rubber to the reinforcement were undertaken by the group of Koga [23]. Using neutron scattering and molecular dynamics simulations in the melt, the interphase between polybutadiene (PB) and carbon black was studied. Their system was based on carbon black that became coated via adsorption with fully hydrogenous PB and which was extracted removing the soluble PB fraction. The so-modified filler was re-dispersed in deuterated PB and delivers the required contrast for neutron scattering. It is well known that the unsaturated double bonds of polybutadiene interact strongly via π- π interactions with the graphitic-like surface of carbon black. Salatto et al. [23] were able to discriminate between a totally immobilized rubber component of about 1 nm thickness and a more disordered fraction of loops, end- and multilinked chains. The dynamics observed via neutron spin echo spectroscopy was assigned to the latter fraction. Our work differs from this microscopic study in that, covalent crosslinking in the form of local vulcanization takes place with pre-functionalized silica particles and, most importantly, in the possibility to measure ideal dilute single chain properties exclusively close to the surface. As far as tires are concerned, the main purpose of exploring different formulations of PNCs is to tune their mechanical properties. The overall macroscopic mechanical behavior of PNCs comes from the polymer melt. On top of that, the addition of nano-fillers modifies specific rheological aspects like increasing both the storage and the loss moduli or shifting crossovers between these moduli [24]. However, one has to keep in mind that the hereby induced modifications are likely to find their microscopic origin on the polymeric side of the material. Indeed, the presence of nanoparticles can modify the dynamical behavior of the polymer chains, which is the key parameter to rheology [8, 25, 26].
In this work, we therefore bring together a series of methods to sustain the enhanced understanding of filled rubbers. We couple rheology, dielectric spectroscopy, small angle scattering and neutron spin-echo spectroscopy to investigate the relationship between the visco-elastic properties of simplified industrial nanocomposites and the dynamic behavior of the polymer chains over a broad range of time and length scales. This is done for filler concentration ranging from 0 up to 2–3 times the percolation threshold. Rather than deepen the evaluation, we focus on the combination and inter-relations of the microscopic techniques. We first describe the experimental results we obtained with the different techniques and provide an overview of the general features of the investigated samples. We then discuss in detail the implications of these results. For the first time, thanks to an especially prepared nanocomposite and only from the isotopic labelling of the bound rubber itself, we show respectively by SANS and NSE the existence of a population of polymer chains that is exclusively localized at the filler surface. This population of chains is found to display a dynamic behavior considerably different from polymer chains belonging to the bulk.
2 Experimental section
2.1 Samples
Protonated (H-PI) and deuterated (D-PI) 1,4 polyisoprene were synthetized through the technique of anionic polymerization. The initiator was sec-butyllithium and the reaction was carried out in n-hexane under high vacuum. It gives highly monodisperse linear polymers with a typical cis/trans ratio of 65/28 depending on the solvent as shown by GPC-LS and H-NMR measurements (see Figure 1 in Supplementary Material). Indeed, deuterated and protonated polymers display a molecular weight of Mn=101.7 kg/mol and 96 kg/mol respectively with corresponding polydispersity indexes of 1.02 and 1.01. Both polymers contained 95.3% of 1,4- isomer. Except three purely deuterated samples, all samples used for neutron scattering experiments were made of a blend of H-PI and D-PI. The polymer blend was obtained by a solvent-mixing preparation method followed by a long drying step under vacuum. The thus prepared polymer blend displays a final composition of 89.7 mol% D-PI and 10.2 mol% H-PI with 0.1 mol% stabilizer (BHT).
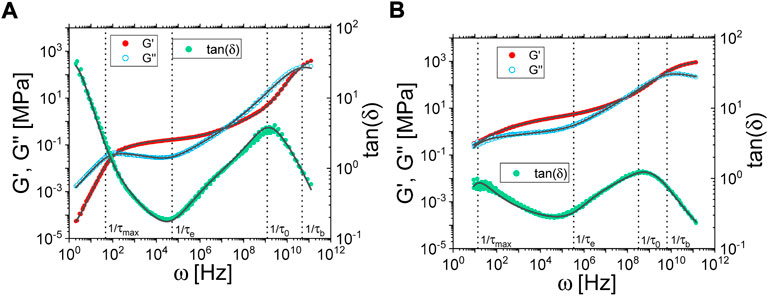
FIGURE 1. (A) and (B) master curves obtained after the horizontal shifting procedure at a reference temperature of 413 K for the neat polymer matrix and the 40 phr Coupsil composite samples respectively. Filled symbols are for the storage modulus G′ and empty symbols are for the loss modulus G’‘. Symbols are experimental data and solid lines are the fit. G′, G″ and tan(δ) are fitted simultaneously. Vertical lines show the characteristic frequencies thus obtained.
We used Coupsil 6109 from Evonik as filler particles. These particles are covered with SI-69, a silane agent also known as TESPT (for Bis(triethoxysilyl (propyl)tetrasulfide). The concentration of covering agent is equal to 8.2% of the mass of silica. SAXS and SANS measurements were used to determine the particle sizes. The particles’ core radius was found to be equal to 12.5 nm with a shell of covering agent of roughly 2 nm thickness. Other particles, Ultrasil VN2 (the parent of Coupsil) displaying the same core radius, but not covered with silane agent, were also used.
Nanoparticles and polymer were mixed by using a cryo-milling apparatus 6870 Freezer/Mill® from SPEX SamplePrep. Nanoparticles and polymer (and silane when appropriate) were weighted, introduced in the polycarbonate tube, and milled in with a stainless-steel rod-shaped impactor at liquid nitrogen temperature until a pulverized sample was achieved. At the end of the milling cycle, the thus produced powder-like mix of nanoparticles and polymer was retrieved from the polycarbonate tube.
After the mixing procedure, the samples were placed in vacuum oven at 160°C and 15 mbar for 20 h in order to promote the silane-polymer bonding. They were then pressed at 80°C and 50 kN and shaped in rectangular pieces of 4x3x0.18 cm3. Finally, they were inserted in Niobium cells between 0.8 mm thick aluminum spacers and sealed under Argon atmosphere. The exhaustive list of samples is provided in Table 1.
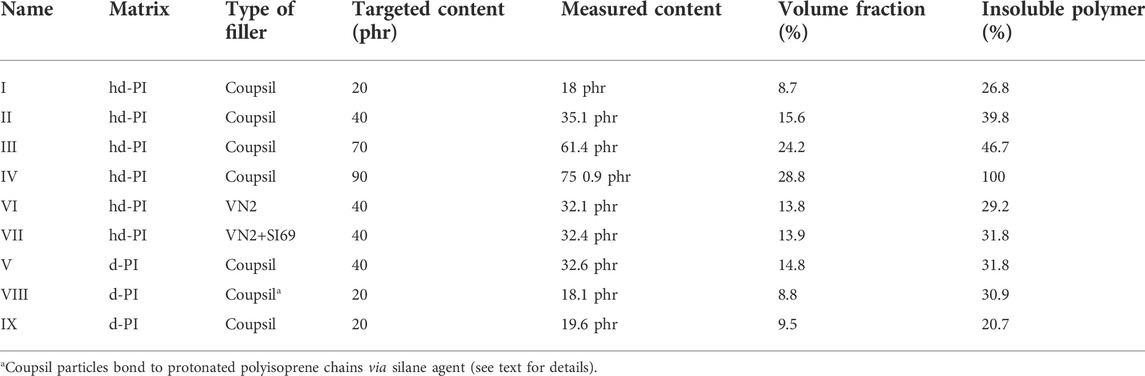
TABLE 1. List of samples.
2.2 Small-angle scattering
Small-Angle Neutron Scattering (SANS) was performed at the EQ-SANS of the Oak Ridge National Laboratory (ORNL) and D11 of the Institut Laue-Langevin (ILL, doi:10.5291/ILL-DATA.CRG-2632) in Grenoble. All measurements were performed at room temperature covering a general scattering vector range between 0.002 and 0.3 Å-1. All SANS data were corrected for container scattering and calibrated to absolute scales with beam-line specific calibrants. All data were systematically corrected for incoherent background in order to exploit the coherent signal only. Additional Small Angle X-ray Scattering (SAXS) measurements were obtained from the Bruker Nanostar U at FZ Jülich covering a comparable range of scattering vectors from 0.005 to 0.3 Å-1. The absolute calibration was only approximate due to the undefined thickness of the samples and the high absorbance of silica.
2.3 Neutron spin-echo measurements
Quasi-elastic experiments were performed at the Neutron Spin-Echo (NSE) instrument IN15 at the Institut Laue Langevin (doi: 10.5291/ILL-DATA.CRG-2632) in Grenoble at temperatures T = 353, 373, 393 and 413 K. We covered a q range of 0.05 < q < 0.13 Å-1 while accessing Fourier times from 0.5 ns to almost 500 ns using a wavelength of λ = 13.5 Å. Additional measurements on both comparable samples and “decorated” bound rubber layer were performed at the SNS-NSE instrument BL-15 of the Oak Ridge National Laboratory at a temperature T = 413K. The same range of q vectors was investigated for Fourier times ranging from 0.05 ns to 70 ns. The data overlapped in good agreement between the two spectrometers. For all samples made of the 10/90 H/D polyisoprene blend, NSE data were corrected for incoherent background so that the intensities in the present article are coherent scattering. In the case of sample VIII, where the H chains concentration is very low, the incoherent background correction was trickier and a dedicated discussion is proposed in Section 3.3.
2.4 Rheology
All samples were measured in Goodyear facilities on an Anton Paar 302 rheometer using a pre-existing measurement protocol (8 mm plate-plate geometry, 1 mm gap size, convection oven temperature control with N2 atmosphere). Applying the Time-Temperature Superposition principle (TTS), rheological master curves were built at a reference temperature (Tref = 213 K) by allowing a simultaneous horizontal (i.e., frequency) shift of both elastic and viscous moduli (G′ and G″ respectively) measured between 0.3 and 100 rad/s at various temperatures ranging from 203 to 353 K and an applied stain of 0.1% for unfilled samples and 0.03% for filled samples. The superposition procedure was achieved numerically with help of the NLREG Software from Freiburg Materials Research Center. When needed, the rheological master curves were shifted to T = 413 K by fitting and extrapolating the numerically determined log aT values with the WLF equation.
2.5 Dielectric spectroscopy
All samples were measured in Goodyear facilities on a Novocontrol Alpha Analyzer. Samples were sandwiched between 30 mm diameter gold coated electrodes and measurements were performed under nitrogen flow. The sample thickness was set to 0.5 mm by placing Teflon spacers between electrodes. Samples were measured between 4x10⁻² and 1x10⁶ Hz with a voltage of 1 V at various temperatures ranging from 173 to 413 K.
At high temperature and low frequency, we observed Maxwell–Wagner–Sillars (MWS) processes and conductivity (resulting in a ω−1 dependency of the dielectric loss factor toward low frequencies). In such case, the response is quite complex and requires more than one Havriliak-Negami function in addition to the conductivity to get a good description of the data. The fit results are thus of high uncertainty. Therefore, we limited our analysis to lower temperatures where contributions of MWS and conductivity are much weaker.
3 Results
3.1 Rheology
As depicted on Figure 1A, B for both the polymer matrix and the 40 phr Coupsil composite, applying the TTS allows building the rheological master curves (see also Figure 2 in Supplementary Material). Rapid inspection of the master curves reveals the typical increase of moduli upon addition of filler, but also noticeable frequency shifts induced by their presence. In the high frequency regime for instance, the crossover between G′ and G″, characteristic of the transition to a glassy behavior, shifts from around 3x10¹¹ rad/s for the polymer matrix, down to 4x10¹⁰ rad/s in the composite case. In order to get a quantitative insight into the dynamic behavior of the polyisoprene chains, rheological data were fitted following the Time Spectrum approach first proposed by Ferry [27] and further developed for composite samples [28–30] (see Eq. 1). This generalized model allows to describe the overall viscoelastic response of the material, without discrimination between contribution of hydrodynamic reinforcement, free and localized polymer chains:
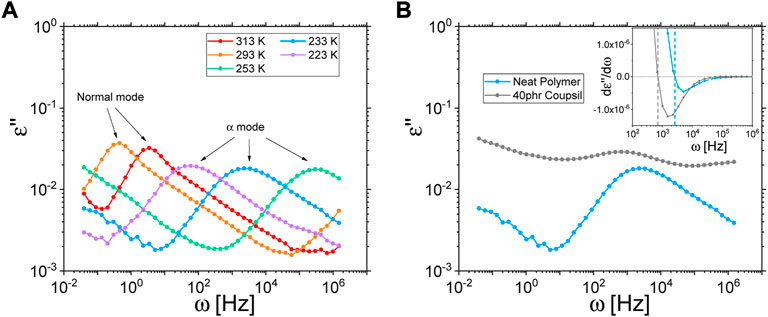
FIGURE 2. (A) Dielectric measurements of the neat deuterated polyisoprene at different temperatures. (B) Comparison of the dielectric response at 233 K of the polymer matrix and a composite sample (filled with 40 phr Coupsil particles). Inset: first derivative of the dielectric permittivity. Vertical dashed lines indicate the frequencies at which the derivative equals 0.
The time spectrum H(τ) (Eq. 2), that can be converted into the corresponding frequency spectrum H(ω) is, a piecewise-defined function describing both the several characteristic times of polymer chains relaxation mechanisms and the frequency dependency of the visco-elastic moduli (τs and γs in Eq. 2). As described in Refs. [29, 30], this generalized model allows free fitting of the values for all exponents of the piecewise power law of the relaxation time spectrum:
While c is he number density of Kuhn segments of polymer chains of interest, the various relaxation times are related to different length scales of these chains. τb and τ0 are respectively associated to the monomer and the Kuhn segment levels. τe reflects the behavior at the entanglement length scale and τmax is related to the so-called terminal flow, a characteristic of the polymer melt mainly governed by the molecular weight of the polymer chain. In summary, the regions thus defined by the piecewise power law are attributed to the following dynamic regimes:
The relaxation times obtained with this model were interpreted as averaged relaxation times of free and localized polymer. All fitting parameters obtained in this study are reported in Table 1 of Supplementary Material.
As displayed in Figure 1A, B, this approach allows fitting the visco-elastic properties of both the neat polymer matrix and composite samples over 12 decades of frequencies. The thus deduced characteristic times (illustrated by the vertical dotted lines on Figure 1) and their evolution with the filler concentration will be discussed later in the discussion section.
3.2 Dielectric spectroscopy
Polyisoprene has the peculiarity to display a dipolar moment that has components both along the chain direction and in the direction perpendicular to the chain [31–33]. Consequently, dielectric spectroscopy allows probing two relaxation mechanisms that are the very local α-relaxation and the end-to-end vector relaxation. Examples of dielectric measurements of the neat polymer at different temperatures are plotted on Figure 2A. One can indeed easily identify two characteristic peaks. Performing measurements around 300 K allows resolving the low frequency peak related to the so-called normal mode whereas cooling down the sample makes the peak related to the α-relaxation fit the accessible frequency window. The shift of the dynamics upon temperature changes will be discussed in detail in the discussion section. On Figures 2A,B comparison of the dielectric response of the polymer matrix and a composite sample is plotted. In the case of the filled sample, the α-relaxation peak is hindered by additional dielectric mechanisms introduced by the presence of the fillers [34, 35]. For large filler content, above 70 phr, it turned out to be impossible to determine the α-peak position. However, and as shown on the inset in Figure 2B for a composite sample filled with 40 phr of Coupsil particles, plotting the first derivative of the dielectric permittivity allowed to unambiguously assess the α-relaxation peak position for not too large filler concentration.
In the presented example, one can already appreciate the frequency shift of the peak position, associated to the α -relaxation mechanism of the polymer chain, in the composite sample filled with 40 phr Coupsil particles. This effect of filler on polymer dynamics was also observed both for smaller (20 phr) and larger (70 phr) filler loading as illustrated on Figure 3. A shift in the α−relaxation is expected to be mirrored in the glass transition temperature as sometimes observed in the literature. As depicted on Figure 3 in Supplementary Material., we indeed found a shift of the glass transition temperature concomitant to the modification of the α-relaxation characteristic time. In addition to the slowing down of the α-relaxation mechanism, we found that the characteristic peak, as probed by dielectric spectroscopy, broadens upon addition of nanoparticles (see inset on Figure 3). This result confirms the recent finding of Musino et al. [33] on polymer nano-composite made of linear styrene-butadiene. Such an evolution is the hallmark of a broadening of the distribution of the α-relaxation time spectrum and might be attributed to the emergence of an increasing population of localized polyisoprene chains whose segmental relaxation process is modified because of their bonding with silane molecules on sites randomly distributed along them.
FIGURE 3. α-relaxation peak of Coupsil samples measured by dielectric spectroscopy at 233 K.
3.3 Neutron scattering
It is expected that contrast-matching conditions between the particles and their surrounding medium cannot be achieved because there are scattering contributions due to inherent scattering length fluctuations inside the filler clusters from either silane chemistry or from polymer inclusions [36]. Therefore, the scattering signal of such composites measured in SANS and NSE consists of several contributions. One of the contributions stems from the contrast between the average silica filler phase and the average polymeric matrix and the other one comes from the contrast between H and D polymer chains inside the polymeric matrix.
The overall scattering signal measured for such a 2-phase, incompressible composite sample thus writes (e. g. Botti and coworkers [37]):
where φpol is the polymer volume fraction in the composite sample, Ipol(q) is the scattering intensity of the pure 10/90 polyisoprene blend, ICompo(q) is the scattering intensity of a composite sample, IFiller(q) is the scattering signal of sample V (Coupsil particles in pure deuterated polyisoprene, see Table 1) and corrected for filler contrast f in h/d polyisoprene by:
Where ρFiller, ρdPI and ρhdPI are the scattering length density of the silica fillers, the pure deuterated polyisoprene and the 10/90 blend of protonated and deuterated polyisoprene respectively. A∼1 is a lumped constant to account for e. g. thickness and/or calibration. We deliberately adjusted the scaling factor A, so that the sum of the polymer and the filler contributions reproduced satisfactorily the measured composite signal. All intensities I(q) contain the neutron contrast factors as discussed before. Such a procedure is exemplified on Figure 4 for sample II. Note that this modelling of the static scattering relies on the experimental evidence that polymer chains remain undisturbed by the presence of nanoparticles so that they always behave as bulk chains, i. e. as ideal Gaussian chain [36, 38]. This is supported by the fact that, in the high q range, the composite signal follows a q−2 slope characteristic of Gaussian polymer chains (see Figure 4). Eq. 3 also applies to the case of SAXS for which the measured intensity is, however, entirely due to the contrast of the filler against the polymer matrix, independent of the fact that the matrix consists of an isotopic H/D mixture. The SAXS contrast bases on the difference between electron densities and does not distinguish between H and D atoms. Thus, the scattering due to fluctuations inside the polymer phase (Ipol(q)) reduces to zero and only the phase scattering, which describes the dilute filler contrasted to the average polymer phase remains
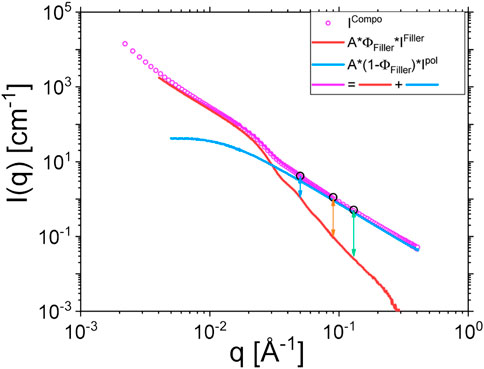
FIGURE 4. Reproduction of composite scattering signal following Eq. 3. The example is given for sample II. Vertical arrows indicate the scattering vector moduli at which the NSE measurements are performed. The extracted filler scattering using the experimental polymer scattering is congruent with independent SAXS scattering experiments. The same details of the silica particle form factor and intraparticle structure factor are visible in the range 0.03 < q < 0.06 Å−1.
Since this study aims at investigating the dynamics of the polymer chains close to silica fillers and farther away into the bulk, we needed to establish a relevant data correction strategy that enabled us to decouple both contributions in the NSE measurements. We assumed that the fillers are immobile and their contribution to the NSE data is an elastic signal, giving rise to a constant non-zero baseline of the dynamic structure factor measured in composite samples. This assumption is indeed supported by the NSE data obtained on sample V (see Figure 5 in Supplementary Material). Following this assumption, we proposed the following correction scheme for the NSE data of composite samples:
where SPol(q,t) and SCompo(q,t) are respectively the polymer and the composite dynamic structure factor. IFiller(q)/ICompo(q) is the relative intensity of the filler scattering in composite samples that has to be subtracted in the same line as assessed from the static coherent SANS and which take into account the different contrast factors. Eq. 5 takes care of the finite (elastic) background level and re-normalizes the dynamic structure factor to 1. The lack of dynamics of the filler implies that Ifiller(q,t)=Ifiller(q,0)=Ifiller(q). The effect of this correction scheme is illustrated on Figure 5 of the Supplementary information.
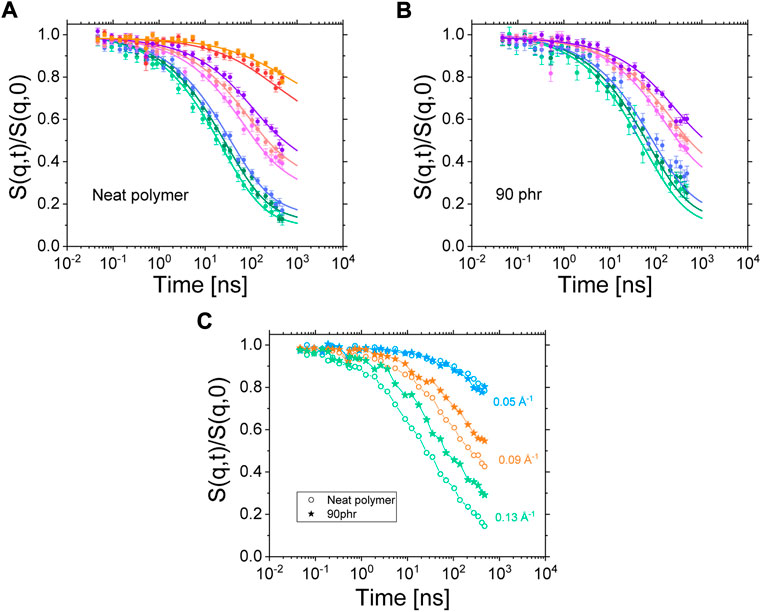
FIGURE 5. (A) fit results of the ISFs of the neat polymer blend. The fit is performed simultaneously on all ISFs gathered at different scattering vectors and different temperatures (only data gathered at 413 K are shown). (B) Result of the fitting procedure applied to the 90 phr Coupsil sample using the same parameters as the ones obtained for the neat polymer. Symbols are data points and solid lines are the fits. (C) ISFs of the neat polymer blend and a 90 phr Coupsil sample at 413K for three selected scattering vectors.
In our experimental conditions, the NSE experiments allow measuring the coherent intermediate scattering function (ISF) S(q,t)/S(q,0) of the dilute hydrogenous polyisoprene chains within their deuterated analogues. In this way, we measured the average dynamics of chains, either belonging to the bulk or being in more restricted configurations in the vicinity of filler surface. Such a measurement is displayed in Figure 5A where the ISFs of the neat polymer blend at different scattering are plotted. A comparison of the Fourier times accessible by NSE with the rheological master curves plotted in Figure 1 shows that the dynamics probed in the studied NSE configuration lies in the semi-flexible regime of the polyisoprene chains (between τ0 and τe).
In literature, NSE data of polymer blends and nanocomposites have been studied through two main models that are the Free Rouse model [39] and the Tube-Reptation model [16]. However, whereas the Free Rouse approach was used to approximate ISFs at very low Fourier Times [40, 41], the tube model only approaches the ISFs at the longest Fourier times where, ideally, a non-zero plateau-like residual correlation is measured [42, 43]. Only recently, a phenomenological approach has been described by Monkenbusch et al. [44]. This model, built on the de Gennes reptation approach [45], but with adapted time and length scales, was found to be able to phenomenologically describe the ISFs of several polymers over the whole Fourier times range observed by NSE spectroscopy by one expression for S(q,t) [44]. Due to the clear non-existence of reptation plateaus, and this despite the extended time range investigated, we chose to use this new approach to model our NSE data of polyisoprene instead of trying to interpret the full dynamic behavior in terms of the tube model. The dynamic structure factor does not fully level off into expected plateaus due to the constraints that other chains cause. The fitting of NSE data was performed by using DATREAT, a software developed internally at the Jülich Centre for Neutron Science. The dynamic structure factor of the neat polymer blend was measured at four different temperatures and eight scattering vectors. For clarity, only the data gathered at 413 K are displayed on Figure 5A. The model only takes parameters that are related to the chemical nature of the polymer so that the same set of parameters must allow fitting all the ISFs obtained with this polymer. Only a time scaling parameter, tscale, can vary to account for the change in temperature between the different sets of data. Note that this parameter is strictly analogous to the log (aT) function derived from the WLF approach. As shown in Figure 5A, this fitting procedure perfectly works on the neat polymer data. First, the model is fully able to reproduce the exact shape of a given ISF over the whole range of accessible Fourier times. In addition, one single set of fitting parameters can account for all the features of the ISFs. It shows unambiguously that a change of temperature only impacts the effective friction felt by the polymer chains and does not modify the relaxation mechanisms causing the decorrelation of the ISFs. Indeed, decreasing the temperature induces a shift of the ISFs toward larger Fourier times (see Figure 6 in Supplmentary Material) thus showing the slowing down of the polymer dynamics accordingly to what we previously observed by rheology and dielectric spectroscopy.
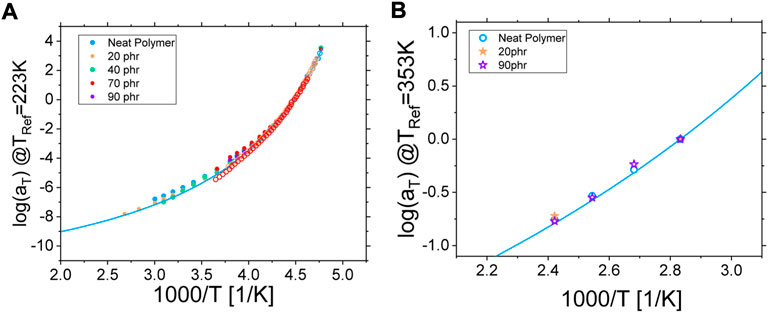
FIGURE 6. (A) Rheological (filled circles) and dielectric (empty symbols) horizontal shifting factor log (aT) plotted as a function of inverse temperature 1000/T for both the neat polymer (blue) and the composite samples. Here, the reference temperature was set to 223 K. The solid blue line is a VFT fit of the α-relaxation of the neat polymer measured by dielectric spectroscopy. (B) NSE horizontal shifting factor log (aT) plotted as a function of inverse temperature 1000/T for both the neat polymer (circles) and the composite samples (stars). Here, the reference temperature was set to 353 K. The solid blue line is an extrapolation of the VFT fit performed on the dielectric data of the neat polymer.
On Figure 5B, the fitting result of the NSE data of the 90 phr Coupsil sample at 413 K is plotted. We were able to fit the ISFs of this composite sample with the set of parameters obtained from the fit of the neat polymer. Only the time shifting parameter tscale was used as a free parameter. This shows that, as far as the NSE measurements are concerned and, at the probed time and length scales, the presence of 90 phr Coupsil does not modify the relaxation mechanisms of the polymer chains in a noticeable way. However, the comparison of the ISFs obtained on the neat polymer and on a composite sample clearly shows the slowing down of the dynamics induced by the presence of the fillers. This is illustrated in Figure 5C for three different scattering vectors. The nanofillers slow down the dynamics of the polyisoprene chains at intermediate and high q values. However, at the lowest scattering vector, the result seems different as no obvious discrepancy between the neat polymer and the composite data is observed. We attributed this latter observation to the NSE data correction scheme that we used. As shown by SANS data displayed in Figure 4, the lower the scattering vector, the higher the filler elastic contribution and thus, the stronger is the correction effect on ISFs. For this reason, and to avoid misinterpretation of the NSE data obtained for composite samples at low scattering vectors, we decided to discard these low q vectors for the rest of the study. As a temporary conclusion, we can already claim that, from the NSE standpoint, the dynamics on the entanglement level remained unchanged over the full concentration range and that the overall shifting scheme and the superposition with the unfilled sample even for such high filling degree exclude the possibility to distinguish between bulk and bound layer polyisoprene dynamics. We will come back to this below.
4 Discussion
4.1 Temperature dependency
The shift in the frequency domain induced by a change of temperature of the polyisoprene matrix was found to be the same for all investigated relaxation mechanisms, whatever experimental technique we used. Indeed, as shown in Figure 6A, the temperature dependency obtained from the building of the rheological master curves (filled symbols) and from the frequency shift of the peak of the α-relaxation in dielectric spectroscopy is the same (empty symbols). Interestingly, this behavior is not affected by the presence of filler and does not depend on the concentration of nanoparticles as the log (aT) parameter of all investigated composite samples superimposes perfectly with the neat polymer case [46]. This is further illustrated by the blue solid line corresponding to a Vogel-Fulcher-Tammann (VFT) fit of the dielectric data of the neat polymer (see Supplementary Material for details).
In a very consistent manner, the same conclusion is found with Neutron Spin Echo (NSE) spectroscopy experiments. One can see in Figure 6B that (i) the log (aT) parameter, corresponding to the shift in Fourier times of the intermediate scattering functions with temperature, is the same for the neat polymer and the composite samples (symbols) and (ii) this temperature dependency found by NSE is the same as the one already found by rheology and dielectric spectroscopy as illustrated by the solid blue line representing the extrapolation to higher temperature of the VFT fit of the latter (see Figure 6A).
Whatever the time scales or the length scales we probed, we found that both the polymeric matrix and the composite samples showed the same shift of the dynamic behavior upon temperature changes. This result was found to be valid for filler volume fraction up to 29% and for a temperature range such as Tg < T < Tg+200 K, Tg being the temperature of the glass transition, close to -60°C for linear polyisoprene [47, 48]). However, and as shown in previous sections, the embedded nanoparticles do have a significant impact on the absolute time scale of the dynamics of the long polyisoprene chains. This influence of the fillers is detailed in the following section.
4.2 Filler impact
As previously explained, the modelling strategy of the rheological data offers the possibility to identify several characteristic times across the whole investigated frequency range (see Figure 1A, B). We briefly showed for one composite sample that the polymer dynamics is slowed down in presence of nanoparticles. In Figure 7, we present the detailed evolution with filler volume fraction of the different characteristic times we obtained from the fitting procedure of rheological data (circles) but also from the α-relaxation peak position measured in dielectric spectroscopy (triangles) and the time shifting parameter deduced from NSE measurements (stars).
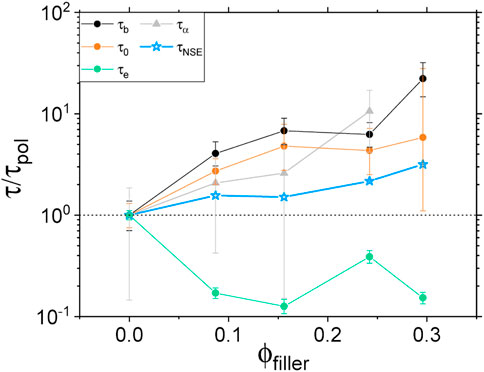
FIGURE 7. Rheological, dielectric and NSE characteristic times (circles, triangles and stars respectively) normalized by the respective neat polymer value τpol and plotted as a function of the volume fraction of fillers. Rheological and NSE data are taken at 413 K and dielectric data at 253 K.
Consider first the parameter τe above which a polymer chain enters the “constrained reptation” regime as described by the de Gennes reptation model [49]. Rheological data show a speeding up of the corresponding relaxation mechanism when going from the neat polymer case to the composite one. However, no systematic trend is observed with increasing filler concentration. This phenomenon could be the result of a shortening of the length of the characteristic polymer strand. Indeed, τe being usually associated to the entanglement length scale, one can imagine that the fillers act as additional topological constrains so that, on average, free polymer strands get shorter. In addition, because Coupsil particles are covered by TESPT molecules acting as a coupling agent, a significant amount of polyisoprene chains is chemically bound to the silica surface. The chemical reaction leading to this silane-polymer bounding is expected to happen randomly along the polyisoprene chain so that, again, this would lead to an effective shortening of the free polymer strand existing between two consecutive topological constrains.
On the other hand, all other investigated relaxation mechanisms were found to slow down with increasing filler concentration. The high frequency regime as investigated by rheology, and associated to τ0 and τb, seems to be highly influenced by the presence of nanoparticles so that the dynamics associated to these small length scales can be 20 times slower than the neat polymer for filler volume fraction around 0.3 (see Figure 7). Changes of τb tend to indicate strong interactions at the monomer level that could be due to an increasing presence of chemical bonds, between polymer chains and fillers, promoted by the coupling agent. Modifications of τ0 indicates an impact of the filler at the Kuhn segment length scale of the polymer, that is a change in the flexibility of the PI chains on the segmental level. Even though it was not possible to properly assess the α-relaxation peak position by dielectric spectroscopy for the highest filler content, the relaxation time related to this mechanism was also found to increase strongly with filler concentration. Finally, the same trend was found by NSE spectroscopy where the ISFs were found to be shifted towards longer Fourier times with increasing filler loading. However, we observed that the slowdown probed by NSE is less pronounced than what we measured with other techniques. We believe that contrary to rheological and dielectric measurements where separate regimes are directly accessible, NSE is sensitive to an average dynamical response stemming from a mix of relaxation mechanisms at the probed time and length scales.
We thus show here the significant impact of filler on relaxation mechanisms of polymer chains at play over a broad range of time and length scales and involved into the visco-elastic behavior of the investigated PNCs.
4.3 Localized polymer chains–chain dynamics
Recently, Ivaneiko and co-worker [28] proposed to interpret the change in visco-elastic properties of polymer nanocomposite upon the addition of filler by the superposition of different contributions that are (i) the reinforcement of the matrix strain induced by rigid particles [50, 51] and (ii) the different dynamical behavior of polymer chains at the filler surface. These localized polymer chains are expected to display altered relaxation mechanisms because of their interaction with the filler surface and have been identified in different studies combining different macroscopic experimental techniques like NMR [52–54], dielectric spectroscopy [34], differential scanning calorimetry [55], XPCS [56] but also numerical simulation approach [57–60]. As discussed above, a striking feature of the Coupsil composite samples is the broadening of the peak of the α-relaxation with increasing filler concentration (see Figure 3). Such an evolution was attributed to a broadening of the distribution of the α-relaxation time spectrum likely to find its origin in the emergence of an increasing population of localized polymer chains at the filler surface. In addition, and as detailed in Table 1, the amount of non-soluble polymer goes from 0% in the neat polymer case; up to 100% for the highest Coupsil content. One can also see in Table 1 that samples with comparable amount of filler of different types (VN2 or VN2+SI69) display smaller amount of insoluble polymer than the Coupsil sample.
In addition, and as shown on Figure 8, we found that (i) the peak of the α-relaxation is shifted for composites made of both Coupsil and VN2 with silane and (ii) this peak is not shifted for composite filled with VN2 without silane and occurs at the same frequency than the neat polymer matrix. This demonstrates the effective role played by the silane agent in promoting the coupling between the fillers and the polymer chains of the matrix. This experimental observation combined with the broadening of α-peak measured by dielectric spectroscopy points to the existence, in our samples, of two distinct populations of polymer chains as suggested in literature. The first type of chains would be the bulk ones that are not impacted by the presence of filler. The second type of polymer chains would then be the one whose dynamical behavior is modified upon addition of nanoparticles because they “live” in the vicinity of the filler surface and are bonded to them via the silane agent decorating the particles. Due to the presence of sulfur only through the silane on the surface of the filler we conclude that any effect of constrained dynamics must be primarily linked to the immediate polymeric layer around the filler and not to additional crosslinking in the bulk.
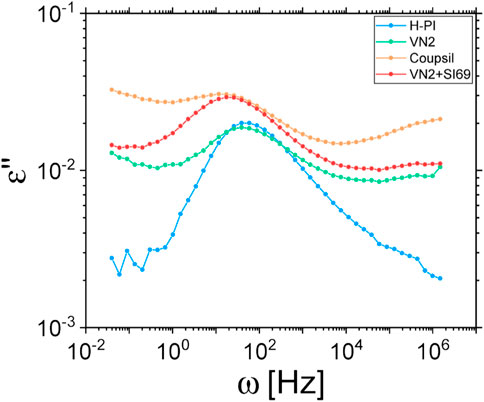
FIGURE 8. Alpha relaxation of the neat polyisoprene matrix and different filler types, with or without silane coupling agent, measured by dielectric spectroscopy at 223 K.
We thus tried to explore this hypothesis further with complementary samples. Instead of using the pre-grafted Coupsil particles, we used Ultrasil VN2 particles. These particles correspond to the silica core of the Coupsil particles without attached silane. We prepared two new samples made of 40 phr particles embedded in a 10/90 protonated/deuterated polyisoprene chains blend. In one of these samples, we also added 9 phf of SI69, the same silane agent that covers Coupsil particles. The ISFs function measured at 413 K for these three samples are plotted in Figure 9. They all overlap perfectly. This is quite surprising as, for instance, these samples display different amount of non-soluble polymer (see Table 1) as well as different position of their peak of the α-relaxation. It shows that, from the NSE standpoint, the way the polymer dynamics is modified in these composites does not depend on the precise nature of the filler-polymer interactions but only on the filler concentration. This experiment tends to confirm that, in the presented experimental conditions, NSE spectroscopy did not resolve the very details of the polymer dynamics, but instead probed an average effect of nano-fillers.
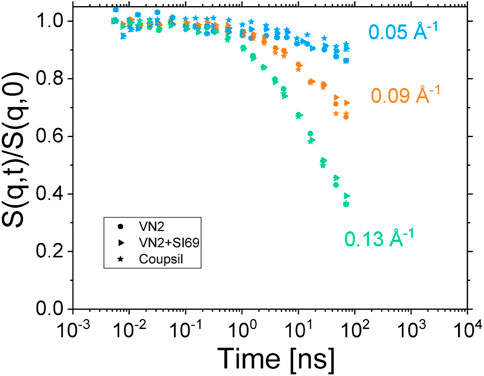
FIGURE 9. ISFs measured at 413 K for samples made of 40 phr Coupsil (stars), VN2 (circles) and VN2+SI69 (triangles) particles. Colours are for the different scattering vectors indicated on the graph.
In this context, we found it interesting to confront the dynamic behavior measured by NSE to the hydrodynamic reinforcement induced by fillers as predicted by the most common approaches found in literature. Since the pioneering work of Einstein [61], it is known that the presence of spherical particles leads to an increase of the viscosity η of a suspension following:
where η0 is the viscosity of the suspending medium and φ is the volume fraction of particles (note that it has nothing to do with φpol, the volume fraction of the polymer in Eq. 3). This relationship holds for volume fraction up to 2–3% and was adapted for volume fraction up to 10% by Batchelor [62] as follows:
Interestingly, similar expressions were described for the case of incompressible linear elastic solid (see e.g. [63, 64]). To account for the non-linearity of constitutive equations describing a polymer melt filled with non-aggregating hard spheres, Domurath and coworkers adopted a Stress-Strain Amplification (SSA) approach and came up with the following expression [50, 51]:
where as and ad are the stress and the strain amplification factors respectively and writes:
As illustrated in Figure 10, we found that the dynamic behavior measured by NSE compares rather well to the hydrodynamic reinforcement predicted by the SSA approach. This illustrates the idea that, in the present configuration, the NSE experiments only allow probing an overall effect of the nanofillers on the polymer chains dynamics but is not well suited to discriminate between populations of polyisoprene chains displaying different dynamic behavior.
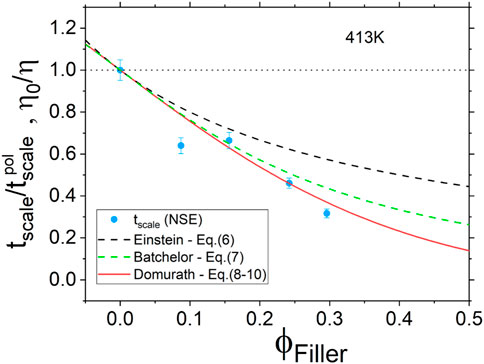
FIGURE 10. Hydrodynamic reinforcement as a function of filler volume fraction. Blue circles are for the time shifting parameter tscale measured by NSE at 413 K. Lines are for phenomenological approaches described by Eqs 6–10 of Section 3.3.
Unfortunately, despite clear hints of the coexistence of bulk-like and localized polymer chains, NSE spectroscopy was not able to unambiguously shed light on these two distinct populations. To address this question, we decided to run additional measurements with two new samples. One sample (sample IX) was comprised of 20 phr Coupsil particles in deuterated polyisoprene matrix and served as a reference sample. For the second sample (Sample VIII), we designed a sample with labelled decoration, bound to the filler surface, in order to study mainly these localized chains. The degree of H/D chains in this layer is supposed to be the same as in the bulk from which the coated fillers were extracted (10/90 ratio of H and D chains). If the filler would have been matched out, the scattering signal would have stemmed exclusively from the contrast of these localized chains surrounded by deuterated bulk chains. Indeed, cross-terms with the silica filler only vanish if the scattering length density of the average polymer one is met. If not, both the particle form factor and cross-terms contribute. The Random Phase Approximation (RPA) scattering theory, however, is difficult to apply because the decorated particles are phase-separated in the D-matrix, the silica core themselves are phase-separated from the H/D-labeled coat, and only H and D chains can be considered ideally mixed in the layer. This makes a full analysis, both statically and dynamically, extremely complex. To do so, the Coupsil particles initially mixed and bound with the 10/90 H/D polyisoprene were extracted by dissolution of the non-bound portion of formerly used composite samples and re-mixed in a fully deuterated polyisoprene matrix. In this new sample, made with 20 phr of the thus extracted particles, the amount of hydrogenous polyisoprene chains was estimated, from Thermo-Gravimetric Analysis (TGA), to be between 2 and 3% of the total polymer content. It can be safely assumed that the H/D content of the attached polymer mixture is identical to that of the matrix blend (10/90 ratio) from which the as such coated particle was isolated. Note, however, that the very low content in H poses a challenge to SANS and especially NSE studies and corrections become questionable. The situation comes close to the dynamic structure factor of crosslinked chains. Indeed, the bound layer chains are multi-anchored to the filler surface by means of the silane agent and extend to an unknown distance away from the surface. The sample preparation method, however, already has some implications. On one hand, the chains were initially mixed in an undisturbed theta state and thus attached to fillers in this state, on the other hand, the solvent extraction method is believed to remove all non-linked chains. Consequently, upon re-dispersion in a matrix made of deuterated long polyisoprene chains, re-interpenetration is unlikely to occur but, instead, the rubber layer is prone to be hydrodynamically compressed to fill up the left-over voids.
The intermediate scattering functions of both the labelled composite (sample VIII) and the non-labelled one (sample I) are displayed on Figure 11. Because of the very low protonated PI chains content of the composite sample, only the highest scattering vector was safely corrected from the elastic scattering contribution of the silica particles (see Figure 7B in Supplementary Material for details). It is worth noticing that the ISF of sample VIII does not start from 1 at low Fourier times. This again, may be a consequence of the low content in protonated polyisoprene chains. The measure of the low coherent intensity stemming from these latter may indeed suffer from coherent/incoherent mixing. Fast coherent dynamics (out of the NSE Fourier times) may also be present. Such a fast relaxation mechanism could be related, amongst other phenomena, to water molecules adsorbed at the silica surface (see e.g. Ref. [35]) or to a fast motion of the short protonated silane molecules decorating the Coupsil particles. Both the unavoidable background subtraction difficulty or a fast coherent dynamics would result in a reduced amplitude of the ISF, and further experimental investigations would be required to elucidate this aspect. In any case, none of these processes would affect the decorrelation time of the measured ISF over several order of magnitude. We thus believe that the time-independence of the ISF of the labelled sample reported on Figure 11 is fully reliable.
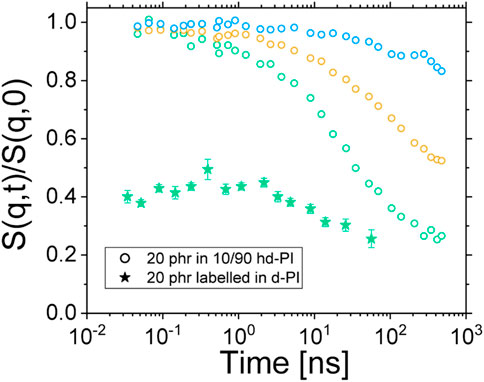
FIGURE 11. ISFs of sample I (empty circles) and sample VIII (filled stars). Blue, orange and green circles are for q = 0.05, 0.09 and 0.13 Å−1 respectively. Green stars are for q = 0.135 Å−1.
The most interesting feature of the ISF of sample VIII, however, appears when it is compared to the ISFs of the non-labelled particles in 10/90 H/D-PI (sample I). Indeed, one can see on Figure 11 that the bound polymer chains do not display any dynamics in the accessible Fourier times. This is a striking result as, concomitantly, we show that the ISFs of the non-labelled Coupsil particles display a significant decorrelation in the investigated Fourier times. Indeed, this experimental observation eventually demonstrates the existence of a population of polymer chains localized at the filler surface displaying a dynamical behavior significantly different from the one of the bulk-polymer chains. In order to be due to the different dynamics of the chain in the rubber layer, an initial relaxation within the nanoseconds range must have been visible. Since this is completely absent in the present experimental data, also the Des Cloizeaux dynamic structure factor estimation for crosslinked chains–giving plateaus–is not applicable. The lack of dynamics thus points at highly localized chains that are glued to the surface. The analysis of the normal mode relaxation probed by dielectric spectroscopy further confirmed this finding. As shown on Figure 12, looking at the second derivative of ε’’ allows circumventing the difficulty in locating the peak position of the normal mode of composite samples. Acknowledging the uncertainty of this method, it remains fair to say that the position of the peak of the normal mode relaxation is not shifted in a systematic way, upon increasing the filler concentration (see inset of Figure 12.) Together with the labelled NSE study discussed above, we interpret these results in the way that the full-chain relaxation of the localized polymer at the filler surface is suppressed and only the normal mode of the free polymer is observed.
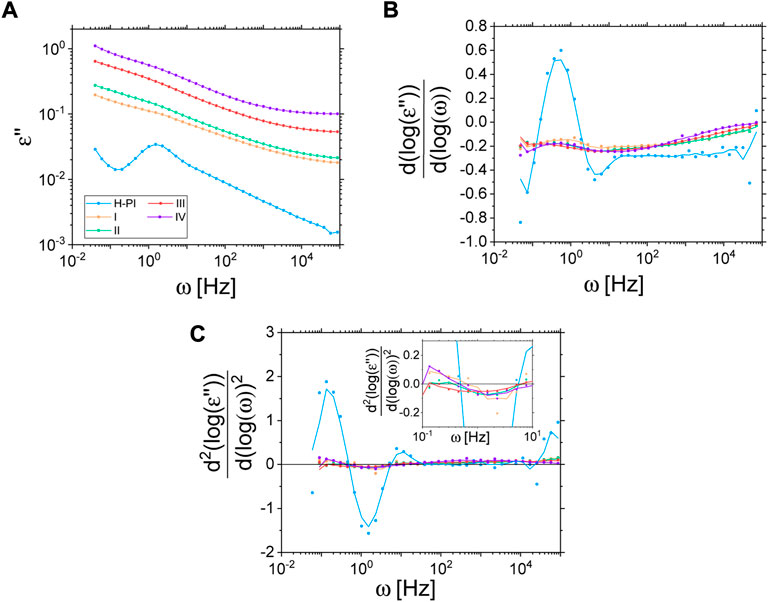
FIGURE 12. Imaginary part of the permittivity (A) and its first (B) and second derivative (C) for various samples at 313 K (solid lines for derivatives are a moving average over 3 data points to reduce noise as a guide for the eye). Insert in Cshows a zoom in the region of interest.
4.4 Localized polymer chains–chain conformation
Despite the complexity of the last sample VIII, and because of the interesting missing dynamics in NSE, we aimed to resolve static details of the conformation of the multi-anchored chains inside the rubbery layer of the filler. Figure 13 summarizes the results. As displayed on Figure 13A, both samples VIII and IX scatter rather similarly in SAXS where basically only the silica is seen, X-rays being insensitive to the H/D labeling. Small differences in filling degree and structure of the clusters are inherent and are unavoidably related to the preparation of an original Coupsil and rubber-coated-Coupsil particles in the melt. This affects the size as well as the composition of the clusters itself. SANS of samples IX and VIII differ in a similar way but VIII clearly shows excess coherent intensity at the highest q range, coming from the labeled coat (see Figure 13B). In the same assumption of adding incoherently the scattering of filler and polymer, after correction with the same factors as for SAXS, the subtraction of a weighted sample IX-scattering from VIII should yield the formfactor of the dilute hydrogenous chain inside the rubber layer. Whereas it is clear that both samples have different aggregation histories we cannot get rid of the silica scattering in the low-to-intermediate scattering vector range, i. e. for 0.01 < q < 0.017 Å−1. The excess coherent scattering can thus only be estimated trustworthy if the parasitic silica scattering is low enough compared to the chain scattering.
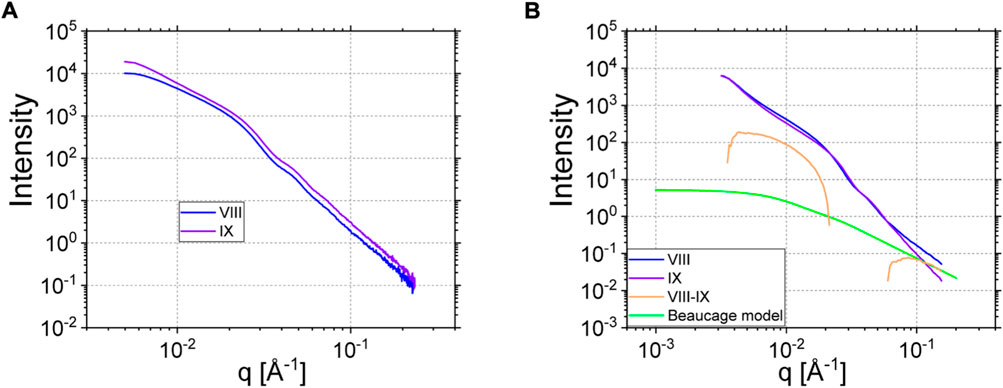
FIGURE 13. (A) SAXS data of sample VIII and IX. (B) SANS data of sample VIII and IX (same color as in A). The orange curve is the subtraction of IX from VIII. The green solid line corresponds to the Beaucage (Eq. 15) describing the excess scattering of hydrogenous polymer chains in the high q region (see text for details).
The as-such extracted polymer scattering of the rubber layer follows a clearly different q-dependence qα with α = -(1.75 ± 0.10), which does not correspond to the expectation for Gaussian chains. Since the exponent can be identified with the statistics of the chain conformation with α =1/ν, ν being the Flory exponent (ν = 0.5 for Gaussian chains, and ∼3/5 for excluded volume chains), the present case leads to ν = (0.57 ± 0.02) which is nearly the characteristic value for a self-avoiding walk like in good solvent. We try to rationalize as following: generalizing the Gaussian result for intra-chain distances with the Flory exponent ν, and statistical segment length a, one obtains for any intrachain distance between monomers i and j:
And for the radius of gyration:
where N is the number of monomers of the chain. For self-avoiding walk trains, simulation finds:
With either equations the size of the chain in the apparently immobilized layer is ∼210 Å, thus larger than 110 Å, the size in the theta state [65]. If the chain is ∼2D due to the anchoring to the silica surface, the Rg is lowered as:
and thus ends up being of the order of 170 Å. The theoretically calculated curve for such a self-avoiding walk with trains is shown in Figure 13B where a radius of gyration Rg of 170 Å is used. The experimental Flory exponent was assumed and the forward scattering at q = 0 was fixed to the expected one, based on the 10/90 H/D blend. The curve is the classical Beaucage function:
No direct information on the size of the certainly somewhat compressed chain due to the preparation leading to self-avoidance due to volume conservation in the low q level is available. In reality, it is hard to expect that chains will adopt perfect bi-dimensionality and therefore the own steric interactions will lead towards chain dimensions in between our two estimates of 170 and 213 Å. These results, however, are the first to our knowledge of the conformational statistics in absorbed layers and will trigger further studies. The rather low fraction of hydrogenous labels is entirely related to the NSE experiment but could be increased without loss of generality if one concentrated on the static SANS only.
We mention that the same q-dependence at high q was found earlier in model nanocomposites of silica and PEO which show absorption of chains directly on the silica surface via OH-H attractive interactions [17].
5 Conclusion
We chose to concentrate our efforts on very specific type of samples. We decided to work on simplified industrial nanocomposites made of Coupsil Silica filler particles embedded in a matrix of linear chains of polyisoprene because we wanted our samples to be representative of actual tire formulations (especially in terms of filler-polymer interaction) while requiring them to provide reliable neutron scattering data. All our conclusions are thus related to this set of samples and further investigations will be required to confront them to different cases like for instance, composite materials based on different rubbers, potentially including polymer-polymer crosslinks, or filled with other type of nanofillers.
In the present study we found that nano-fillers do not modify the shift of dynamic behavior upon temperature changes of any of the investigated relaxation mechanisms. However, they do slow down the dynamics at time and length scales below the entanglement regime. This impact on the polymer chain dynamics was found to be more and more pronounced with increasing filler concentration up to 30% in volume fraction.
The polymer dynamics probed by NSE were found to reflect a mix of dynamical contributions without allowing to discriminate among them. Conversely, rheology and dielectric spectroscopy, as they probe very specific relaxation mechanisms, showed a more pronounced slowing down effect induced by the presence of the fillers. In particular, we showed that the α-relaxation was strongly impacted by the presence of fillers, which was unexpected based on our literature research [46, 66–68]. To elucidate the reason why our findings are different from literature, additional studies are necessary to systematically examine each of the differences between the investigated systems. These include for example presence of crosslinks, polymer type, polymer molecular weight, nanoparticle type or presence of additives.
In addition, we explained the broadening of the peak of the α -relaxation by the stretching of the distribution of relaxation times. This occurs concomitantly with the increase of the part of non-soluble polymer with increasing filler concentration. We thus performed additional NSE measurements with labelled protonated polyisoprene chains bound to the fillers and embedded in a fully deuterated matrix in order to shed light on the dynamic behavior of localized polymer chains. We indeed proved that, even at a small concentration of filler (around 8% in volume), the polyisoprene chains bound to the filler surface via the silane agent do not show any dynamics in the Fourier times investigated in this study. This behavior is in stark contrast with the significant dynamics observed for bulk chains at the same filler concentration. We thus demonstrated the existence of a population of localized polymer chains whose dynamics are profoundly altered as compared to the free polymer chains within the bulk. In this regard, it is interesting to recall that, at the highest filler content investigated in this study (filler volume fraction around 30%), it was found that polymer chains were still able to relax, in the sense that they always displayed a measurable dynamics either by rheology or NSE, despite the absence of soluble polymer (see Table 1). We can thus conclude that the localized polymer chains population identified by NSE is part of the non-soluble polymer but that this latter is also composed of polymer chains still contributing to the dynamical response of the material but confined and trapped within fillers’ high order structures.
Data availability statement
The original contributions presented in the study are included in the article/Supplementary Materials, further inquiries can be directed to the corresponding author.
Author contributions
AP, CS, DG, YF and WP contributed equally to this work by preparing samples, running rheology, dielectric, TGA, SAXS and non-soluble polymer measurements. They wrote the present article. MS, IH, PZ and CD performed SANS and neutron spin-echo measurements. JA synthetized the polyisoprene polymer. MM and AW helped in modeling and interpreting the NSE data. SW initiated this work and proofread it.
Funding
The present study was supported by the Luxembourg National Research Fund (FNR) through an Industrial Partnership Block Grant (IPBG16/11514551/TireMat-Tech).
Acknowledgments
A portion of this research used resources at the Spallation Neutron Source, a DOE Office of Science User Facility operated by the Oak Ridge National Laboratory. Authors would like to thank ORNL, ILL and JCNS for providing them with precious beam time on SANS and Spin-echo instruments. We also thank Sylvain Prevost of the ILL for complementary SANS measurements. We thank Evonik for the supply of the Coupsil particles used in this study.
Conflict of interest
The authors declare that the research was conducted in the absence of any commercial or financial relationships that could be construed as a potential conflict of interest.
Publisher’s note
All claims expressed in this article are solely those of the authors and do not necessarily represent those of their affiliated organizations, or those of the publisher, the editors and the reviewers. Any product that may be evaluated in this article, or claim that may be made by its manufacturer, is not guaranteed or endorsed by the publisher.
Supplementary material
The Supplementary Material for this article can be found online at: https://www.frontiersin.org/articles/10.3389/fphy.2022.1023234/full#supplementary-material
References
1. Naskar AK, Keum JK, Boeman RG. Polymer matrix nanocomposites for automotive structural components. Nat Nanotechnol (2016) 11:1026–30. doi:10.1038/nnano.2016.262
2. Kumar SK, Benicewicz BC, Vaia RA, Winey KI. 50th anniversary perspective: Are polymer nanocomposites practical for applications? Macromolecules (2017) 50(3):714–31. doi:10.1021/acs.macromol.6b02330
3. Kruteva M, Genix AC, Holderer O, Oberdisse J. Recent scattering approaches to structure and dynamics of polymer nanocomposites. Front Soft Matter (2022) 2:992563. doi:10.3389/frsfm.2022.992563
4. Genix A-C, Bocharova V, Kisliuk A, Carroll B, Zhao S, Oberdisse J, et al. Enhancing the mechanical properties of glassy nanocomposites by tuning polymer molecular weight. ACS Appl Mater Inter (2018) 10(39):33601–10. doi:10.1021/acsami.8b13109
5. Park S-J, Cho K-S. Filler–elastomer interactions: Influence of silane coupling agent on crosslink density and thermal stability of silica/rubber composites. J Colloid Interf Sci (2003) 267(1):86–91. doi:10.1016/s0021-9797(03)00132-2
6. Gambino T, Alegria A, Arbe A, Colmenero J, Malicki N, Dronet S, et al. Applying polymer blend dynamics concepts to a simplified industrial system. A combined effort by dielectric spectroscopy and neutron scattering. Macromolecules (2018) 51(17):6692–706. doi:10.1021/acs.macromol.8b00881
7. Bitinis N, Hernandez M, Verdejo R, Kenny JM, Lopez-Manchado MA. Recent advances in clay/polymer nanocomposites. Adv Mater (2011) 23(44):5229–36. doi:10.1002/adma.201101948
8. Cheng S, Xie SJ, Carrillo JMY, Carroll B, Martin H, Cao PF, et al. Big effect of small nanoparticles: A shift in paradigm for polymer nanocomposites. ACS nano (2017) 11(1):752–9. doi:10.1021/acsnano.6b07172
9. Bhowmik D, Pomposo JA, Juranyi F, Garcia-Sakai V, Zamponi M, Su Y, et al. Microscopic dynamics in nanocomposites of poly(ethylene oxide) and poly(methyl methacrylate) soft nanoparticles: A quasi-elastic neutron scattering study. Macromolecules (2014) 47(1):304–15. doi:10.1021/ma402023n
10. Baeza GP, Genix AC, Degrandcourt C, Petitjean L, Gummel J, Couty M, et al. Multiscale filler structure in simplified industrial nanocomposite silica/SBR systems studied by SAXS and TEM. Macromolecules (2013) 46(1):317–29. doi:10.1021/ma302248p
11. Baeza GP, Genix AC, Degrandcourt C, Petitjean L, Gummel J, Schweins R, et al. Effect of grafting on rheology and structure of a simplified industrial nanocomposite silica/SBR. Macromolecules (2013) 46(16):6621–33. doi:10.1021/ma401016d
12. Liu S, Senses E, Jiao Y, Narayanan S, Akcora P. Structure and entanglement factors on dynamics of polymer-grafted nanoparticles. ACS Macro Lett (2016) 5(5):569–73. doi:10.1021/acsmacrolett.6b00089
13. Sharma A, Kruteva M, Zamponi M, Ehlert S, Richter D, Forster S. Influence of molecular weight on the distribution of segmental relaxation in polymer grafted nanoparticles. Phys Rev Mater (2022) 6(1):L012601. doi:10.1103/physrevmaterials.6.l012601
14. Akcora P, Kumar SK, Moll J, Lewis S, Schadler LS, Li Y, et al. Gel-like” mechanical Reinforcement in polymer nanocomposite melts. Macromolecules (2010) 43(2):1003–10. doi:10.1021/ma902072d
15. Akcora P, Liu H, Kumar SK, Moll J, Li Y, Benicewicz BC, et al. Anisotropic self-assembly of spherical polymer-grafted nanoparticles. Nat Mater (2009) 8:354–9. doi:10.1038/nmat2404
16. Schneider GJ, Nusser K, Willner L, Falus P, Richter D. Dynamics of entangled chains in polymer nanocomposites. Macromolecules (2011) 44(15):5857–60. doi:10.1021/ma200899y
17. Glomann T, Hamm A, Allgaier J, Hubner EG, Radulescu A, Farago B, et al. A microscopic view on the large scale chain dynamics in nanocomposites with attractive interactions. Soft Matter (2013) 9(44):10559. doi:10.1039/c3sm51194d
18. Senses E, Faraone A, Akcora P. Microscopic chain motion in polymer nanocomposites with dynamically asymmetric interphases. Sci Rep (2016) 6:29326. doi:10.1038/srep29326
19. Robbes A-S, Cousin F, Meneau F, Dalmas F, Schweins R, Gigmes D, et al. Polymer-grafted magnetic nanoparticles in nanocomposites: Curvature effects, conformation of grafted chain, and bimodal nanotriggering of filler organization by combination of chain grafting and magnetic field. Macromolecules (2012) 45(22):9220–31. doi:10.1021/ma301927e
20. Robbes A-S, Cousin F, Meneau F, Jestin J. Melt chain conformation in nanoparticles/polymer nanocomposites elucidated by the SANS extrapolation method: Evidence of the filler contribution. Macromolecules (2018) 51(6):2216–26. doi:10.1021/acs.macromol.7b02318
21. Zhou Y, Yavitt BM, Zhou Z, Bocharova V, Salatto D, Endoh MK, et al. Bridging-controlled network microstructure and long-wavelength fluctuations in silica–poly (2-vinylpyridine) nanocomposites: Experimental results and theoretical analysis. Macromolecules (2020) 53(16):6984–94. doi:10.1021/acs.macromol.0c01391
22. Liu D, Chen J, Song L, Lu A, Wang Y, Sun G. Parameterization of silica-filled silicone rubber morphology: A contrast variation SANS and tem study. Polymer (2017) 120:155–63. doi:10.1016/j.polymer.2017.05.064
23. Salatto D, Carrillo JMY, Endoh MK, Taniguchi T, Yavitt BM, Masui T, et al. Structural and dynamical roles of bound polymer chains in rubber reinforcement. Macromolecules (2021) 54(23):11032–46. doi:10.1021/acs.macromol.1c01239
24. Nusser K, Schneider GJ, Richter D. Rheology and anomalous flow properties of poly(ethylene-alt-propylene)–silica nanocomposites. Macromolecules (2013) 46(15):6263–72. doi:10.1021/ma3025927
25. Mangal R, Wen YH, Choudhury S, Archer LA. Multiscale dynamics of polymers in particle-rich nanocomposites. Macromolecules (2016) 49(14):5202–12. doi:10.1021/acs.macromol.6b00496
26. Richter D, Kruteva M. Polymer dynamics under confinement. Soft Matter (2019) 15(37):7316–49. doi:10.1039/c9sm01141b
28. Ivaneiko I, Toshchevikov V, Stockelhuber K, Saphiannikova M, Heinrich G. Superposition approach to the dynamic-mechanical behaviour of reinforced rubbers. Polymer (2017) 127:129–40. doi:10.1016/j.polymer.2017.08.051
29. Ivaneiko I, Toshchevikov V, Saphiannikova M, Stockelhuber K, Petry F, Westermann S, et al. Modeling of dynamic-mechanical behavior of reinforced elastomers using a multiscale approach. Polymer (2016) 82:356–65. doi:10.1016/j.polymer.2015.11.039
30. Saphiannikova M, Toshchevikov V, Gazuz I, Petry F, Westermann S, Heinrich G. Multiscale Approach to dynamic-mechanical analysis of unfilled rubbers. Macromolecules (2014) 47(14):4813–23. doi:10.1021/ma501159u
31. Adachi K, Kotaka T. Influence of entanglement on the dielectric normal mode process of cis-polyisoprene. Macromolecules (1984) 17(1):120–2. doi:10.1021/ma00131a023
32. Imanishi Y, Adachi K, Kotaka T. Further investigation of the dielectric normal mode process in undiluted cis‐polyisoprene with narrow distribution of molecular weight. J Chem Phys (1988) 89(12):7585–92. doi:10.1063/1.455244
33. Musino D, Oberdisse J, Farago B, Alegria A, Genix AC. Resolving segmental polymer dynamics in nanocomposites by incoherent neutron spin–echo spectroscopy. ACS Macro Lett (2020) 9:910–6. doi:10.1021/acsmacrolett.0c00369
34. Baeza GP, Oberdisse J, Alegria A, Saalwachter K, Couty M, Genix AC. Depercolation of aggregates upon polymer grafting in simplified industrial nanocomposites studied with dielectric spectroscopy. Polymer (2015) 73:131–8. doi:10.1016/j.polymer.2015.07.045
35. Cerveny S, Schwartz GA, Otegui J, Colmenero J, Loichen J, Westermann S. Dielectric study of hydration water in silica nanoparticles. J Phys Chem C (2012) 116(45):24340–9. doi:10.1021/jp307826s
36. Botti A, Pyckhout-Hintzen W, Richter D, Urban V, Straube E, Kohlbrecher J. A microscopic look at the reinforcement of silica-filled rubbers. J Chem Phys (2006) 124(17):174908. doi:10.1063/1.2191048
37. Botti A, et al. Silica filled elastomers: Polymer chain and filler characterization in the undeformed state by a SANS-SAXS approach, 44 (2003). p. 7505–12.
38. Sen S, Xie Y, Kumar SK, Yang H, Bansal A, Ho DL, et al. Chain conformations and bound-layer correlations in polymer nanocomposites. Phys Rev Lett (2007) 98(12):128302. doi:10.1103/physrevlett.98.128302
39. Glomann T, Schneider GJ, Allgaier J, Radulescu A, Lohstroh W, Farago B, et al. Microscopic dynamics of polyethylene glycol chains interacting with silica nanoparticles. Phys Rev Lett (2013) 110(17):178001. doi:10.1103/physrevlett.110.178001
40. Richter D, Ewen B, Farago B, Wagner T. Microscopic dynamics and topological constraints in polymer melts: A neutron-spin-echo study. Phys Rev Lett (1989) 62(18):2140–3. doi:10.1103/physrevlett.62.2140
41. Wischnewski A, Monkenbusch M, Willner L, Richter D, Kali G. Direct observation of the transition from free to constrained single-segment motion in entangled polymer melts. Phys Rev Lett (2003) 90(5):058302. doi:10.1103/physrevlett.90.058302
42. Gold B, Pyckhout-Hintzen W, Wischnewski A, Radulescu A, Monkenbusch M, Allgaier J, et al. Direct assessment of tube dilation in entangled polymers. Phys Rev Lett (2019) 122(8):088001. doi:10.1103/physrevlett.122.088001
43. Malo de Molina P, Alegria A, Allgaier J, Kruteva M, Hoffmann I, Prevost S, et al. Tube dilation in isofrictional polymer blends based on polyisoprene with different topologies: Combination of dielectric and rheological spectroscopy, pulsed-field-gradient NMR, and neutron spin echo (NSE) techniques. Macromolecules (2020) 53(14):5919–36. doi:10.1021/acs.macromol.0c00045
44. Monkenbusch M, Kruteva M, Zamponi M, Willner L, Hoffman I, Farago B, et al. A practical method to account for random phase approximation effects on the dynamic scattering of multi-component polymer systems. J Chem Phys (2020) 152(5):054901. doi:10.1063/1.5139712
45. De Gennes P. Coherent scattering by one reptating chain. J Phys France (1981) 42(5):735–40. doi:10.1051/jphys:01981004205073500
46. Fritzsche J, Klüppel M, Meier J. Dielectric relaxation spectroscopy of precipitated silica and elastomer-silica composites. KGK Kautschuk, Gummi, Kunststoffe (2009) 62(6):319–25.
47. Arbe A, Colmenero J, Alvarez F, Monkenbusch M, Richter D, Farago B, et al. Experimental evidence by neutron scattering of a crossover from Gaussian to non-Gaussian behavior in the α relaxation of polyisoprene. Phys Rev E (2003) 67(5):051802. doi:10.1103/physreve.67.051802
48. Zorn R, Richter D, Farago B, Frick B, Kremer F, Kirst U, et al. Comparative study of the segmental relaxation in polyisoprene by quasi-elastic neutron scattering and dielectric spectroscopy. Physica B: Condensed Matter (1992) 180:534–6. doi:10.1016/0921-4526(92)90815-a
49. de Gennes P-G. Reptation of a polymer chain in the presence of fixed obstacles. J Chem Phys (1971) 55(2):572–9. doi:10.1063/1.1675789
50. Domurath J, Saphiannikova M, Ausias G, Heinrich G. Modelling of stress and strain amplification effects in filled polymer melts. J Non-Newtonian Fluid Mech (2012) 171:8–16. doi:10.1016/j.jnnfm.2012.01.001
51. Domurath J, Saphiannikova M, Ferec J, Ausias G, Heinrich G. Stress and strain amplification in a dilute suspension of spherical particles based on a Bird–Carreau model. J Non-Newtonian Fluid Mech (2015) 221:95–102. doi:10.1016/j.jnnfm.2015.04.002
52. Mujtaba A, Keller M, Ilisch S, Radusch HJ, Beiner M, Thurn-Albrecht T, et al. Detection of surface-immobilized components and their role in viscoelastic reinforcement of rubber–silica nanocomposites. ACS Macro Lett (2014) 3(5):481–5. doi:10.1021/mz500192r
53. Saalwächter K. Microstructure and molecular dynamics of elastomers as studied by advanced low-resolution nuclear magnetic resonance methods. Rubber Chem Technol (2012) 85(3):350–86. doi:10.5254/rct.12.87991
54. Papon A, Saalwachter K, Schaler K, Guy L, Lequeux F, Montes H. Low-field NMR investigations of nanocomposites: Polymer dynamics and network effects. Macromolecules (2011) 44(4):913–22. doi:10.1021/ma102486x
55. Papon A, Montes H, Hanafi M, Lequeux F, Guy L, Saalwachter K. Glass-transition temperature gradient in nanocomposites: Evidence from nuclear magnetic resonance and differential scanning calorimetry. Phys Rev Lett (2012) 108(6):065702. doi:10.1103/physrevlett.108.065702
56. Senses E, Narayanan S, Faraone A. Nanoscale particle motion reveals polymer mobility gradient in nanocomposites. ACS Macro Lett (2019) 8(5):558–62. doi:10.1021/acsmacrolett.9b00176
57. Moghimikheirabadi A, Kröger M, Karatrantos AV. Insights from modeling into structure, entanglements, and dynamics in attractive polymer nanocomposites. Soft Matter (2021) 17(26):6362–73. doi:10.1039/d1sm00683e
58. Karatrantos A, Clarke N, Composto RJ, Winey KI. Entanglements in polymer nanocomposites containing spherical nanoparticles. Soft Matter (2016) 12(9):2567–74. doi:10.1039/c5sm02010g
59. Vogiatzis GG, Voyiatzis E, Theodorou DN. Monte Carlo simulations of a coarse grained model for an athermal all-polystyrene nanocomposite system. Eur Polym J (2011) 47(4):699–712. doi:10.1016/j.eurpolymj.2010.09.017
60. Vogiatzis GG, Theodorou DN. Multiscale molecular simulations of polymer-matrix nanocomposites. Arch Comput Methods Eng (2018) 25(3):591–645. doi:10.1007/s11831-016-9207-y
61. Einstein A. On the motion of small particles suspended in liquids at rest required by the molecular-kinetic theory of heat. Ann Phys (1905) 17(549-560):549–60. doi:10.1002/andp.19053220806
62. Batchelor G. The effect of Brownian motion on the bulk stress in a suspension of spherical particles. J Fluid Mech (1977) 83(1):97–117. doi:10.1017/s0022112077001062
63. Smallwood HM. Limiting law of the reinforcement of rubber. J Appl Phys (1944) 15(11):758–66. doi:10.1063/1.1707385
64. Hsiao-Sheng C, Acrivos A. The effective elastic moduli of composite materials containing spherical inclusions at non-dilute concentrations. Int J Sol Structures (1978) 14(5):349–64. doi:10.1016/0020-7683(78)90017-3
65. Hammouda B. Probing nanoscale structures-the sans toolbox. Gaithersburg, MD: Center for Neutron Research (2008). p. 1–717.
66. Fritzsche J, Klüppel M. Structural dynamics and interfacial properties of filler-reinforced elastomers. J Phys : Condens Matter (2010) 23(3):035104. doi:10.1088/0953-8984/23/3/035104
67. Huang M, Tunnicliffe LB, Thomas AG, Busfield JJ. The glass transition, segmental relaxations and viscoelastic behaviour of particulate-reinforced natural rubber. Eur Polym J (2015) 67:232–41. doi:10.1016/j.eurpolymj.2015.03.024
Keywords: dynamics, nanocomposite, rheology, dielectric spectroscopy, scattering
Citation: Philippe A-M, Sill C, Westermann S, Allgaier J, Staropoli M, Monkenbusch M, Gerstner D, Fleming Y, Wischnewski A, Hoffmann I, Zolnierczuk P, Do C and Pyckhout-Hintzen W (2022) Quantifying structure and dynamics of bound and bulk polymer in tailor-made rubber-silica nanocomposites. Front. Phys. 10:1023234. doi: 10.3389/fphy.2022.1023234
Received: 19 August 2022; Accepted: 24 October 2022;
Published: 14 November 2022.
Edited by:
Julian Oberdisse, Laboratoire Charles Coulomb, FranceReviewed by:
Victoria Garcia Sakai, ISIS Facility, United KingdomMartin Kröger, ETH Zürich, Switzerland
Copyright © 2022 Philippe, Sill, Westermann, Allgaier, Staropoli, Monkenbusch, Gerstner, Fleming, Wischnewski, Hoffmann, Zolnierczuk, Do and Pyckhout-Hintzen. This is an open-access article distributed under the terms of the Creative Commons Attribution License (CC BY). The use, distribution or reproduction in other forums is permitted, provided the original author(s) and the copyright owner(s) are credited and that the original publication in this journal is cited, in accordance with accepted academic practice. No use, distribution or reproduction is permitted which does not comply with these terms.
*Correspondence: A.-M. Philippe, YWRyaWFubWFyaWUucGhpbGlwcGVAbGlzdC5sdQ==