 Asim Ghosh1
 Bikas K. Chakrabarti2,3
 Dachepalli R. S. Ram4
 Manipushpak Mitra3*Raju Maiti3
 Soumyajyoti Biswas4
 Suchismita Banerjee3
- 1Department of Physics,Raghunathpur College, Raghunathpur, India
- 2Department of Physics, Saha Institute of Nuclear Physics, Kolkata, India
- 3Economic Research Unit, Indian Statistical Institute, Kolkata, India
- 4Department of Physics, SRM University, Amaravathi, Andhra Pradesh, India
A popular measure for citation inequalities of individual scientists has been the Hirsch index (h). If for any scientist the number nc of citations is plotted against the serial number np of the papers having those many citations (when the papers are ordered from the highest cited to the lowest), then h corresponds to the nearest lower integer value of np below the fixed point of the non-linear citation function (or given by nc = h = np if both np and nc are a dense set of integers near the h value). The same index can be estimated (from h = s = ns) for the avalanche or cluster of size (s) distributions (ns) in the elastic fiber bundle or percolation models. Another such inequality index called the Kolkata index (k) says that (1 − k) fraction of papers attract k fraction of citations (k = 0.80 corresponds to the 80–20 law of Pareto). We find, for stress (σ), the lattice occupation probability (p) or the Kolkata Index (k) near the bundle failure threshold (σc) or percolation threshold (pc) or the critical value of the Kolkata Index kc a good fit to Widom–Stauffer like scaling
1 Introduction
Monotonically and nonlinearly decaying inequality functions are ubiquitous. When the number (np) of papers by any author (or, for that matter, an institution) is arranged according to the number (nc) of the citations they received, the citation inequality function becomes a monotonically decaying one (see e.g. [1]). The same is true for avalanches in material failure or in earthquakes (see e.g. [2]), cluster size distributions in percolation problems (see e.g. [3]), etc., where the number (ns) of avalanches or clusters (giving the size inequality function) decreases monotonically and nonlinearly with the size (s) of the avalanche or cluster. Large avalanches, strong quakes, or big size clusters come or occur in small numbers, while the smaller or weaker the avalanches, quakes, or clusters, the larger is their abundance in occurrence. How does one statistically measure these inequalities in occurrence frequencies of citation numbers or avalanche or cluster sizes? Obviously, the corresponding distribution functions for inequalities in citations or sizes would contain the entire statistics. However, they are not convenient to handle. One can consider the citation number of the best cited paper (as sometimes carried out for some unique awards, etc.) or study the statistical (self-similar) structure of the biggest avalanche or the largest (percolating) cluster (as in statistical physics [3]). Hirsch proposed [1] (Figure 1) an index to measure these inequalities, by locating the fixed point of the nonlinear inequality function. The Hirsch index (h) corresponds to the citation number or occurrence frequency which is commensurate in magnitude with the number of publications or avalanche cluster sizes.
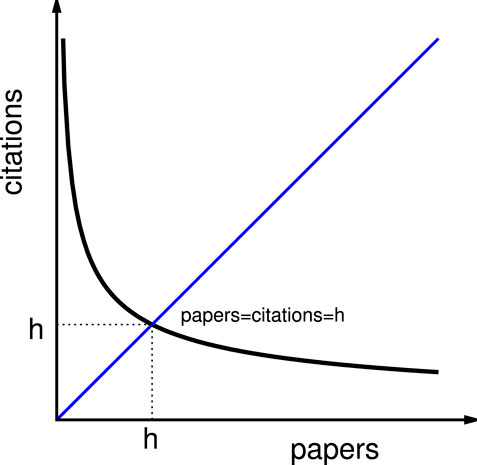
FIGURE 1. Schematic drawing of the citation function of a typical scientist. The h-index (an integer) is given by the lower value of the paper serial number below the fixed point value (the intersection point of the 45° line from the origin), when the papers are ordered from the highest cited to the lowest cited one. When the citation number and the serial number of the papers (having those citations) are both sequential integers near the fixed point, the citation number equals the number of papers and both become h. Similar will be the case where citations are replaced by the failure of the material avalanche sizes (or cluster sizes), and the paper numbers are replaced by the number of such avalanches (or of the clusters in pre- or post-percolating systems).
Systems near their critical points, self-organized or tuned, have mostly been studied in the self-similar limit of their divergent correlations (see e.g. [2, 3]). The corresponding critical exponent values arising out of such self-similarities have helped classify vastly different physical systems based on their symmetries, dimensionality, and such broad qualifiers. One powerful tool has been the scaling relations among the critical exponents that helped build an interconnected and precise relation between experimental observables in such systems near criticality. In this work, however, we focus on quantifying the response of near-critical systems through the corresponding inequality statistics (for example, in nc versus np of citations or in ns versus s for avalanches or clusters). Specifically, we measure the widely used Hirsch index (h), which in effect, gives a measure of a size that is commensurate with its relative abundance. It turns out to be possibly even more robust than the critical behavior (characterized by a set of exponents). We demonstrate this by choosing a wide variety of systems, namely, citation statistics, percolation cluster statistics, and avalanche statistics, in fiber bundle models (FBMs) and even in the statistics of parliament sizes in different countries of the world. They differ in their dimensionality (two dimensions for the percolation model studied here, mean-field for the fracture model, and possibly small-world networks for citation and parliament statistics). They further differ in their measurement variables and their size distribution statistics, making them widely different in terms of their prominently apparent features. However, we show here that in spite of their obvious differences, the scaling behavior of the Hirsch index shows remarkable universality.
How does the h-index scale with a total number of publications (Np) by the author (institution) or the total number (Nc) of citations received by the author (institution)? Young [4] suggested analytically that the h-index value should scale with the total number of citations Nc (= ∑nc) as
In a recent Monte Carlo study [9], on the avalanche sizes and their numbers in the fiber bundle models (FBMs) of material failure (see e.g. [2, 10]) due to increasing stress on such bundles, the numerical analysis of the data for the nonlinearly decaying numbers of avalanches with their sizes (or released elastic energies) suggested
Our numerical study on avalanche size distributions in FBMs (for stress or load per fiber σ less than its global failure stress σc) of cluster size distributions for the lattice occupation concentration p near the percolation point pc (for p both below and above pc) in the percolating system and the previous analysis [5] of citation distributions of scientists with the Kolkata index k (see e. g, [6] for a review, giving the fraction k of citations/wealth attracted/possessed by 1 − k fraction of publications/people) near (both above and below) the threshold point kc (= 0.86) both show an excellent fit to a Widom–Stauffer like scaling relation between the Hirsch index (h) and the system size N (or individual’s total citation size Nc), following Widom scaling for the free energy away from the critical point and the subsequent Stauffer scaling [3] for the number of a particular sized cluster, identified here as the equivalent Hirsch index, at and away from the percolation point):
with the asymptotically well-defined finite size scaling function f (f(x) = constant at x = 0 and f remaining continuous and finite as x approaches infinity) for systems of size N (total number of fibers or lattice sites/bonds) or size Nc (total number of citations of all the publications by an individual scientist) and α denoting the appropriate scaling exponent.
Traditionally, the Hirsch index h for different authors has been fitted [4] to the scaling form
We also show that if the number (Nm) of members of the parliaments or national assemblies of different countries (with the corresponding population denoted by N) is identified as those countries’ respective h indices, then the data fit well to the scaling relation
2 Data analysis and numerical studies
2.1 Failure avalanches in the fiber bundle model (FBM)
The fiber bundle model (FBM) is a generic model for failure of disordered solids. An ensemble of N fibers is a set between two rigid parallel plates, and a load is applied on the bottom plate. Each fiber is linear elastic with the same elastic constant and has a failure threshold selected randomly from a distribution. This failure threshold is the source of the disorder and non-linearity in the otherwise linear model.
When a small load (W) is applied, the weakest fiber breaks and the load carried by that fiber is shared equally by all the remaining fibers, which can trigger further failures. Through gradual increase of the load, therefore, the model goes through intermittent stable states, which are subsequently perturbed by increasing the load slowly. In going from one stable state to another, the number of fibers that break is the avalanche size (s). The size distribution of this follows a power-law statistics P(s) ∼ s−5/2 for s → ∞ [13]. The avalanche dynamics continues until the load per fiber value σ = W/N reaches a critical limit σc, when the entire system breaks down.
The avalanches are arranged in the ascending order to estimate h-index values for the stress level σ below σc. It was shown ([9]) that the terminal value of h (= hf) at the critical point (σ = σc) follows a scaling relation
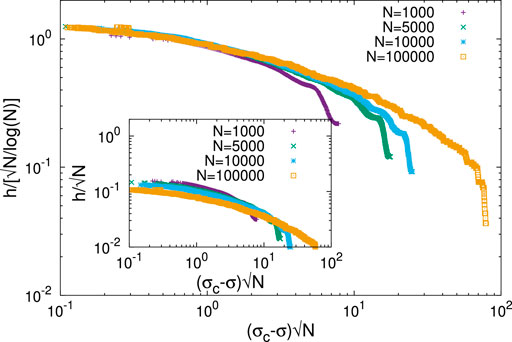
FIGURE 2. Finite size scaling analysis of the fiber bundle model h −index (from avalanche size distribution). The scaling fit to the Widom–Stauffer relations (Eq. 1) is obtained by making all the data points of different sizes (N =1000,5000,10000, and 100000) and stress level (different σ values) collapse together. It turns out that the scaling form (Eq. 1b) with the exponent α =1 gives good data collapse. The inset shows that the data collapse clearly gets worsened by dropping the log N term in the scaling relation (Eq. 1b).
Figure 3 shows the scaling behavior for the average h-index (in the range 4 ≤ h ≤ 20) at the breaking point (σ = σc) of the bundles with the total number N (in the range 200 ≤ N ≤ 20000) of fibers in the equal-load-sharing FBM (with uniform distribution of fiber-breaking thresholds) considered here (cf [9]). The figure shows the best fit of h to
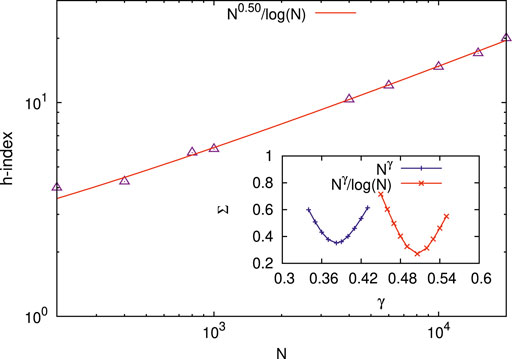
FIGURE 3. Scaling behavior for the average h-index (in the range 4≤ h ≤20) at the breaking point (σ = σc) of the bundles with the total number N (in the range 200≤ N ≤20000) of fibers in the equal-load-sharing FBM (with uniform distribution of fiber breaking thresholds) considered here (cf [9]). The figure shows the best fit of h to
2.2 Percolation clusters in the 2D lattice
Here, we consider two-dimensional (2D) site percolation in a square lattice with site occupancy probability p (0 < p < 1). For a given p, we measure the cluster distribution, and hence, the h-index is computed (here, h-index measures h number of clusters each having cluster sizes greater than equal to h). In our simulation, we took four different system sizes (N = 4000 × 4000, 8000 × 8000 and 16000 × 16000), and the h-index was estimated for different p values.
Here, we carry out the finite size scaling analysis [14] (see also [15]) of the h-index for different system sizes. The critical exponent α is determined by the fit to scaling relation (Eq. 1b) for all the data points of different sizes (N = 4000 × 4000, 8000 × 8000 and 16000 × 16000). We obtain a good data collapse with α = 3 and different scaling functions f for p > pc and p < pc while they converge to the same value at p = pc (see Figure 4). The inset of Figure 4 shows the scaling fit to relation (Eq. 1b) without the log(N) term, and it is observed that the right hand side scaling fit is not that well.
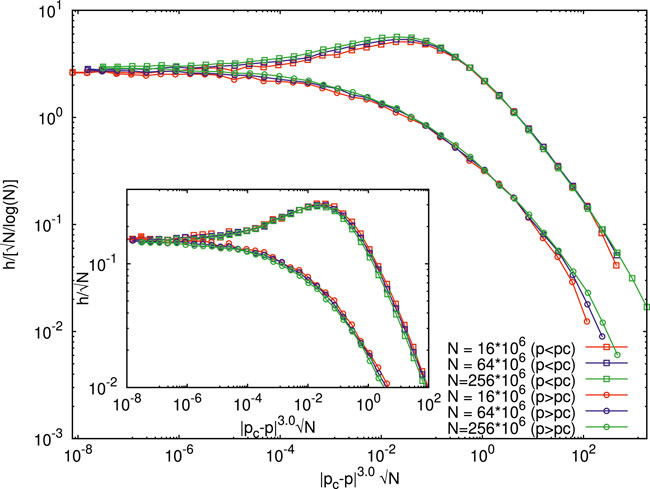
FIGURE 4. Finite size scaling analysis of the 2D site percolation h −index (from the cluster size distribution). The scaling fit to the Widom–Stauffer relations (Eq. 1) is obtained by making all the data points of different sizes (N =4000×4000,8000×8000, and 16000×16000) and concentrations (different p values, pc =0.5927) collapse together. It turns out that the scaling form (Eq. 1b) with the exponent α =3 gives good data collapse. The inset shows that the data collapse seems to get worsened by dropping the log N term in the scaling relation (Eq. 1b).
The cluster size distribution in the percolation problem has also been studied for estimating h-index scaling with the total number N of lattice sites at the percolation threshold of site percolation on the square lattice. We, of course, find here the best fit scaling form to be
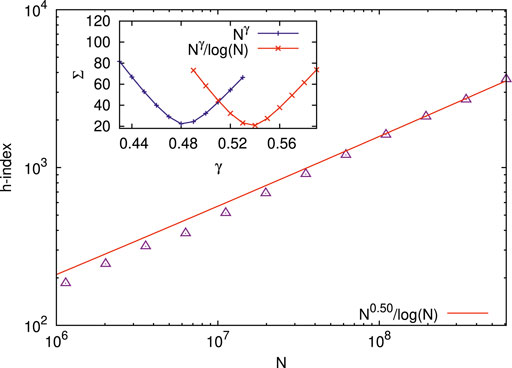
FIGURE 5. Scaling behavior for the h-index (in the range 185≤ h ≤4421) for cluster size distributions at the percolation point (with size N on the square lattice; 106< N <109). The figure shows the best fit of h to
2.3 Paper citations
We first analyze the data for the h-index and its scaling with the total number of publications Np and of citations Nc for the 100 scientists (in mathematics, physics, chemistry, medicine, biology, economics, and sociology, including those of 20 Nobel laureates in those subjects) given in [5]. Next, we collected (from May to June 2021) the same kind of data1 for 1000 scientists (mostly physicists) in all the aforementioned subjects from Google Scholar.
Figures 6, 7 show the scaling behavior for the h-index (in the range 20 ≤ h ≤ 222) of the 100 scientists (data taken from [5]), with the total number of citations Nc (in the range 1819 ≤ Nc ≤ 323473). Our analysis shows the best fit to
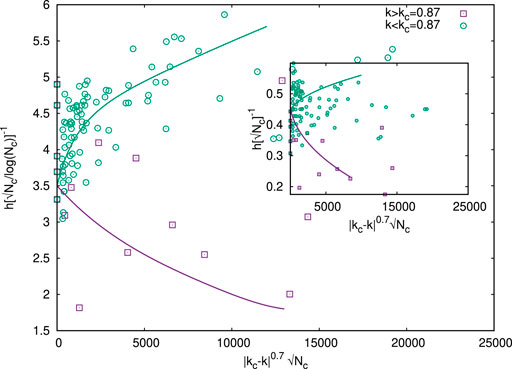
FIGURE 6. Finite size (Nc) scaling analysis of the citation distributions of 100 individual scientists (Table 1 of Ref. [5]). The scaling fit to the Widom–Stauffer relation (Eq. 1c) is obtained by fitting all the data for their h-index and the Nc values of total citations of the publications by individual scientists and their corresponding Kolkata index values k near the critical value kc ≃0.87 [5]. It turns out that the scaling form (Eq. 1c) with the exponent α =0.7 gives a good data collapse. The inset shows that the data collapse seems to get worsened by dropping the logN term in the scaling relation (Eq. 1c), although at the critical point k = kc, one gets
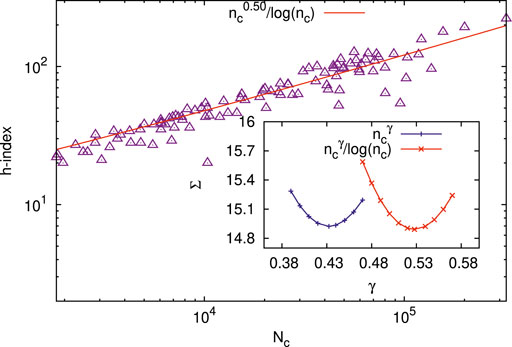
FIGURE 7. Scaling behavior for the h-index (in the range 20≤ h ≤222) of 100 scientists (data taken from [5]), with the total number of citations Nc (in the range 1819≤ Nc ≤323473). Our analysis shows the best fit to
Figures 8A, B show the scaling behavior for the h-index (in the range 17 ≤ h ≤ 221) of 1000 scientists with the total number of citations Nc (in the range 996 ≤ Nc ≤ 348680) in Figure 8A and with the total number of papers Np (in the range 100 ≤ Np ≤ 2987) in Figure 8B. The data are taken from Google Scholar in June 2021. The figures show the best fits to
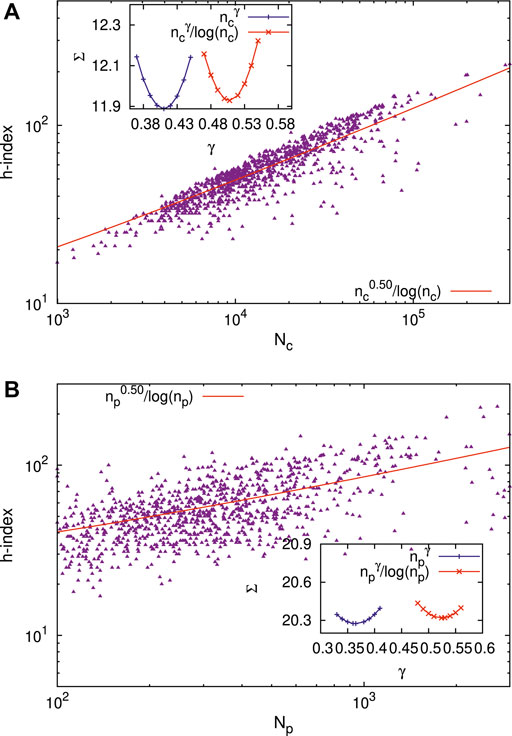
FIGURE 8. Scaling behavior for the h-index (in the range 17≤ h ≤221) of 1000 scientists with the total number of citations Nc (in the range 996≤ Nc ≤348680) in (A) and with the total number of papers Np (in the range 100≤ Np ≤2987) in (B). The data are taken from Google Scholar in June 2021. The figures show the best fits to
2.4 Number of representatives in the national assemblies
Finally, we note that if the number Nm of representatives in the national assemblies or in the parliaments of different countries of the world is identified as the h-index for the respective country, having population N, then we find (see Figure 9) that the data analyzed in [11] 2show the best fit of Nm to
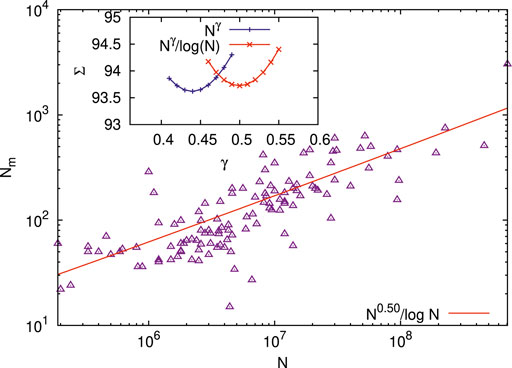
FIGURE 9. Scaling behavior for the number Nm (in the range 15≤ Nm ≤3040) of representatives in national assemblies or parliaments of different countries of the world (1972 data from the original study [11]; see also [12]) with total population N (in the range 19×104≤ N ≤70.5×10⁷) of the respective countries. When Nm is identified as the h −index for the countries, we get
3 Summary and conclusion
We have studied here the scaling behaviors of the Hirsch index h for inequalities [1] applied to the unequal distributions of responses and statistics in different physical (fracture and percolation) and social systems (citations and parliament sizes). We have shown that the Hirsch index follows remarkable off-critical Widom–Stauffer scaling in these systems that are widely different in terms of their dimensionality and symmetry.
We have studied avalanche or cluster sizes in physical systems like the fiber bundle models (see e.g. [2, 10]) and percolating systems (see e.g. [3, 14]). Indeed, surprising successes of such Hirsch-like social inequality measures were already seen (see e.g. [9, 15]) in predicting the global failures in fiber bundles and the self-organized critical points of sand-pile systems. We show, in this study, from the Monte Carlo simulation results (see Section 2.1 and Section 2.2) that the Widom–Stauffer-like scaling relation (Eq. 1a,b) of the Hirsch index h (defined here for the size s distributions ns, through h = s = ns) fits remarkably well with the system size N (see Figures 2, 4). We also show (see the insets of Figures 2, 4) that the scaling collapse breaks down without the log N term in (Eq. 1) (visibly clear for the fiber bundle results in Figure 2).
As it is well known, the Hirsch index (h) was introduced originally to measure the inequalities in success (through citations in the subsequent literature) of the contributions (papers) of individual scientists. The citation function (see Figure 1), is a well-documented non-linear and monotonically decaying function (cf. Zipf law [16]). h corresponds to the fixed point of this citation function. The analytical study [4] and numerical data analysis (see e.g. [5]) suggested
We also show that when the number Nm of the members of national assemblies or of parliaments for different countries of the world is identified effectively as their Hirsch index h, then Nm indeed would scale (see Figure 9 in Section 2.4) with the total population N as
For an additional check for the logN term in the scaling behavior of the Hirsch index, we fitted the data for h in fiber bundle models (Section 2.1, for stress values σ near the failure point σc), for percolation systems (Section 2.2, for site occupation concentrations p both above and below the percolation threshold pc), paper citation data (Section 2.3, for authors with Kolkata index values k both above and below the critical value kc), and parliament membership data (Section 2.4) to the scaling forms
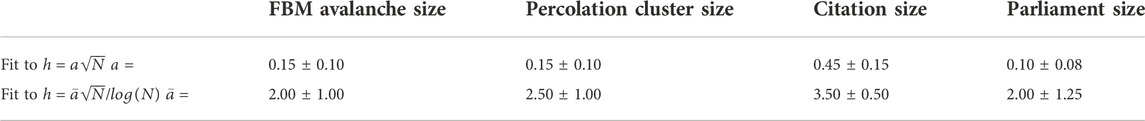
TABLE 1. Values of the pre-factors a and
In conclusion, we have explored the best fit of the Hirsch index values h for system sizes N (or Nc) with a Widom–Stauffer like finite size scaling form (Eq. 1). This is essentially based on the Monte Carlo simulation data collapse in the fiber bundle model and percolating systems (for σ or p away from σc or pc, respectively; see Figures 2, 4) and data analysis for citations of 100 scientists (k away from kc; see Figure 6) analyzed in [5]. Data for parliament member numbers (identified as the corresponding country’s h index; see Figure 9) are fitted to the relation (Eq. 2) as the equivalent critical interval ([σc − σ], |pc − p|, or |kc − k|) is unknown. We find the scaling fit (to relations Eqs 1, 2 deteriorate considerably if the log N term is dropped. We give in Table 1 the estimated error in the pre-factors a and
Data availability statement
The original contributions presented in the study are included in the article/supplementary materials; further inquiries can be directed to the corresponding author.
Author contributions
All authors listed have made a substantial, direct, and intellectual contribution to the work and approved it for publication.
Acknowledgments
The authors are grateful to Parongama Sen for useful comments and suggestions. BC is thankful to the Indian National Science Academy for their Senior Scientist Research Grant.
Conflict of interest
The authors declare that the research was conducted in the absence of any commercial or financial relationships that could be construed as a potential conflict of interest.
Publisher’s note
All claims expressed in this article are solely those of the authors and do not necessarily represent those of their affiliated organizations, or those of the publisher, the editors, and the reviewers. Any product that may be evaluated in this article, or claim that may be made by its manufacturer, is not guaranteed or endorsed by the publisher.
Footnotes
1The data will be available on request to corresponding author.
2The data extracted from this paper can be found in https://sciencehistory.epfl.ch/physics-and-sociology/
References
1. Hirsch JE. An index to quantify an individual’s scientific research output. Proc Natl Acad Sci U S A (2005) 102(46):16569–72. doi:10.1073/pnas.0507655102
2. Biswas S, Ray P, Chakrabarti BK. Statistical physics of fracture, breakdown, and earthquake: Effects of disorder and heterogeneity. New York, NY, USA: John Wiley & Sons (2015).
3. Stauffer D, Aharony A. Introduction to percolation theory. Boca Raton, FL, USA: CRC Press (2018).
4. Yong A. A critique of hirsch's citation index: A combinatorial fermi problem. Not Am Math Soc (2014) 61(9):1040–50. doi:10.1090/noti1164
5. Ghosh A, Chakrabarti BK. Limiting value of the Kolkata Index for social inequality and a possible social constant. Physica A: Stat Mech its Appl (2021) 573:125944. doi:10.1016/j.physa.2021.125944
6. Banerjee S, Chakrabarti BK, Mitra M, Mutuswami S. Inequality measures: The Kolkata index in comparison with other measures. Front Phys (2020) 8:562182. doi:10.3389/fphy.2020.562182
7. Dunbar RIM. Neocortex size as a constraint on group size in primates. J Hum Evol (1992) 22(6):469–93. doi:10.1016/0047-2484(92)90081-j
8. Bhattacharya K, Ghosh A, Monsivais D, Dunbar RIM, Kaski K. Sex differences in social focus across the life cycle in humans. R Soc Open Sci (2016) 3(4):160097. doi:10.1098/rsos.160097
9. Biswas S, Chakrabarti BK. Social inequality analysis of Fiber Bundle Model statistics and prediction of materials failure. Phys Rev E (2021) 104(4):044308. doi:10.1103/physreve.104.044308
10. Pradhan S, Hansen A, Chakrabarti BK. Failure processes in elastic fiber bundles. Rev Mod Phys (2010) 82(1):499–555. doi:10.1103/revmodphys.82.499
11. Taagepera R. The size of national assemblies. Soc Sci Res (1972) 1(4):385–401. doi:10.1016/0049-089x(72)90084-1
12. Margaritondo G. Size of national assemblies: The classic derivation of the cube-root law is conceptually flawed. Front Phys (2021) 8:606. doi:10.3389/fphy.2020.614596
13. Hemmer PC, Hansen. A. The distribution of simultaneous fiber failures in Fiber Bundles. J Appl Mech (1992) 59:909–14. doi:10.1115/1.2894060
14. Stauffer D. Scaling theory of percolation clusters. Phys Rep (1979) 54(1):1–74. doi:10.1016/0370-1573(79)90060-7
15. Manna SS, Biswas S, Chakrabarti BK. Near universal values of social inequality indices in self-organized critical models. Physica A: Stat Mech its Appl (2022) 596:127121. doi:10.1016/j.physa.2022.127121
16. Zipf GK. Selected studies of the principle of relative frequency in language. Cambridge, MA: Harvard University Press (1932).
Keywords: Hirsch index, Kolkata index, percolation model, fiber bundle models, paper citation
Citation: Ghosh A, Chakrabarti BK, Ram DRS, Mitra M, Maiti R, Biswas S and Banerjee S (2022) Scaling behavior of the Hirsch index for failure avalanches, percolation clusters, and paper citations. Front. Phys. 10:1019744. doi: 10.3389/fphy.2022.1019744
Received: 15 August 2022; Accepted: 24 October 2022;
Published: 17 November 2022.
Edited by:
Alex Hansen, Norwegian University of Science and Technology, NorwayReviewed by:
Sitangshu Bikas Santra, Indian Institute of Technology Guwahati, IndiaFrancisco Welington Lima, Federal University of Piauí, Brazil
Tomonari Sei, The University of Tokyo, Japan
Copyright © 2022 Ghosh, Chakrabarti, Ram, Mitra, Maiti, Biswas and Banerjee. This is an open-access article distributed under the terms of the Creative Commons Attribution License (CC BY). The use, distribution or reproduction in other forums is permitted, provided the original author(s) and the copyright owner(s) are credited and that the original publication in this journal is cited, in accordance with accepted academic practice. No use, distribution or reproduction is permitted which does not comply with these terms.
*Correspondence: Manipushpak Mitra, bW1pdHJhQGlzaWNhbC5hYy5pbg==