 Qingxiang Feng
 Sha Zhu
 Fujun Lai
95% of researchers rate our articles as excellent or good
Learn more about the work of our research integrity team to safeguard the quality of each article we publish.
Find out more
ORIGINAL RESEARCH article
Front. Phys. , 05 October 2022
Sec. Social Physics
Volume 10 - 2022 | https://doi.org/10.3389/fphy.2022.1018219
This article is part of the Research Topic Hidden Order Behind Cooperation in Social Systems View all 13 articles
City cluster, the most advanced spatial organization for urban development in the mature stage, is an important carrier for regional economic development. This paper researched into the correlation of economic development changes among cities in the Guangdong-Hong Kong-Macao Greater Bay Area through a new complex network approach. First, Principal Component Analysis was adopted to downscale the economic indicators of each city in the Greater Bay Area, and then we construct an economic development index on this basis; Second, through a TVS-VAR-SV model, an complex network of economic development changes within the city clusters in the Greater Bay Area was built based on the economic development index of each city mentioned above. It can be concluded from the study that Macao, firstly, is the biggest beneficiary of the complex network. Secondly, the most important node in the network is Guangzhou, whose development has a multiply effect on the development of the whole system. Thirdly, Hong Kong and Shenzhen enjoy the highest level of economic development, but their spillover effect on the city cluster system is much lower than that of Guangzhou.
Guangdong-Hong Kong-Macao Greater Bay Area, located in South China, consists of “9 + 2″ cities, namely Guangzhou, Shenzhen, Zhuhai, Foshan, Zhongshan, Dongguan, Huizhou, Jiangmen and Zhaoqing, as well as Hong Kong Special Administrative Region and Macao Special Administrative Region. Boasting a total area of 56,000 square kilometers and a population of over 80 million, the Greater Bay Area has become one of the places with the highest degree of openness and the best economic vigor in China for its high population mobility, a close interaction of production factors and the resulting high GDP. Under the framework of “one country, two systems”, each city in the Greater Bay Area has its own social division of labor and central function. At present, a complete and comprehensive industrial manufacturing chain and value allocation system has basically been formed, for example, Guangzhou’s trade network, Shenzhen’s scientific and technological innovation, Hong Kong’s financing and investment, Macao’s gambling and tourism, and Dongguan and Huizhou’s high-end manufacturing. At the same time, the central government and local governments actively cooperate with the national development strategy, and according to the resource endowment, cultural foundation and regional advantages of each city, they have issued corresponding social policies to support the construction of Guangdong-Hong Kong-Macao Greater Bay Area.
Globalization and the development of modern communication technology have helped the flow of inter-city factors break through the boundaries of cities and tightened the economic relationships increasingly. The city cluster is essentially an urban functional area with a high concentration of population, industry, resources and other factors. Based on the realistic conditions and the social development law, the city cluster has become an inevitable trend of China’s urban modernization. Guangdong-Hong Kong-Macao Greater Bay Area is a megapolis of 11 cities, where the population mobility, industrial chain upgrading, and resource integration are trying to break through the limit of one single city and turn to network development, which in return is conducive to driving and radiating a wider area. Though governments all over the world have paid more and more attention to the development of city cluster, the theory and method of the economic association network in the Bay Area are obviously lagging behind, and accordingly, fails to explain the current situation, changes and trends of the rapid development of city clusters. In view of this, based on Principal Component Analysis and TVP-VAR-SV model, this paper tried to explore the economic development index and the association network law of Guangdong-Hong Kong-Macao Greater Bay Area in response to the theoretical appeal and practical concern.
As the level of urbanization is increasing around the world, the study of urban complex networks has become a research hot topic at home and abroad in recent years. As early as in the 1990s, Castells [1] keenly captures the trend of the rise of the complex network society and proposes that the world city refers to a process of production and reproduction by the globalized network, and the global urban system is created by the mobile space. By replacing the analytical framework of “spatial place” with “flowing space”, this point of view breaks through the limitations of previous explanatory research featuring “attribute hierarchy”, and turns a new page on urban observation through “network dynamics”. For the theory centered on the study of urban networks, Taylor [2] names it as “central flow theory”. He argues that based on the central place theory, traditional urban systems research is thus hierarchical. “Central flow theory” views the relationship between cities as networked, which means it is not contradictory to the central place theory, as the former emphasizes more on global space while the latter more on local space and both of them are complementary to each other.
The rising globalization has seen science and technology changing with each passing day, labor, land, resources, and information flowing in the urban economic networks. The development potential of one single city no longer depends solely on its own population size and economic strength but on its ability to associate with other cities, namely, the strength and density of network links [3]. As an organic whole, cities are originally interconnected and influenced by each other. When " association networks” become the spatial component of modern urban systems, the effective regional organization mechanisms (or institutional integration) can improve the overall organizational capacity of the region, so that the available resources can be shared in a more effective way [4]. The major progress in the study of urban association network theory provides new ideas in solving the problems of unbalanced regional development and exploring the path of regional integration development for the whole world.
Guangdong-Hong Kong-Macao Greater Bay Area, one of China’s major national development strategies, aims to build an international top bay area and a world-class city cluster. Among it, economic growth remains the priority in the construction of the Greater Bay Area, while the city clusters are increasingly becoming an important lever for economic development. Based on the extension and application of the theory of city complex networks, many scholars have analyzed the network characteristics, factor associations, and operation mechanisms of the economies in the Guangdong-Hong Kong-Macao Greater Bay Area from different perspectives. The comprehensive development level of Guangdong-Hong Kong-Macao Greater Bay Area’s economy is fluctuating rapidly, and the economic index of Hong Kong and Macao has always been the highest in the Bay Area, with a fast growth rate in Guangzhou and Shenzhen [5]. The spatial economic network of the Greater Bay Area is featured with a reasonable and orderly “core-semi-edge-outer edge” hierarchical spatial structure [17]. Four kinds of factors, such as the distance between cities, the diffusion and agglomeration of factors, industrial structure and economic globalization, have significant influence on Guangdong-Hong Kong-Macao Greater Bay Area’s economic network [6]. The increase in network density and network hierarchy as well as the decrease in network efficiency can effectively enhance the economic relations within the Guangdong-Hong Kong-Macao Greater Bay Area. While point centrality, intermediate centrality and proximity centrality can all strengthen the economic bonds in the Greater Bay Area [7]. Therefore, to promote regional coordinated development, we should adhere to the concept of “interconnection and intercommunication”, weaken the scope of administrative boundaries [8], improve the radiation capacity of the core cities of city clusters in the Greater Bay Area, build a hub-and-spoke network pattern, and innovate institutional mechanisms [9].
To sum up, the current research on regional economic complex networks features a combination of quantitative and qualitative as well as a combination of theory and practice. These thoughts offer important theoretical insights and a useful analytical framework for this paper. How to measure the economic development level of each city in the Greater Bay Area? How do the economic factors between them interact and influence each other? How to find out the key nodes of the economic complex network of city clusters? However, these questions have not been adequately explained in the related studies, either theoretically or methodologically. Therefore, what this paper discovers may deepen the study of complex networks by providing enlightenment for the economic development of the Greater Bay Area.
The research goal of this paper is to build an economic development complex network among cities in Guangdong-Hong Kong-Macao Greater Bay Area and then adopt an empirical analysis of this network. The establishment of the model can be divided into two steps: first, this paper used the Principal Component Analysis (PCA) to reduce the dimension of classified data of economic development of cities in Guangdong-Hong Kong-Macao Greater Bay Area and then built the economic development index of each city through the Principal Component Factor Analysis. Second, the changes of economic development index of each city in the Greater Bay Area mentioned above was used to build the complex network of economic development among cities in Guangdong-Hong Kong-Macao Greater Bay Area by the TVP-VAR-SV model.
This section will describe the methodology used to construct the economic development index of cities in the Guangdong-Hong Kong-Macao Greater Bay Area (the Greater Bay Area). In this paper, the principal component analysis method will be used to construct the comprehensive evaluation index of economic development. Principal component analysis (PCA) is a statistical procedure with the core idea of transforming multiple variables into a few principal components through dimensionality reduction techniques, and these principal components retain most of the information of the original variables. To this end, we can evaluate the economic development of the urban agglomeration in the Greater Bay Area by leveraging the principal component information.
The evaluation is mainly divided into three steps: In the first step, standardized processing will be carried out on the data. Before measuring the comprehensive level of economic development, it is necessary to adjust the value of the indicators to make it co-trended and dimensionless, so as to eliminate the deviation caused by the different nature and dimension of the index. Because we will use PCA to reduce the dimension of the data later, we choose economic condition variables which we can collect and add them into the model. In the second step, principal component analysis and dimensionality reduction are carried out for the standardized indicators. The principal component analysis is carried out on the treated indicators, and the number of principal components is determined (generally) according to the principle that the cumulative variance contribution rate is not less than 85%, and the scores of each principal component are calculated. In the third step, a comprehensive evaluation index is constructed, that is, the economic development index of cities in the Greater Bay Area. The principal component scores of each city are weighted and summed to obtain a comprehensive evaluation of the economic level of each city, which is the economic development index we have constructed. The weight is the proportion of the variance contribution rate of each principal component in the cumulative variance contribution rate of the extracted principal component.
The detailed process and steps are as follows
1) Data standardization.
Ten indicators related to economic development in 11 cities in the Greater Bay Area are collected, and these original indicators are standardized (in time series). The data obtained after standardization is recorded as
Where, i = 1, 2, … , n; j = 1, 2, …, p.
2) Principal component analysis
(a) First, a covariance matrix is constructed using the standardized dimensionless data.
The standardized data matrix is set to X, where each column vector (standardized variable) has an expectation of 0 and a variance of 1. A dimensionless covariance matrix
Where,
b) Then, the eigenvalues and eigenvectors of the covariance matrix are calculated by eigenvalue decomposition:
Since
c) The number of principal components is determined, and the scores of each principal component are obtained.
To realize the final data dimensionality reduction, m principal components are reasonably selected from all p principal components. Generally, the variance contribution rate G(m) =
The scores of each principal component can be obtained by dimensionless data matrix and feature vector matrix:
Where,
d) Finally, a comprehensive evaluation index is constructed according to the principal components.
Taking the proportion of variance contribution rate corresponding to m principal components in the cumulative variance contribution rate as the weight, the scores of principal components are weighted and summed up, and the comprehensive evaluation index of the economic level of cities in the Greater Bay Area is obtained, which is the economic development index we constructed.
In the following content, this section will construct the economic development complex network of the urban agglomeration in the Greater Bay Area by using the variation of the economic development index previously constructed.
1) TVP-VAR-SV model
Diebold and Yilmaz [10–12] put forward the method of the Vector Autoregressive Model (VAR) to construct an information spillover networks among financial institutions. Despite being easy to use, this method still retains the shortcomings of the fixed-parameter VAR model. First, the model parameters of VAR are fixed in the window period; Second, the time window must be long enough, and a large number of samples need to be used for estimation. As the data samples of the economic development index of 11 cities in the Greater Bay Area were only established in 2010, such a short time span limits the application of the above methods. To effectively address the above two deficiencies, this paper assumes that the data is generated by the TVP-VAR-SV process, and then performs parameter estimation by using the Bayesian Analysis method and MCMC sampling.
Primiceri [13] proposed a time-varying parameter vector autoregressive model (TVP-VAR-SV) in which all parameters change with time. The model is evolved from the traditional VAR model, and its parameters are given time-varying characteristics, which overcomes many limitations of the traditional VAR model in practical application.
The basic form of a traditional time-invariant VAR(p) model with p-order lag is as follows:
Where,
If the structural impact of the contemporaneous relationship is identified by the recursive method, Equation 1 can be rewritten as:
If the parameters in Eq. 6 are given time-varying characteristics, then the TVP-VAR-SV model can be expressed as:
Where,
In this TVP-VAR-SV model, the parameters
According to Primiceri [13], let
And let
Meanwhile, it is assumed that the parameters in the TVP-VAR-SV model follow the random walk process:
Where:
However,
In view of the low sample time span, in order to avoid “over-parameterization” in the time-varying model, this paper directly sets the lag order of the model to 1 with reference to the practice of other scholars. The TVP-VAR-SV model described above can be estimated by the Bayesian Analysis method and MCMC sampling, as discussed in detail by Primiceri [13] and Nakajima et al. [14]. For MCMC samples, the posterior mean is used as the estimated value. Therefore, we can estimate the time-varying parameter matrix
2) Complex network of economic development index variation of urban agglomeration
Diebold and Yilmaz [10–12] defined the information spillover effect as the variance contribution of prediction error, that is, the proportion of
Where,
For t = p+1, p+2, ⋯, t, where
And let
Where,
But since
By constructing
Specifically, in the variance decomposition matrix
For the off-diagonal sum of elements in the i-row in
Then,
Similarly, for the off-diagonal sum of elements in the i-column in
Then, the sum
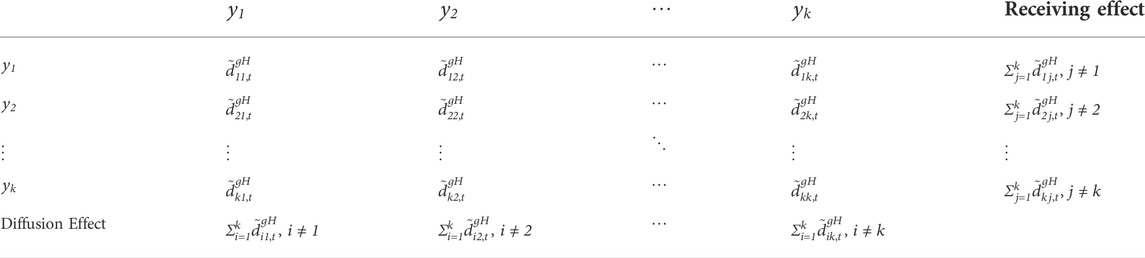
TABLE 1. The connectedness effect of economic development index.
On this basis, we can define the net spillover effect and total connectedness effect of city i’s economic development index. The net spillover effect can be expressed as:
The net spillover effect is obtained by subtracting the receiving effect from the diffusion effect of the city, so it reflects the net radiation ability of the economic development index of the city to the economic development indexes of other cities in the urban agglomeration. If the net spillover effect of city i is greater than 0, then the influence of city i on other cities is greater than that of other cities, which indicates that city i occupies a central position in the urban agglomeration, and its influence and radiation capacity are greater; On the contrary, if the net spillover effect of city i is less than 0, it means that city i is in a marginal position in the urban agglomeration, with weak influence and radiation power.
The total spillover effect can be expressed as:
The total correlation effect is obtained by adding the diffusion effect and receiving effect of the city, so it can reflect the importance of the city in the process of communication and integration within the urban agglomeration in the Greater Bay Area. The larger the value, the more important the city i is in the Bay Area urban agglomeration. The closer the communication relationship in the urban agglomeration, the deeper the degree of mutual learning, competition and reference.
Because we will use PCA to reduce the dimension of the data later, we choose economic condition variables which we can collect and add them into the model. Table 2 details the meanings of the related variables we used to construct the economic development index. By using Stata software, the 10 original index variables are standardized by Z-score to get the standardized variables, and then the subsequent principal component analysis is carried out on these standardized variables.
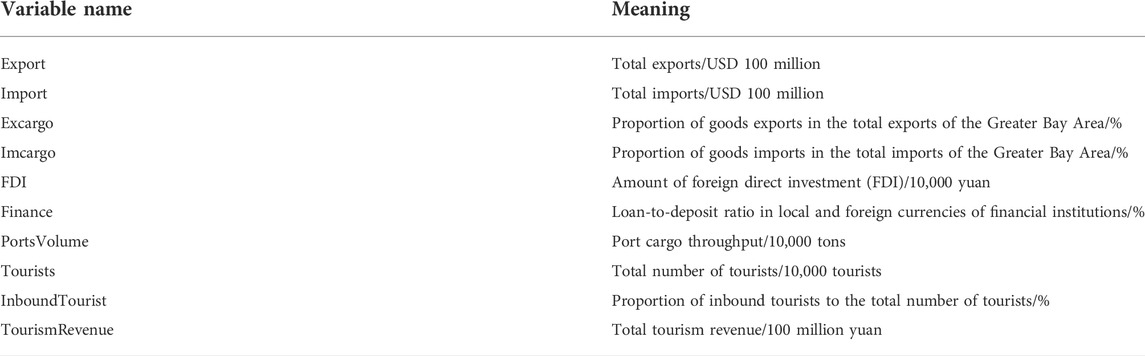
TABLE 2. Variable definition.
We found that the first three eigenvalues were greater than or close to 1, and the cumulative variance contribution rate reached 95.51%, so we chose m = 3, that is, dimension reduction of the first three principal components. The variance contribution rate reaches 95.51%, indicating that these three factors can explain variables. The contribution rate of specific principal components is shown in Table 3.
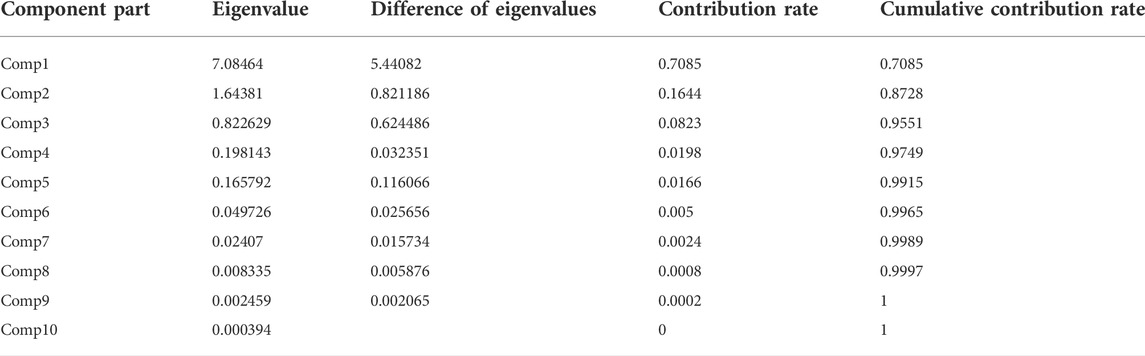
TABLE 3. Explanation of total variance.
Finally, using the eigenvectors in Table 4, we can calculate the scores of the first three most important principal components. Then, the economic development index is obtained by the following formula:
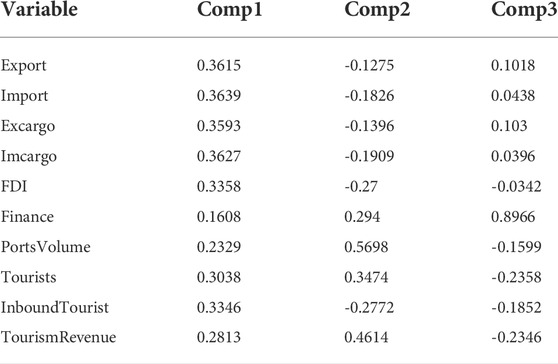
TABLE 4. Eigenvectors of the first three principal components.
Table 5 shows the economic development level of cities in the Greater Bay Area.
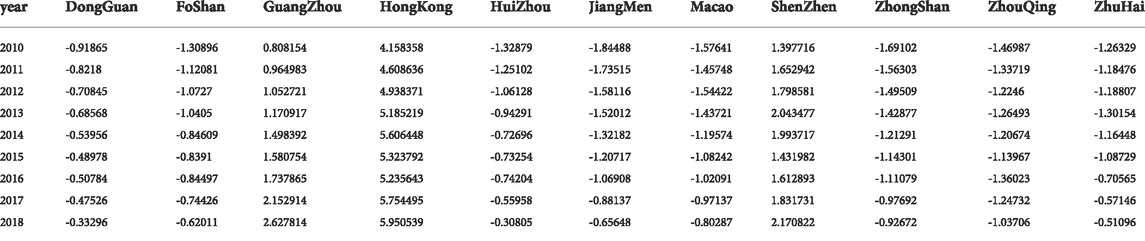
TABLE 5. Economic development index.
In this paper, the Bayesian estimation framework and MCMC sampling method are used to estimate the parameters of the TVP-VAR-SV model. Among them, the total number of MCMC samples is 11,000, the first 1,000 samples are used for the burning period, and the last 10,000 samples for parameter estimation. Table 6 shows the parameter estimation results of the TVP-VAR-SV model. Among them, CD convergence value (Geweke) and inefficiency factors are the indicators to measure the effect of MCMC. Geweke index is used to measure the convergence of the Markov Chain, while inefficiency factors are used to measure the number of irrelevant samples generated by model simulation.
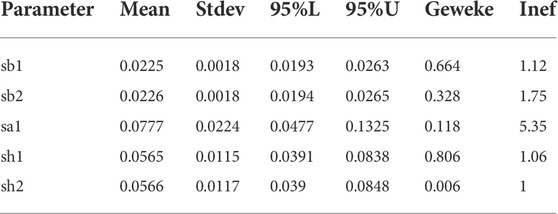
TABLE 6. Estimation results of TVP-VAR-SV model parameters.
As can be seen from Table 3, the average values of relevant parameters are all in the 95% confidence interval. However, the CD convergence values (Geweke) are all less than 1.96 (the critical value of 5%), which indicates that we can accept the original assumption of convergence to the posterior distribution, that is, 10,000 MCMC samples are enough to make effective parameter estimation. In addition, the invalid influence factors in Table 6 are all small values, which indicates that the samples produced in the MCMC sampling process are valid.
Figure 1 shows the autocorrelation coefficient, sample value path and posterior density of MCMC samples. It can be seen from Figure 1 that the autocorrelation coefficient of the sample changes around the value of 0, and the sampling path also changes smoothly around its mean value. The results in Table 6 and Figure 1 show that the model has achieved good estimation results.
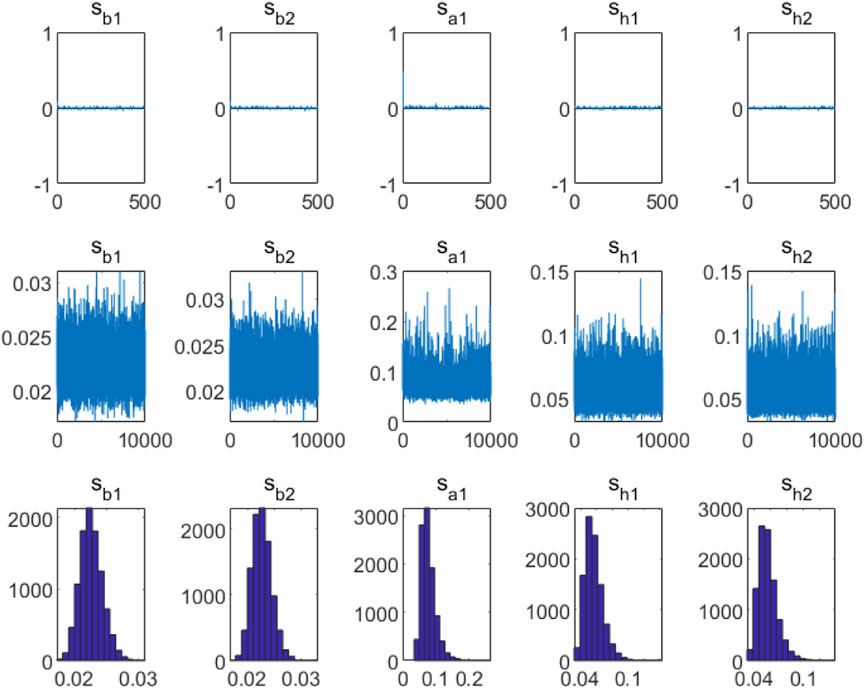
FIGURE 1. Estimation results of parameters of TVP-VAR-SV model.
Table 7 illustrates the average complex network of economic development variation among cities in Guangdong-Hong Kong-Macao Greater Bay Area in sample period. We estimated the connectedness of economic development among cities whose predicted step number H = 10 and lag order p = 1. The ij element in the table indicates the impact of the economic development variation in the city j on the economic development variation in the city i. Column sum without diagonal lines (“Diffusion Effect ”) indicates the total impact on other cities from city j; Row sum without diagonal lines (“Receiving Effect ”) shows the total impact from other cities to city i.
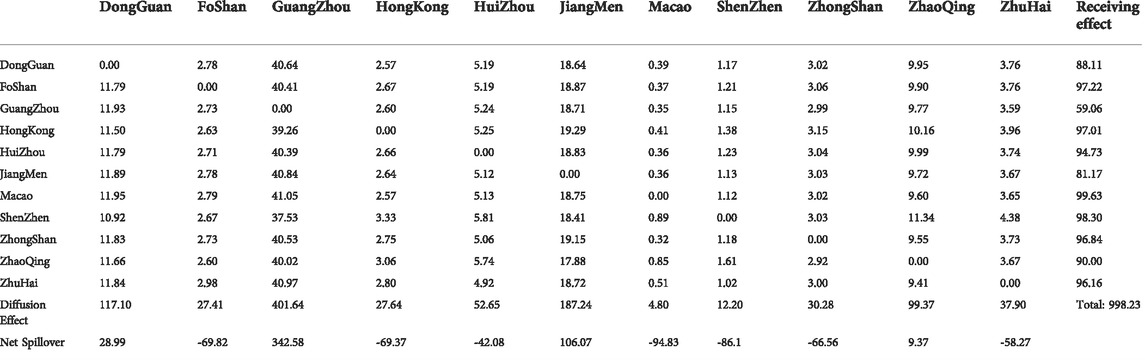
TABLE 7. Complex network for economic development of Guangdong-Hong Kong-Macao greater bay area.
As far as “ Receiving Effect ” is concerned, according to Table 7, Macao accounts for 99.63% - the biggest recipient (beneficiary) in Guangdong-Hong Kong-Macao Greater Bay Area’s economic development association network, followed by Shenzhen and Foshan, with 98.30 and 97.22% respectively, which means that compared with other cities in the Greater Bay Area, these three benefit most from the economic development of other cities and gain more from the overall development of the system.
As far as “ Diffusion Effect ” is concerned, Guangzhou is the largest transmitter (radiator) among 11 cities in the Greater Bay Area, hitting 401.64%, far more than Jiangmen (187.24%) and Dongguan (117.10%), the second and third. It demonstrates that in the overall development of Guangdong-Hong Kong-Macao Greater Bay Area, Guangzhou, a promoter for other cities, is playing a vital role in the development of the whole bay area system.
As far as “Net Spillover” is concerned, Table 7 indicates that among the 11 cities in the Greater Bay Area, Guangzhou is the most powerful economic engine in the development of the whole system, followed by Jiangmen and Dongguan. These three cities’ economic strengths can help gain huge economic momentum for the development of the whole system. If the economy of these three cities can be further improved, then other cities can get more net benefits from their economic and social development.
Figure 2 obviously shows the key nodes in the economic development network of 11 cities in Guangdong-Hong Kong-Macao Greater Bay Area. The size of nodes in Figure 2 refers to the Net Spillover’s influence of economic development. The larger the node is, the stronger the Net Spillover effect is. The direction of the edge is the same as the net spillover direction of the node, and the color of the edge is the same as that of its starting node. The size of the edge indicates the scale of Net Spillover. In this light, the thicker the edge is, the stronger the Net Spillover effect is.
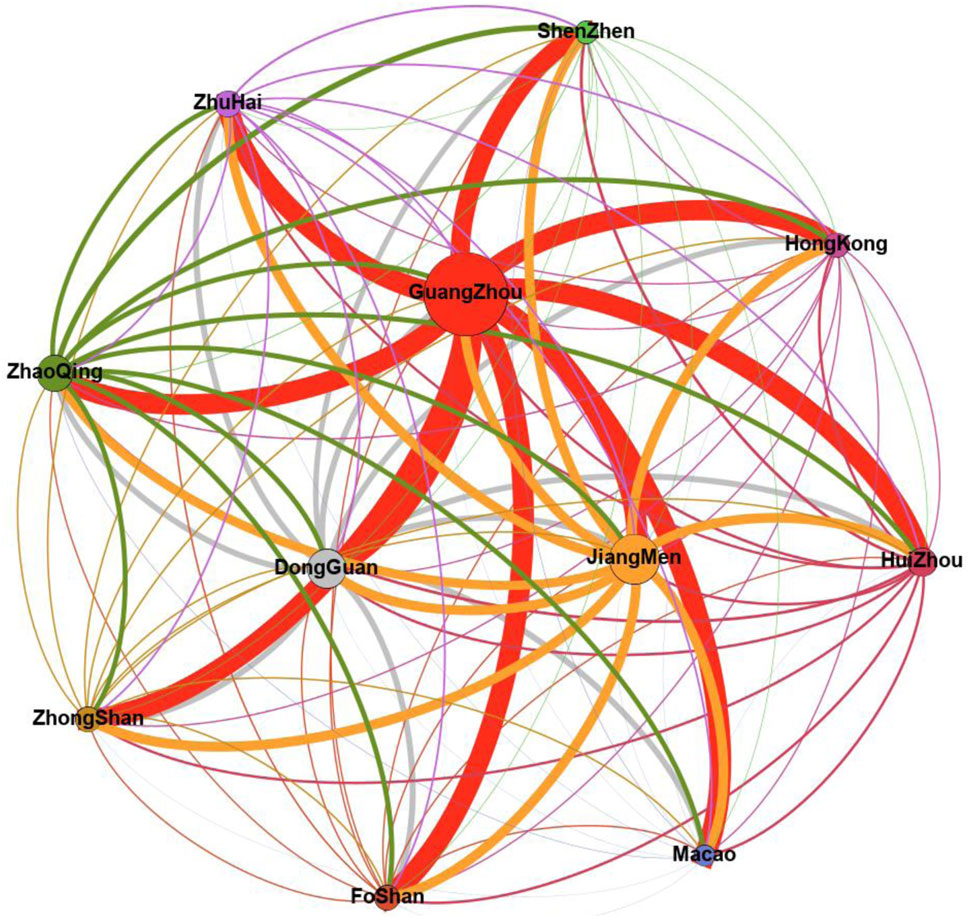
FIGURE 2. Complex network for economic development of Guangdong-Hong Kong-Macao greater bay area.
The results of this complex network figure are in line with that of Table 7. From the figure, it is obvious that Guangzhou is the most influential city in the economic network, and it is also the key node of Guangdong-Hong Kong-Macao Greater Bay Area’s economic development. In other words, as the leader of Guangdong-Hong Kong-Macao Greater Bay Area’s development, Guangzhou’s economic and social development will have the greatest additional boost to the other 10 cities and accordingly promote the whole Greater Bay Area in an effective way.
The above results indicate the following problems:
According to “ Diffusion Effect ”, Shenzhen hits 12.20%, indicating the driving effect of economic development of Shenzhen on other cities - it is much lower than expected - it is over 30 times lower than Guangzhou, the top one. This shows that Shenzhen has been in the expressway of economic growth during the past 10 years (its total GDP replaced Guangzhou in 2017 as the third largest city in China), however, these economic achievements have just kept in Shenzhen without significant radiation or spillover to other cities in Greater Bay Area. The reason is that Shenzhen is not only a prefecture-level city in Guangdong Province, but also a city under separate state planning. As a special economic zone in China, it implements special economic policies, flexible economic measures and a special economic management system with the aim of developing an export-oriented economy. In terms of fiscal revenue, for example, as a city under separate planning, Shenzhen only pays taxes to the central government rather than to Guangdong. Its retained taxes and financial returns are more than those of other cities in the Greater Bay Area. Thanks to the independence of policy status and the extroversion of the industrial chain, Shenzhen is actually “de-embedded” in the Pearl River Delta economic framework and thus has a greater impact on the overall state economy than that of the local. In other words, the economic spillover effect of Shenzhen on Guangdong-Hong Kong-Macao Greater Bay Area cities might be diluted or diverted by the national economic system.
Hong Kong scores 27.64% according to “ Diffusion Effect ” - it is the fourth lowest, though higher than Shenzhen, indicating that Hong Kong has not contributed much to the overall economic development of the Greater Bay Area in the past 10 years, and has not played a leading role in promoting the mainland cities in the Greater Bay Area, and the degree of integration is not high. The problems lie in that since the implementation of the Development Plan Outline of the Greater Bay Area, the administrative and policy thinking between Guangdong, Hong Kong and Macao remains the same as in the past. Central Government supports the integration of Hong Kong and Macao into the overall development of China and has introduced a number of measures to facilitate the development of Hong Kong and Macao residents on the mainland by taking advantage of the opportunities in the Greater Bay Area development. However, the deep-rooted “binary distinction and different treatment” in the governance of Hong Kong and Macao has not been eliminated entirely. Concepts, norms and laws that highlight the differences between the “two systems” can still be seen in the practice of construction of Guangdong-Hong Kong-Macao Greater Bay Area, such as Hong Kong and Macao have always been regarded as overseas, Hong Kong and Macao residents as foreign citizens, Hong Kong capital as foreign capital in the “one country” system. The result is that there is a lack of awareness of deep mutual trust in the community of the Greater Bay Area. If the dilemma of “the gate is open while the door is closed” persists in urban mobility, all efforts to promote the integration of Hong Kong and Macao may become passive role planning and obedience, in return, Hong Kong and Macao’s role in Greater Bay Area tend to be more blurred. As a result, there is still a gap in the policy status given to Hong Kong and Macao by the central government.
According to “Receiving Effect”, the value of Macao is 99.63%, which indicates that Macao has benefited most from the economic development of other cities. The reason can be found in Macao’s population size, industrial structure and functional orientation. By the end of 2020, Macao had a total population of 683,200, with a per capita GDP of more than 80,000 USD, making it the city with the highest per capita GDP in China. Macao’s industrial structure is dominated by the service industry, accounting for more than 90% of the regional GDP, which is characterized by service intensive. Compared with other cities in the Greater Bay Area, Macau’s economy is small but extroverted, and it is closely connected with the international market. Thanks to its urban orientation as a free international trade port and its economic policy of low tax rate, capital, logistics and personnel flow freely in Macau. At the same time, Macao’s unique historical culture, cultural landscape and ecological foundation have laid its unique advantages in tourism resources and provided an important bridge for trade and cultural exchanges between China and Portuguese-speaking countries. Driven by Guangdong-Hong Kong-Macao Greater Bay Area’s strategy, with the implementation of major policies such as Hong Kong-Zhuhai-Macao Bridge and Hengqin Free Trade Zone, Macao has entered the fast lane of development in recent years. Under the principle of “one country, two systems”, Macao’s small but sophisticated economic route and social strategy of actively integrating into the country enable it to gain more benefits from the overall development of the system.
Guangzhou is the largest in both “ Diffusion Effect ” and “Net Spillover”, indicating that Guangzhou’s economic development has placed a huge radiation spillover effect on other cities in Guangdong-Hong Kong-Macao Greater Bay Area - it is several times or even dozens of times the economic impact of other cities in this area. It is because Guangzhou is the capital of Guangdong Province and an important central city, international business center and comprehensive transportation hub in China. Boasting an advanced trade logistics network, Guangdong is able to allocate labor, land, resources, information, technology and other production factors in a reasonable association both in both spatial and timely manner. At the same time, Guangdong provincial government tries to open the channels of logistics, population mobility, capital flow and information flow in Guangdong-Hong Kong-Macao Greater Bay Area through institutional innovation, so that the circulation efficiency is up, circulation cost is down, the social resources put into production transform into productivity in a higher speed. Moreover, As a national historic and cultural city, this powerhouse of South China enjoys a second to none level of education, medical care, old-age care and entrepreneurship. In sum, Guangzhou gathers not only “things” but also “people”, it attracts the social resources of the surrounding cities, and radiates and feeds back the generated economic fruits to the surroundings even the whole country.
From the above, it can be concluded that in order to achieve a systematic development of Guangdong-Hong Kong-Macao Greater Bay Area in a way of twice the results for half the effort, we should give full play to Guangzhou’s role as a key node during the process of developing the related policies. In light of the uneven economic development and marketization among cities in the Guangdong-Hong Kong-Macao Greater Bay Area and the limited bargaining chips and ability for macroeconomic regulation and control of local governments, huge and continuous public financial expenditure is needed to achieve mutual integration and system optimization among the cities. Therefore, the central government should pay attention to the structural contradiction of the “fiscal division” between Guangzhou and Shenzhen in the policy arrangement. In addition, policy adjustment should focus on raising Guangzhou’s general budget revenue to enhance Guangzhou’s internal and external driving force of investment in the economy and people’s well-being projects of the Greater Bay Area, so that Guangzhou is able to play a leading role in the development of the Guangdong-Hong Kong-Macao Greater Bay Area.
As the attention paid by governments over the globe to the role of city clusters in regional development increased, an in-depth study of the complex network of economic growth within city clusters can further enhance the city clusters’ development. This paper took the Guangdong-Hong Kong-Macao Greater Bay Area city cluster as the research object and studied the connectedness network of economic development among 11 cities from the perspective of complex networks. Firstly, 10 indicators about cities’ economic development were chosen in the beginning and were decomposed by Principal Component Analysis into three main components, which were further built into a comprehensive evaluation index of the economic development of the cities. Secondly, a new method—the TVP-VAR-SV model and MCMC method - were adopted to build a complex network of these economic development variation. This MCMC-based complex network can effectively solve the problem of failing to build a complex network due to the lack of sample data. This paper found that Macao, on one hand, is the largest beneficiary of the complex network of economic development in the Greater Bay Area. Guangzhou, on the other hand, performs as the largest radiator in this complex network of economic development. That is to say, when making the development policies of the Guangdong-Hong Kong-Macao Greater Bay Area, we must make full use of Guangzhou’s role as a key node to achieve an effective systematic development. Meanwhile, Shenzhen and Hong Kong enjoy more advanced economic development compared with other cities in the city cluster, the spillover effects of these two most developed cities, however, are much lower than that of Guangzhou, which is not in line with their economic status. To pursue high-quality development of the whole Bay Area city cluster, Shenzhen and Hong Kong should perform their leading roles in the economy by improving their integration with other cities, and further promoting the integration of economic development in the Greater Bay Area.
The original contributions presented in the study are included in the article/supplementary material, further inquiries can be directed to the corresponding author.
QF performed the funding acquisition and data collection, wrote the original formal draft, performed editing. SZ performed the writing-review; editing. FL proposed the methodology, gave the formal data analysis and wrote the original formal draft.
This research was financially supported by the National Social Science Fund of China (20CKS056): Research on Strengthening the National Identity of Hong Kong and Macao Teenagers under the New Situation of “One Country, Two Systems”.
The authors declare that the research was conducted in the absence of any commercial or financial relationships that could be construed as a potential conflict of interest.
All claims expressed in this article are solely those of the authors and do not necessarily represent those of their affiliated organizations, or those of the publisher, the editors and the reviewers. Any product that may be evaluated in this article, or claim that may be made by its manufacturer, is not guaranteed or endorsed by the publisher.
2. Taylor PJ. The challenge facing world city network analysis[EB/OL]. GaWC Res Bull (2012) 409:09–25.
3. He DH, Yuan Y, Liu YT, Wang XM. The urban development strategy of cross-regional integration based on the network connection: A case of yangjiang city surrounding Guangdong-Hong Kong-Macao greater bay area. Development Small Cities Towns (2021) 39(10):15–22. doi:10.3969/j.issn.1009-1483.2021.10.003
4. Meijers E, Hoogerbrugge M, Cardoso R. Beyond polycentricity: Does stronger integration between cities in polycentric urban regions improve performance? J Econ Hum Geogr (2018) 109(1):1–21.
5. Zhou CS, Luo LJ, Shi CY, Wang JH. Spatio-temporal evolutionary characteristics of the economic development in the Guangdong-Hong Kong-Macao greater bay area and its influencing factors. Trop Geogr (2017) 37(6):802–13.
6. Wang FF, Yang HH. Research on the urban agglomeration spatial economic network structure of guangdong ‐ hongkong ‐ Macao greater bay area and its influencing factors: Based on analytic network process. J South China Normal Univ (Social Sci Edition) (2018) 63(04) 110–20.
7. Liu QF, Wang ZF. Evolution and network effects of economic spatial correlationin the Guangdong-Hong Kong-Macao greater bay area. Geogr Geo-Information Sci (2022) 38(2):55–62. doi:10.3969/j.issn.1672-0504.2022.02.008
8. Meng F, Lu ZG, Qin YR. Spatio-temporal evolution and influencing factors of economic differences in Guangdong-Hong Kong-Macao greater bay area. Stat Decis (2021) 37(08):116–20. doi:10.13546/j.cnki.tjyjc.2021.08.025
9. Shi XG, Hu LT. Research on the evolution of logistics network spatial structure of urban agglomeration—based on data analysis of Guangdong-Hong Kong-Macao greater bay area. Price Theor Pract (2022) 42(01) 152–5. doi:10.19851/j.cnki.CN11-1010/F.2022.01.014
10. Diebold FX, Yilmaz K. Measuring financial asset return and volatility spillovers, with application to global equity markets. Econ J (2009) 119:158–71.
11. Diebold FX, Yilmaz K. Better to give than to receive: Predictive directional measurement of volatility spillovers. Int J Forecast (2012) 28:57–66.
12. Diebold FX, Yilmaz K. On the network topology of variance decompositions: Measuring the connectedness of financial firms. J Econom (2014) 182(1):119–34. doi:10.1016/j.jeconom.2014.04.012
13. Primiceri GE. Time varying structural vector autoregressions and monetary policy. Rev Econ Stud (2005) 72:821–52.
14. Nakajima J, Kasuya M, Watanabe T. Bayesian analysis of time-varying parameter vector autoregressive model for the Japanese economy and monetary policy. J Jpn Int Economies (2011) 25:225–45.
15. Koop G, Pesaran MH, Potter SM. Impulse response analysis in nonlinear multivariate models. J Econom (1996) 74:119–47.
16. Pesaran HH, Shin Y. Generalized impulse response analysis in linear multivariate models. Econ Lett (1998) 58:17–29.
Keywords: Guangdong-Hong Kong-Macao Greater Bay Area, city cluster, economic development index, complex network, principal component analysis method, TVP-VAR-SV model
Citation: Feng Q, Zhu S and Lai F (2022) A complex network study on Guangdong-Hong Kong-Macao Greater Bay Area based on economic development index. Front. Phys. 10:1018219. doi: 10.3389/fphy.2022.1018219
Received: 12 August 2022; Accepted: 15 September 2022;
Published: 05 October 2022.
Edited by:
Jianbo Wang, Southwest Petroleum University, ChinaReviewed by:
Tsun Se Cheong, Hang Seng University of Hong Kong, Hong Kong SAR, ChinaCopyright © 2022 Feng, Zhu and Lai. This is an open-access article distributed under the terms of the Creative Commons Attribution License (CC BY). The use, distribution or reproduction in other forums is permitted, provided the original author(s) and the copyright owner(s) are credited and that the original publication in this journal is cited, in accordance with accepted academic practice. No use, distribution or reproduction is permitted which does not comply with these terms.
*Correspondence: Fujun Lai, bGZqbGZqOTk5QDE2My5jb20=
Disclaimer: All claims expressed in this article are solely those of the authors and do not necessarily represent those of their affiliated organizations, or those of the publisher, the editors and the reviewers. Any product that may be evaluated in this article or claim that may be made by its manufacturer is not guaranteed or endorsed by the publisher.
Research integrity at Frontiers
Learn more about the work of our research integrity team to safeguard the quality of each article we publish.