 Lei Hou*
 Yueling Pan
- School of Management Science and Engineering, Nanjing University of Information Science and Technology, Nanjing, China
Financial markets are widely believed to be complex systems where interdependencies exist among individual entities in the system enabling the risk spillover effect. The detrended cross-correlation analysis (DCCA) has found wide applications in examining the comovement of fluctuations among financial time series. However, to what extent can such cross-correlation represent the spillover effect is still unknown. This article constructs the DCCA network of commodity future markets and explores its proximity to the volatility spillover network. Results show a moderate agreement between the two networks. Centrality measures applied to the DCCA networks are able to identify key commodity futures that are transmitting or receiving risk spillovers. The evolution of the DCCA network reveals a significant change in the network structure during the COVID-19 pandemic in comparison to that of the pre- and post-pandemic periods. The pandemic made the commodity future markets more interconnected leading to a shorter diameter for the network. The intensified connections happen mostly between commodities from different categories. Accordingly, cross-category risk spillovers are more likely to happen during the pandemic. The analysis enriches the applications of the DCCA approach and provides useful insights into understanding the risk dynamics in commodity future markets.
Introduction
Financial markets play a critical role in economic development but have been severely threatened by a wide range of socio-economic events in recent decades, such as the subprime mortgage crisis in 2008, the US–China trade war, and the COVID-19 pandemic [1–3]. Rich and in-depth investigations into these events have demonstrated that the risks not only influence each individual entity in the system but also spread among the entities and evolve into system-wide crises. In other words, the entities in a financial market are interdependent on each other, forming a complex networked system that enables the contagion of risks through the interdependencies [4–6]. Financial systems are thus normally modeled as networks, such as the networks of financial institutions [7, 8], the network of stock indices [9], and the network of commodity futures [10]. The key technique for the construction of a financial network is the quantification of the interdependencies among individual entities. However, for many financial systems (e.g., stock market and future market), such interdependencies between entities (e.g., stock indices and commodity futures) cannot be directly observed. To quantify the pair-wise and system-wise connectedness is accordingly vital to the understanding of the dynamics of risk contagion in financial systems.
In the literature on the volatility spillover effect, connectedness is normally explored as the extent to which a shock in one entity’s time series (e.g., stock price and return) could lead to changes in other entities [11, 12]. Techniques based on vector auto-regression (VAR) are widely applied to study such a problem, and various measures have been accordingly developed. One of the most acknowledged metric frameworks is proposed by Diebold and Yilmaz [13–15]. Instead of studying the spillover effect from one time series to another, they apply variance decomposition to an N-variable VAR. Accordingly, the share of the forecast error variation for a target time series from each of the other time series in the system can be quantified simultaneously. The pair-wise spillover effect is thus directly measured by the results of variance decomposition. Since such a spillover effect is regarded as directional, the ability of an entity to transmit risks can be quantified by totaling the spillover effect from it to all others (out-degree), while the extent of an entity being influenced by others can be quantified by totaling the spillover effect received by the entity (in-degree). Such a method and its variations have been applied to construct and analyze a wide range of financial networks. For example, Yang and Zhou constructed a time-varying volatility spillover network of countries according to the VIX of several major national stock market indices and uncovered the central role of the US market [16]. The spillover effect from the US market to others has intensified since the 2008 global financial crisis. Balcilar et al. investigated the spillover effect among the prices of agricultural futures and crude oil futures and identified two sets of commodity futures to be risk transmitters and risk receivers, respectively [17]. Shen et al. explored the connectedness of different economic sectors in China and found that the sectors such as mechanical equipment act as risk transmitters, while sectors such as banking are the main risk takers [18]. Overall, the variance decomposition framework based on the VAR model has shown effectiveness in representing the volatility spillover effect in financial systems.
Given the nature of financial markets as complex systems, the interdependencies among financial entities have also caught widespread attention in the field of econophysics and complexity science. The detrended cross-correlation analysis (DCCA) [19, 20] has been the most acknowledged and applied technique in the analysis of cross-correlations between financial time series, such as commodity future prices [21, 22] and stock trading volumes or prices [23, 24]. Since there could potentially be cross-correlations between any two financial time series, financial markets can thus be linked into networks [25–27]. The analysis of DCCA networks also has the potential to measure the importance of each individual entity in the whole system. For example, Pereira et al. applied centrality measures of weighted degree and PageRank to the DCCA network of 20 regional stock markets and concluded that European markets play a central role in the world’s financial markets [28]. Mbatha and Alovokpinhou constructed the network of 134 companies from the South African stock market and found that the financial industry plays the most prominent role [29].
When the VAR-based methods characterize the directional relationship that a shock in one time series leads to the volatility change in another time series within a given lag time, the DCCA approach describes the bilateral relationship of co-fluctuation of two time series. In spite of the widespread applications of the DCCA approach in investigating the dynamics of financial networks [8, 27–32], whether, or to what extent, can such an approach represent the volatility spillover effect as indicated by the VAR-based measures is still unclear. The exploration of such a research question is crucial to deepen the understanding of the dynamics of complex financial systems, as well as enrich the application of the DCCA approach.
Focusing on the commodity future market, this article applies both the VAR-based volatility spillover measures and the DCCA coefficient to construct networks of the 19 commodities. Two research questions are thereby explored: 1) to what extent can the DCCA network depict the volatility spillover effect among commodity futures; and 2) how is the DCCA network of commodity futures evolving over time. Centrality measures are applied to the DCCA network, which are found with high effectiveness to identify the key risk takers, while moderate effectiveness to uncover key risk transmitters. Further dynamical analysis of the DCCA network reveals the dramatic impact of COVID-19 on the topology of the DCCA network with intensified cross-category risk spillovers.
Materials and methods
Detrended cross-correlation analysis
The fluctuation of a wide range of real-world time series is found with strong scaling behavior, and the detrended fluctuation analysis (DFA) is proposed to analyze such a phenomenon [33, 34]. Given a time series
Normally, the relationship between the detrended fluctuation and the window size follows a power-law, that is,
While DFA deals with the fluctuations of a single time series, the DCCA approach is proposed to investigate the co-fluctuation of two time series [19, 20]. For the scenario of two time series, say,
Similar to DFA, the co-fluctuation of the two time series is also expected to follow a power-law relationship with the window size, i.e.,
The DCCA coefficient
Measures for the volatility spillover
While a number of measures have been proposed to characterize the connectedness and volatility spillover effect in financial systems, this article adopts a widely used approach developed by Diebold and Yilmaz [13–15].
Considering a set of
where
where
Accordingly, for each time series
which corresponds to the out-degree of
which is basically the in-degree of
Throughout the analysis, we set the predictive horizon to
Data collection
The future market has been one of the major financial systems that attracted widespread attention in the literature, where strong spillover effects have been frequently uncovered [34, 35]. Meanwhile, the DCCA approach has also found applications in characterizing the cross-correlation among different future markets [21, 22, 36]. The present study thereby adopts the future market as the detailed context to explore the proximity of the DCCA network to the volatility spillover effect and the dynamics of the commodity future network.
Given the purpose of the present analysis, we mainly focus on the commodity contracts in the US market. The various commodities can be divided into five major categories, namely, metals, softs, energy, meats, and grain. While there are normally many commodity futures in each category, here we only consider the commodity futures that are most traded for each category. To be more specific, gold, copper, and silver are selected for metal future contracts; coffee, sugar, orange juice, and cocoa are selected for soft crop future contracts; crude oil, natural gas, heating oil, and gasoline are selected for energy future contracts; live cattle, lean hogs, and feeder cattle are selected for meat future contracts; and rough rice, soybean oil, soybean meal, corn, and oats are selected for grain future contracts. The detailed data were downloaded from Thomson Reuters Datastream, which is a live database for various financial systems. Our data span 9 years, from 1 January 2013 to 31 December 2021. For each trading day, we collect the open, high, low, and close indexes. In other words, the time series to be analyzed are the 9-year-long daily prices of 19 commodity futures.
Results
Static analysis
We first construct and analyze the volatility spillover network and DCCA network using the full 9-year data. Both networks consist of 19 nodes, with each being one commodity future market. The networks are fully connected with different weights on links. The weight of a link in the DCCA network is the absolute value of the cross-correlation coefficient
As shown in Figure 1, the spillover network and DCCA network of the 19 commodity futures show similar structures, in spite of the fact that the former is directed while the latter is undirected. Energy futures of crude oil, heating oil, and gasoline form a strongly connected triad in both networks. The metal futures of copper, silver, and gold are also closely interconnected. On the other hand, the soft futures, including orange juice, sugar, cocoa, and coffee, are loosely connected to others in either the spillover network or the DCCA network. To get a more generalized quantification of the similarity between the cross-correlation and spillover effect, we calculate the Pearson correlation coefficient between the values of
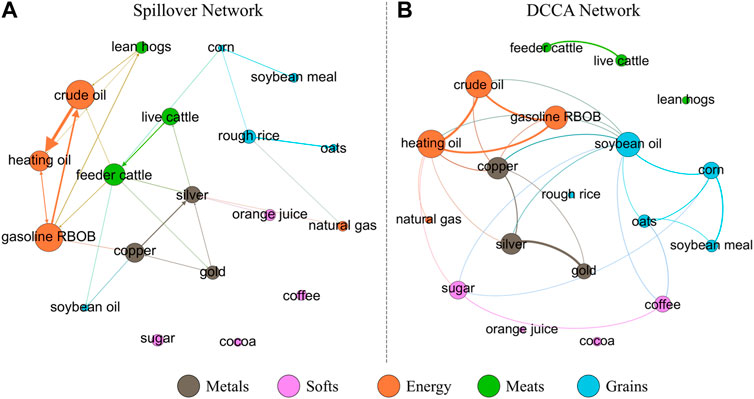
FIGURE 1. Volatility spillover network (A) and DCCA network (B) of 19 commodity futures. The links in the spillover network are directed, and only those with a weight of
The volatility spillovers are actually directed, and thus the risk transmitters and risk receivers can be identified by the spillover network via the measures of to-connectedness (out-degree) and from-connectedness (in-degree), respectively. However, the DCCA coefficient is bilateral with no direction. An apparent question is whether the DCCA network of commodities can help to identify the key risk transmitters and risk receivers. Here, we further apply four basic centrality measures to the DCCA network to examine the accuracy of predicting the risk transmitters and risk receivers.
Since the links in the DCCA network are weighted, the degree centrality of a commodity
We apply the four centrality measures to the constructed DCCA network of commodity future markets to calculate the centralities for each commodity. To test the ability of these centrality measures in identifying the risk transmitters (to-connectedness, as defined in Eq. 7) and risk receivers (from-connectedness, as defined in Eq. 8), we calculate the Pearson correlation coefficients which are reported in Table 1. For the to-connectedness, i.e., the spillovers transmitted by a commodity to others, the centrality measures of degree, eigenvector, and PageRank show moderate accuracies with correlations ranging from 0.479 to 0.549. However, the closeness centrality has a very low correlation of 0.225 to the to-connectedness of commodities. For the from-connectedness, i.e., the spillovers received by a commodity, these centrality measures show higher accuracies. In other words, the centrality measures, including degree, eigenvector, and PageRank, applied to the DCCA network are strongly correlated to the from-connectedness while moderately correlated to the to-connectedness.
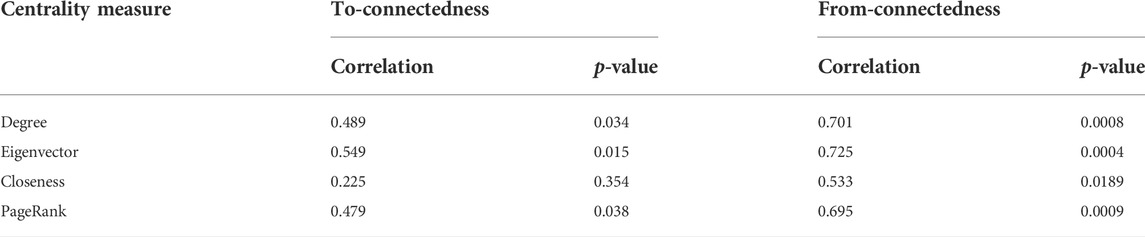
TABLE 1. Pearson correlation coefficients between the centrality measures in the DCCA network and spillover effects, as measured by to-connectedness
We also compare the most important top five commodities as identified by different measures, as shown in Table 2. According to the volatility spillover effect, the energy futures, including heating oil, crude oil, and gasoline, are the key risk transmitters and at the same time risk receivers. These commodities are also identified by degree centrality, eigenvector centrality, and PageRank centrality as the most influential node in the DCCA network. However, differences between the spillover network and the DCCA network can also be observed. While feeder cattle are also an important risk transmitter and risk receiver, centrality measures in DCCA failed to uncover such an important role. In contrast, soybean oil is evaluated to be an imported commodity in the DCCA network, but it does not transmit nor receive much spillover effect. Despite the different focuses on the two approaches, the DCCA network can be used to identify the key risk transmitters and risk receivers with moderate accuracy.
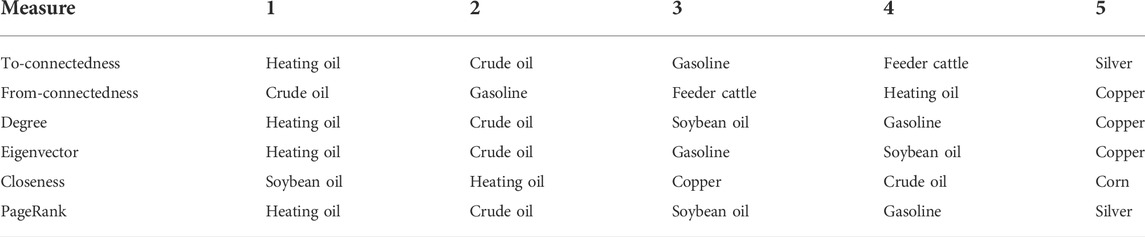
TABLE 2. Top five commodity future markets with the highest values for to-connectedness
Dynamics of the DCCA network
We further analyze how the DCCA network of commodity future markets has evolved over the past 9 years by constructing a DCCA network for each year. Figure 2 visualizes the DCCA network for 2013, 2017, and 2020, respectively. Intuitively, the cross-correlations among commodities are becoming stronger, and thus the DCCA network gets more connected over the years.
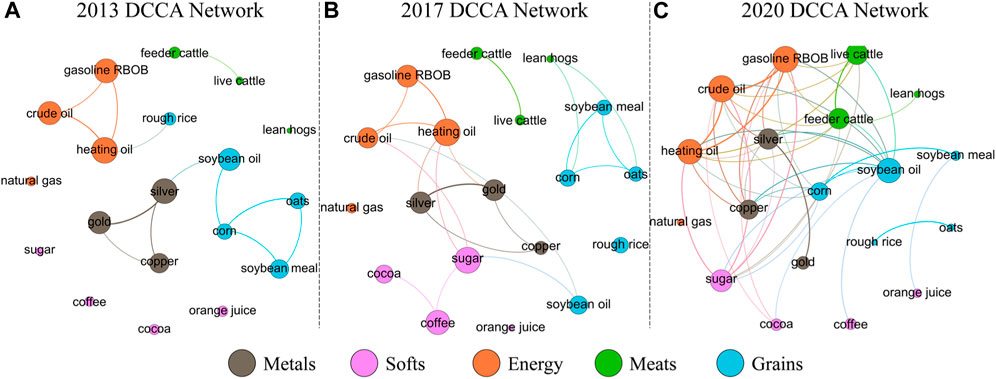
FIGURE 2. DCCA networks of the commodity futures markets in 2013 (A), 2017 (B), and 2020 (C) respectively. Only links with a weight larger than 0.35 are displayed, and the node size is proportional to the degree
To quantitatively explore the dynamics of the network, we focus on four structural features, namely, the average weight, average distance, clustering coefficient, and category modularity. The average weight of the DCCA network is calculated as
As shown in Figure 3, the connectedness of the DCCA network, i.e., the average weight, has remained at a relatively stable level ranging from 0.15 to 0.18 during the period from 2013 to 2019. However, the connectedness dramatically increased to 0.236 in 2020. Such a result indicates that the COVID pandemic that broke out at the end of 2019 significantly affected the commodity future markets, making them more strongly interconnected. Due to the intensified connections among the commodities, the average distance of the DCCA network decreased, meaning that it becomes easier for risks to spread from one commodity future market to another. Meanwhile, the clustering coefficient largely increased in 2020, indicating that strong triadic cross-correlations are formed under the impact of the pandemic. The overall category modularity saw a dramatic decrease in 2020, that is, the ratio of intra-category links over all links has decreased.
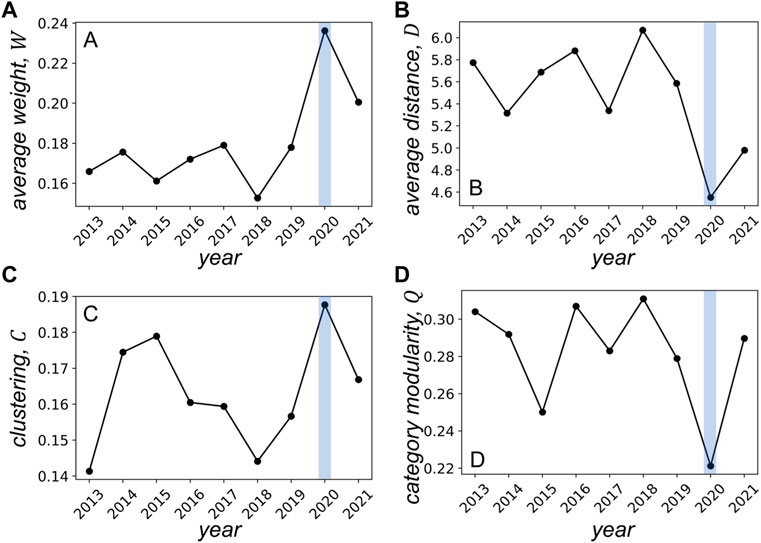
FIGURE 3. Average weight (A), average distance (B), clustering coefficient (C), and category modularity (D) of the yearly DCCA network of commodity future markets.
To have a closer examination of the dynamics of connection patterns in the DCCA network, we investigate how the intra-category links and inter-category links for each category of commodities are evolving. For each category of commodities
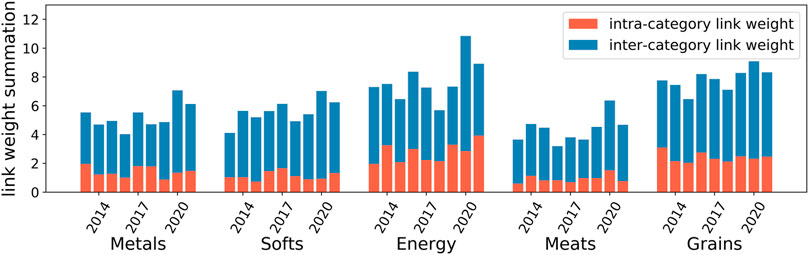
FIGURE 4. Stacked bar plot for yearly weight summation of intra- and inter-category links.
Despite the dramatic impact the pandemic has made on the connectedness of the DCCA network of commodity future in 2020, such impact does not maintain. As reported in Figure 3, all the network features recovered, to some extent, from the pandemic’s impact in 2021, especially for the clustering (Figure 3C) and category modularity (Figure 3D), the 2021 network shows very similar values as compared to the pre-pandemic networks. The average weight (Figure 3A) and average distance (Figure 3B) of the 2021 network are also not as dramatic as that of 2020. Such recovery of the network structure is partially because of the ease of the pandemic situation in 2021 and also indicates that the extreme external events normally would only make a temporary impact on financial markets.
Conclusion and discussion
Risk spreading in complex financial systems has been widely acknowledged to be central to the understanding of the system dynamics. Different streams of research have developed various approaches to construct networks of financial systems, including the VAR-based approach which measures the extent to which the shock in one financial market influences another with a given time lag, and the DCCA-based approach which measures the comovement of fluctuations between two financial time series. The present article offers a comparison between the networks of commodity future markets constructed by such two streams of approach. The cross-correlation is found with moderate proximity to the spillover network. The centrality measures applied to the DCCA network, including degree, eigenvector, and PageRank, are able to identify risk transmitters and risk receivers. The results indicate the effectiveness of the DCCA network in characterizing the structure of the volatility spillover effect. The cross-correlations among financial time series can thus also serve as an important approach for investors to monitor the risks in financial systems and develop appropriate investment strategies accordingly. However, the DCCA network is not always accurate. For example, soybean oil is identified by the DCCA network as one of the most important commodity future markets, but it is not a key risk transmitter nor a risk receiver. Thus, the difference between the cross-correlation and volatility spillover effect should be considered in the application of DCCA when investigating risk dynamics in financial systems.
The COVID-19 pandemic is revealed to be influential on the connectedness of the commodity future markets. The DCCA network of 2020 is found with stronger average cross-correlations, shorter average distance, and stronger clustering features. In particular, it is found that the cross-correlations between commodities from the same category did not change much, while that between commodities from different categories have become stronger in 2020. Such a result suggests a higher risk of cross-category spillover during the pandemic. This observation is in line with previous findings that financial systems tend to have stronger connectedness during a wide range of extreme external events such as financial crises and pandemics [16, 17]. Thus, investors should be cautious about the intensified risk contagions among commodity future markets during extreme events, especially the cross-category risk spillovers. An interesting observation in this article is that the average degree, average distance, clustering, and category modularity in the 2021 network began to recover to almost the level of pre-pandemic. However, due to the limited time range of the applied data, the present article is unable to track the recovery dynamics of the network of commodity future markets. Future research shall further explore the mechanism and timeliness of the recovery process of financial networks after dramatic structural changes caused by external events.
Data availability statement
The original contributions presented in the study are included in the article/Supplementary Material; further inquiries can be directed to the corresponding author.
Author contributions
Both authors contributed to the study design, data collection, data analysis, and writing.
Funding
The study was partially supported by the Social Science Fund of Jiangsu Province (Grant No. 21TQC005) and the Social Science Foundation of the Jiangsu Higher Education Institutions (Grant No. 2021SJA0164).
Conflict of interest
The authors declare that the research was conducted in the absence of any commercial or financial relationships that could be construed as a potential conflict of interest.
Publisher’s note
All claims expressed in this article are solely those of the authors and do not necessarily represent those of their affiliated organizations, or those of the publisher, the editors, and the reviewers. Any product that may be evaluated in this article, or claim that may be made by its manufacturer, is not guaranteed or endorsed by the publisher.
References
1. Schweitzer F, Fagiolo G, Sornette D, Vega-Redondo F, Vespignani A, White DR. Economic networks: The new challenges. Science (2009) 325(5939):422–5. doi:10.1126/science.1173644
2. Zhang D, Hu M, Ji Q. Financial markets under the global pandemic of COVID-19. Financ Res Lett (2020) 36:101528. doi:10.1016/j.frl.2020.101528
3. An J, Mikhaylov A, Richter UH. Trade war effects: Evidence from sectors of energy and resources in Africa. Heliyon (2020) 6(12):e05693. doi:10.1016/j.heliyon.2020.e05693
5. Gai P, Kapadia S. Contagion in financial networks. Proc R Soc A (2010) 466(2120):2401–23. doi:10.1098/rspa.2009.0410
6. Jackson MO, Pernoud A. Systemic risk in financial networks: A survey. Annu Rev Econ (2021) 13:171–202. doi:10.1146/annurev-economics-083120-111540
7. Elyasiani E, Kalotychou E, Staikouras SK, Zhao G. Return and volatility spillover among banks and insurers: Evidence from pre-crisis and crisis periods. J Financ Serv Res (2015) 48(1):21–52. doi:10.1007/s10693-014-0200-z
8. Wang GJ, Yi S, Xie C, Stanley HE. Multilayer information spillover networks: measuring interconnectedness of financial institutions. Quant Finance (2021) 21(7):1163–85. doi:10.1080/14697688.2020.1831047
9. Heiberger RH. Stock network stability in times of crisis. Physica A: Stat Mech its Appl (2014) 393:376–81. doi:10.1016/j.physa.2013.08.053
10. Xiao B, Yu H, Fang L, Ding S. Estimating the connectedness of commodity futures using a network approach. J Futures Markets (2020) 40(4):598–616. doi:10.1002/fut.22086
11. Akkoc U, Civcir I. Dynamic linkages between strategic commodities and stock market in Turkey: Evidence from SVAR-DCC-GARCH model. Resour Pol (2019) 62:231–9. doi:10.1016/j.resourpol.2019.03.017
12. Jung RC, Maderitsch R. Structural breaks in volatility spillovers between international financial markets: Contagion or mere interdependence? J Banking Finance (2014) 47:331–42. doi:10.1016/j.jbankfin.2013.12.023
13. Diebold FX, Yilmaz K. Measuring financial asset return and volatility spillovers, with application to global equity markets. Econ J (2009) 119(534):158–71. doi:10.1111/j.1468-0297.2008.02208.x
14. Diebold FX, Yilmaz K. Better to give than to receive: predictive directional measurement of volatility spillovers. Int J Forecast (2012) 28(1):57–66. doi:10.1016/j.ijforecast.2011.02.006
15. Diebold FX, Yılmaz K. On the network topology of variance decompositions: Measuring the connectedness of financial firms. J Econom (2014) 182(1):119–34. doi:10.1016/j.jeconom.2014.04.012
16. Yang Z, Zhou Y. Quantitative easing and volatility spillovers across countries and asset classes. Manage Sci (2017) 63(2):333–54. doi:10.1287/mnsc.2015.2305
17. Balcilar M, Gabauer D, Umar Z. Crude Oil futures contracts and commodity markets: New evidence from a TVP-VAR extended joint connectedness approach. Resour Pol (2021) 73:102219. doi:10.1016/j.resourpol.2021.102219
18. Shen YY, Jiang ZQ, Ma JC, Wang GJ, Zhou WX. Sector connectedness in the Chinese stock markets. Empir Econ (2022) 62(2):825–52. doi:10.1007/s00181-021-02036-0
19. Podobnik B, Stanley HE. Detrended cross-correlation analysis: a new method for analyzing two nonstationary time series. Phys Rev Lett (2008) 100(8):084102. doi:10.1103/physrevlett.100.084102
20. Zebende GF. DCCA cross-correlation coefficient: Quantifying level of cross-correlation. Physica A: Stat Mech its Appl (2011) 390(4):614–8. doi:10.1016/j.physa.2010.10.022
21. Liu L. Cross-correlations between crude oil and agricultural commodity markets. Physica A: Stat Mech its Appl (2014) 395:293–302. doi:10.1016/j.physa.2013.10.021
22. Wang J, Shao W, Kim J. Analysis of the impact of COVID-19 on the correlations between crude oil and agricultural futures. Chaos Solitons Fractals (2020) 136:109896. doi:10.1016/j.chaos.2020.109896
23. Podobnik B, Horvatic D, Petersen AM, Stanley HE. Cross-correlations between volume change and price change. Proc Natl Acad Sci U S A (2009) 106(52):22079–84. doi:10.1073/pnas.0911983106
24. Pan Y, Hou L, Pan X. Interplay between stock trading volume, policy, and investor sentiment: A multifractal approach. Physica A: Stat Mech its Appl (2022) 603:127706. doi:10.1016/j.physa.2022.127706
25. Adam AM, Kyei K, Moyo S, Gill R, Gyamfi EN. Multifrequency network for SADC exchange rate markets using EEMD-based DCCA. J Econ Finan (2022) 46(1):145–66. doi:10.1007/s12197-021-09560-w
26. Li J, Shi Y, Cao G. Topology structure based on detrended cross-correlation coefficient of exchange rate network of the belt and road countries. Physica A: Stat Mech its Appl (2018) 509:1140–51. doi:10.1016/j.physa.2018.06.059
27. Ferreira P, Tilfani O, Pereira E, Tavares C, Pereira H, El Boukfaoui MY. Dynamic connectivity in a financial network using time-varying DCCA correlation coefficients. Econometric Res Finance (2021) 6(1):57–75. doi:10.2478/erfin-2021-0004
28. Pereira E, Ferreira P, da Silva M, Miranda J, Pereira H. Multiscale network for 20 stock markets using DCCA. Physica A: Stat Mech its Appl (2019) 529:121542. doi:10.1016/j.physa.2019.121542
29. Mbatha VM, Alovokpinhou SA. The structure of the South African stock market network during COVID-19 hard lockdown. Physica A: Stat Mech its Appl (2022) 590:126770. doi:10.1016/j.physa.2021.126770
30. Wang GJ, Xie C, ChenYJChen S. Statistical properties of the foreign exchange network at different time scales: evidence from detrended cross-correlation coefficient and minimum spanning tree. Entropy (2013) 15(5):1643–62. doi:10.3390/e15051643
31. Shin KH, Lim G, Min S. Dynamics of the global stock market networks generated by DCCA methodology. Appl Sci (2020) 10(6):2171. doi:10.3390/app10062171
32. Peng CK, Buldyrev SV, Havlin S, Simons M, Stanley HE, Goldberger AL. Mosaic organization of DNA nucleotides. Phys Rev E (1994) 49(2):1685–9. doi:10.1103/physreve.49.1685
33. Hu K, Ivanov PC, Chen Z, Carpena P, Stanley HE. Effect of trends on detrended fluctuation analysis. Phys Rev E (2001) 64(1):011114. doi:10.1103/physreve.64.011114
34. Kang SH, McIver R, Yoon SM. Dynamic spillover effects among crude oil, precious metal, and agricultural commodity futures markets. Energy Econ (2017) 62:19–32. doi:10.1016/j.eneco.2016.12.011
35. Gong X, Liu Y, Wang X. Dynamic volatility spillovers across oil and natural gas futures markets based on a time-varying spillover method. Int Rev Financial Anal (2021) 76:101790. doi:10.1016/j.irfa.2021.101790
36. Zhang S, Guo Y, Cheng H, Zhang H. Cross-correlations between price and volume in China's crude oil futures market: A study based on multifractal approaches. Chaos Solitons Fractals (2021) 144:110642. doi:10.1016/j.chaos.2020.110642
37. Saramäki J, Kivelä M, Onnela JP, Kaski K, Kertesz J. Generalizations of the clustering coefficient to weighted complex networks. Phys Rev E (2007) 75(2):027105. doi:10.1103/physreve.75.027105
Keywords: cross-correlation, commodity network, volatility spillover, connectedness, centrality
Citation: Hou L and Pan Y (2022) Evaluating the connectedness of commodity future markets via the cross-correlation network. Front. Phys. 10:1017009. doi: 10.3389/fphy.2022.1017009
Received: 11 August 2022; Accepted: 24 August 2022;
Published: 15 September 2022.
Edited by:
Jianguo Liu, Shanghai University of Finance and Economics, ChinaReviewed by:
Ou Yang, University of Shanghai for Science and Technology, ChinaYong Luo, University of Shanghai for Science and Technology, China
Copyright © 2022 Hou and Pan. This is an open-access article distributed under the terms of the Creative Commons Attribution License (CC BY). The use, distribution or reproduction in other forums is permitted, provided the original author(s) and the copyright owner(s) are credited and that the original publication in this journal is cited, in accordance with accepted academic practice. No use, distribution or reproduction is permitted which does not comply with these terms.
*Correspondence: Lei Hou, bC5ob3VAbnVpc3QuZWR1LmNu