 Jiaqi Hao
 Zheng Li2
95% of researchers rate our articles as excellent or good
Learn more about the work of our research integrity team to safeguard the quality of each article we publish.
Find out more
ORIGINAL RESEARCH article
Front. Phys., 24 October 2022
Sec. Social Physics
Volume 10 - 2022 | https://doi.org/10.3389/fphy.2022.1016535
This article is part of the Research TopicNetwork Mining and Propagation Dynamics AnalysisView all 17 articles
Many researchers propose link prediction models based on node similarity. Among all models, researchers found that the endpoint influence plays an important role in evaluating the similarity between endpoints. For endpoint influence, we consider that an endpoint possessing a large and extensive maximum connected subgraph can strongly attract other nodes. After thorough research, we found that the coreness can describe the aggregation degree of neighbors and the endpoint degree may be used to describe the largest connected subgraph of an endpoint. In order to create a model, we repeat our experiments on eight real benchmark datasets after combining endpoint degree and weighted coreness. The experimental results illustrate the positive role of synthetical endpoint degree and weighted coreness for measuring endpoint influence in link prediction.
With the application of and dependence on networks, human life gradually becomes virtualization. Through networks, people can carry out social activities, shopping transactions, information retrieval, and so on. Link prediction has emerged as a key technical tool for investigating the properties of complicated networks. Link prediction technology can precisely recommend goods in e-commerce networks [1–3], recommend friends in social networks [4–6], plan routes in transportation networks [7], find the relations between proteins in biological networks [8, 9], mine base station information in power networks, [10] and so on. In addition, link prediction can also reveal the structure growth or formation mechanism of complex networks [11, 12].
For the research studies in link prediction, more researchers consider the topological similarity of networks to build the models. For example, models based on common neighbors, such as CN (common neighbor) [13], AA (Adamic–Adar) [14], and RA (resource allocation) [15], become the first link prediction approaches. These models mainly consider the local structure of the networks, such as the number, node degree or node influence of common neighbors, the influence of target nodes, and the paths between nodes. They show simplicity and effectiveness, but still need to be further classified. The link prediction models based on global information consider the global structure of the networks, involving the impact of different length paths on the node similarity, such as Katz [16], ATC (average commute time) [17], and so on. These models improve the prediction accuracy, but they cannot be applied to large networks due to the high computational complexity. The models based on quasi-local information eliminate the long paths and redundant information, while considering the local information of the networks, reducing the computational complexity and improving the prediction accuracy. These models consider short paths between nodes and initial degree distribution of endpoints, such as LP (local path) [15], LRW (local random walk) [18], and SRW (superposed random walk) [18],, which have been the focus of many researchers.
As of now, link prediction models that take endpoint influence into account mostly concentrate on the role of endpoint degree in gauging endpoint similarities, such as Sørensen [19], LHN [20], LRW [18], and SRW [18]. Since the endpoint degree simply takes into account the number of its neighbors, endpoint influence is not adequately taken into account. This means that while it can characterize the endpoint influence’s breadth, it cannot describe the degree to which neighbors are aggregated. Through consulting literatures, Zhu et al. [21] discussed the role of degree, H-index, or coreness through improving SRW in link prediction. Further research reveals that an endpoint with a high endpoint degree and coreness can have a larger maximal connected subgraph, which attracts more nearby nodes.
Figure 1 shows the roles of endpoint degree and coreness in link prediction. The degree and coreness of endpoint a are 3 and 3, respectively. The influence of endpoint a is described as 3 when we only consider the endpoint degree, leading to a weak attraction of endpoint a. However, the influence of endpoint a should be described as 9 when we exploit the product of degree and coreness, illustrating that endpoint a has a large influence and easily attracts the target endpoint b. As a result, by computing the synthetic degree and coreness of endpoints in link prediction, we may uncover more potential relationships between nodes.
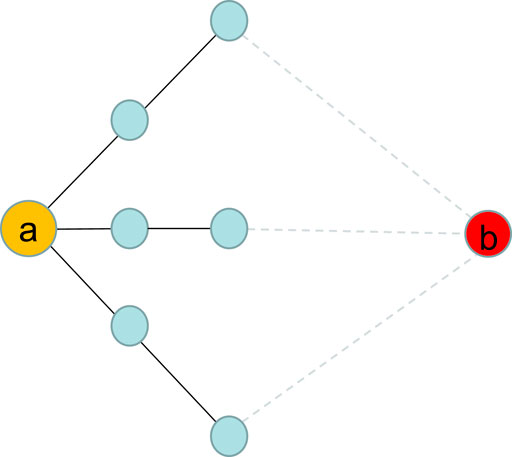
FIGURE 1. (Color online). Diagram of endpoint influence based on degree and coreness. Endpoint (A) represents a source node, which has degree = 3 and coreness = 3. Endpoint (B) represents a target node. All solid and dashed lines indicate existing links and potential links, respectively.
The real world reveals the roles of synthetical degree and coreness on individuals. For example, a celebrity with large and concentrated fans has more influence in one place. The number of fans can be described as the endpoint degree, and the concentration degree of fans represents the coreness of endpoints in the networks. The phenomenon appears on the internet celebrity in online social networks, popular goods in shopping networks, and classic articles in citation networks. Through abundant research studies, we find the endpoint degree plays a fundamental role in each individual. Meanwhile, the coreness describes the different influence intensities on different individuals. Therefore, we consider weighted coreness to apply in different typological networks.
The rest of this article is organized as follows: In section 2, we propose a link prediction model based on the weighted synthetical influence of endpoint degree and coreness (WSIDC). In section 3 and section 4, we show the eight benchmark experiment datasets and methods, including eight mainstream baselines and a metric. The findings of the experiment are covered in Section 5. Section 6 provides the conclusion.
The superposed random walk model (SRW) mainly considers the endpoint degree as the endpoint influence to evaluate the similarity between endpoints. In order to replace endpoint degree with synthetical endpoint degree and weighted coreness to characterize the endpoint influence, we designed a new link prediction model on SRW using the explanation given in section 1. This section will introduce the concept of SRW and building WSIDC. In the undirected simple network G (V, E), where V and E stand for sets of nodes and links, respectively, all models in this study are proven. We removed multiple linkages and self-connections on all network datasets. We constructed a similarity score (sxy) and rank the scores in descending order for each pair of unlinked nodes, x, y ⊂ V, to assess how similar they are to one another. The links with the highest L ratings show that there is a higher likelihood that two disconnected nodes will eventually form a link.
The probability of a node’s influence resource randomly moving from node x to node y in a single step is indicated by the Markov chain equation pxy = axy/kx, where kx denotes the node’s degree. Thus, axy = 1 if node x has connected y and axy = 0 if not. The order of nodes between x and y with a t-step can be expressed as {x = x0 = yt, x1 = yt−1, … , xt−1 = y1, xt = y0 = y}. Accordingly, the t-step transition probability from x to y can be denoted by
where kx and ky represent the degree of node x and y, respectively. |E| represents the number of links in the networks.
Through investigations and analysis, we discover that the hybrid endpoint degree and coreness are sufficient to effectively explain the endpoint effects, and the endpoint degree plays a fundamental role in the hybrid influence of endpoints. Therefore, we first introduce a simple (unweighted) hybrid influence of degree and coreness based on the endpoint model (DCHI) [22] as follows,
where
We developed a link prediction model by enhancing the weighted hybrid impact of degree and coreness (WDCHI) model, where coreness is exponentially suppressed by the inhibitory factor β. The new model can, therefore, be identified as
where
To show the prediction performances of the model proposed, we produce experiments on eight network datasets [23], which are introduced as follows: 1) US Air97 (USAir) [24] represents the US airline network. 2) The electrical power transmission system for western US is represented by Power Grid (Power) [25]. 3) The C. elegans worm’s neural network is represented by metabolic [26]. 4) Network Science (NS) [27] is an example of collaboration among researchers who publish articles on the topic of networks. 5) The email communication network for University Rovira I Virgili (URV) in Tarragona, Spain, is represented by Email [28]. 6) The social media website UC Irvine addresses social network issues (UCsocial) [29] and is created by University of California, Irvine students. 7) The face-to-face interaction network of visitors at the 2009 exhibition “Infectious:Stay Away” at the Science Gallery in Dublin is represented by Infectious (Infec) [30]. 8) Another network of neurons in the C. elegans worm is represented by C. elegans (CE) [26]. Due to the various fundamental topological properties, the metabolic and CE neural networks are two distinct neuronal networks. The main topological characteristics of the aforementioned networks are shown in Table 1.
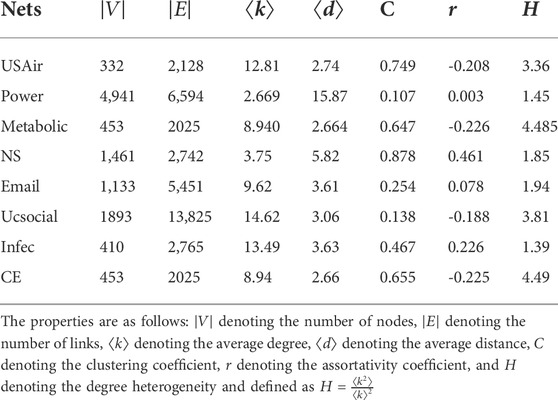
TABLE 1. Twelve benchmark networks’ fundamental topological characteristics.
Each original dataset is randomly split into a training set ET, which contains 90% of the connections, and a testing set EP, which contains 10% of the links, for the experiments. Unsurprisingly, ET ∪ EP = E and ET ∩ EP = ∅. We divide each dataset into 30 separate, independent divisions; check each division for connectedness in ET; and then average the prediction performances.
AUC [30], a metric of accuracy, can be interpreted as the probability that a potential link (a link in EP) ranks a higher score than a nonexistent link (a link in U \ E, where U denotes the universal link set). In the particular implementation, the overall score increases by n′ and 0.5n″ if the prospective connection performs better among n independent comparisons n′ times and equally to the non-existent link n″ times. The average score across n-time comparisons is, therefore, expressed as
A model’s performance is assessed globally by AUC. The value should be equal to 0.5 if each score comes from an independent, identical distribution. The degree to which the accuracy exceeds 0.5 thus indicates how much better a model outperforms random chance.
Comparatively, we introduce the following eight fundamental models as follows:
1. Common neighbors (CN) [13] determines the quantity of common neighbors, which is used to represent how related two endpoints are
where the collection of neighbors of endpoint x is represented by the expression Γ(x), x ∈ {x, y}. The number of neighbors that endpoints x and y has in common is denoted by the symbol
2. The inverse logarithm, which is used by Adamic/Adar (AA) [14], which is based on CN, significantly reduces the contributions of shared neighbors
where kz represents the degree of node z.
3. Similar to AA, by using the reciprocal of the degrees of common neighbors, resource allocation (RA) [15] lowers the high degree of common neighbors, defined as
4. The two-step paths are favored when comparing the similarity of two-step and three-step approaches between endpoints using local path (LP) [15], where the two-step paths are defined as
where the adjacency matrix is represented by A, and the punishment parameter is ɛ.
5. In Section 2, the superposed random walk (SRW) [18] is shown.
6. The degree of influence in SRW is replaced by the coreness in CSRW [21], which also quantifies the impact of the endpoint,
where cx and cy represent the coreness of node x and y, respectively.
7. HSRW [21] replaces the degree influence in SRW with the H-index and measures the influence of the endpoint,
where hx and hy represent the H-index of node x and y, respectively.
8. The degree influence in SRW is replaced by the simple hybrid influence (SHI) [18], which uses degree and H-index as the synthetical influences. The model is denoted by
where
In this part, we demonstrate how well WDCHI predicts outcomes when compared to baselines such as CN, AA, RA, LP, SRW, CSRW, and HSRW. These are the outcomes.
We believe that the synthetical endpoint degree and coreness play a significant role in characterizing the influence of endpoints and improve the link prediction performances, as explained in section 1 and section 2. For verification, we propose a new link prediction model WDCHI by synthesizing the endpoint degree and weighted coreness, with inhibitory factor β to adjust the optimal contributions of coreness in the different networks. Because WDCHI considers the hybrid influence of endpoints on the random walk steps t, we should first obtain the optimal random walks t of DCHI when β = 1 (removing the impact of inhibitory factor β). Figure 2 shows the accuracy metric AUC for the total number of random-walk steps t across eight datasets. DCHI generates the best AUC values in the fewest steps for (a) USAir, (b) power, (c) metabolic, (d) NS, (e) Email, (f) UCsocial, (g) Infec, and (h) CE. Then, using an interval of 0.1, we traverse the inhibitory factor beta from 0 to 1 in the various datasets after setting the inhibitory factor on coreness. We discover that in the majority of datasets, the weighted synthetical influence of endpoints with coreness suppressed exhibits greater prediction accuracy. In Figure 3, we display the AUC’s reliance on the value of β.
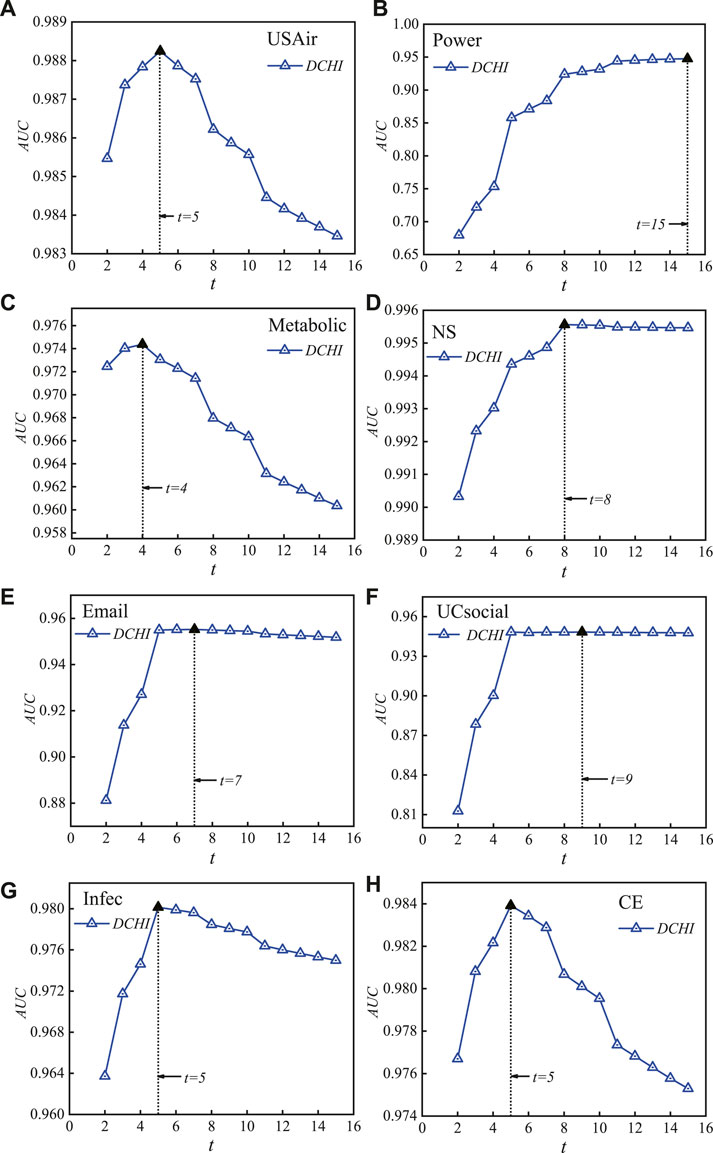
FIGURE 2. (Color Online) Pattern illustration of accuracy metric AUC on the number of random-walk steps t on eight datasets. With the fewest steps, DCHI achieves the most ideal AUC values, which is 5 in (A) USAir, 15 in (B) power, 4 in (C) Metabolic, 8 in (D) NS, 7 in (E) email, 9 in (F) UCsocial, 5 in (G) Infec, and 5 in (H) CE.
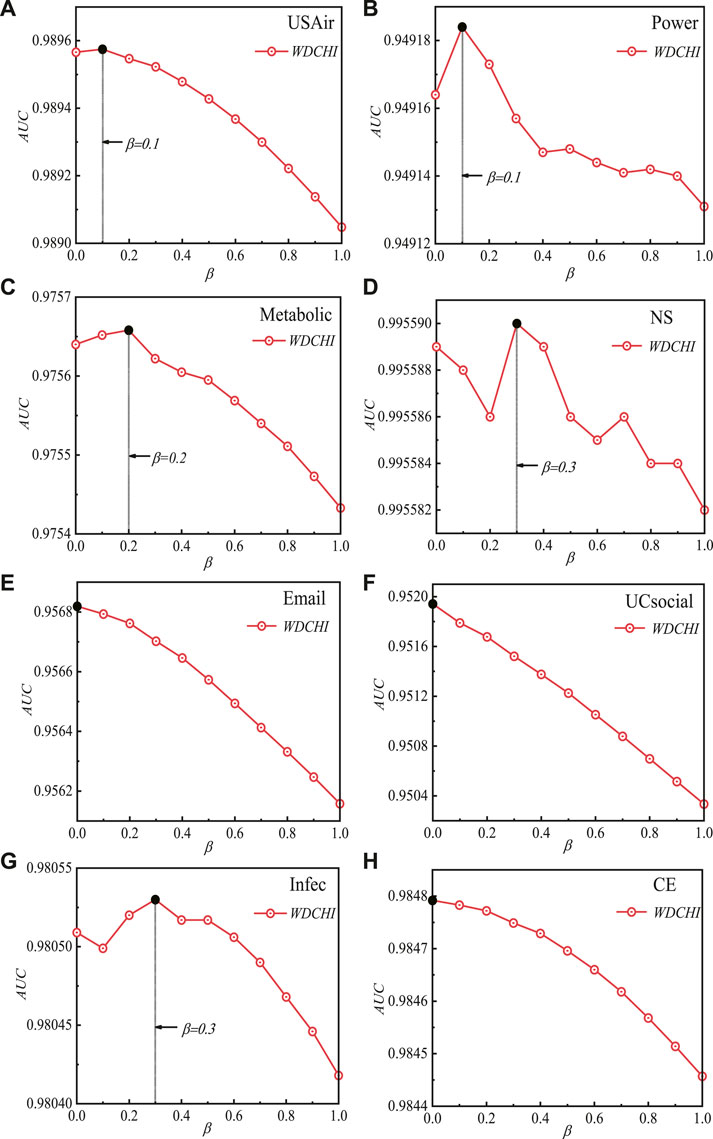
FIGURE 3. (Color Online) AUC’s sensitivity to the levels of the inhibitory factor β with L = 100. In this study, the training and testing sets are divided 30 times in a completely random manner. The average of the 30 runs is the outcome.
Figure 3 displays the optimal AUC values for WDCHI for various inhibitory factors of β ∈ [0, 1) on the ideal number of random-walk steps of t in various datasets, i.e., β = 0.1 in (a) USAir, β = 0.1 in (b) Power, β = 0.2 in (c) Metabolic, β = 0.3 in (d) NS, β = 0 in (e) Email, β = 0 in (f) UCsocial, β = 0.3 in (g) Infec, and β = 0 in (h) CE. However, WDCHI shows the optimal AUC values at β = 0 in email, UcSocial, and CE networks, illustrating the negative roles of coreness in these networks.
We first display the AUC values of WDCHI and DCHI in Table 2 to demonstrate the significance of the weighted coreness, where DCHI stands for the unweighted synthetic influence of endpoints. Table 2 contains the mean outcomes of our 30 separate divisions, each represented by a value. For WDCHI, the values in parenthesis reflect the optimal inhibitory factor beta and the optimal number of random-walk steps t, respectively. The values in parentheses for DCHI represent the optimal number of random-walk steps t. In WDCHI and DCHI, the ideal numbers of random walk steps are equivalent. The fact that WDCHI can achieve higher AUC than DCHI shows that the weighted coreness contributes to link prediction.
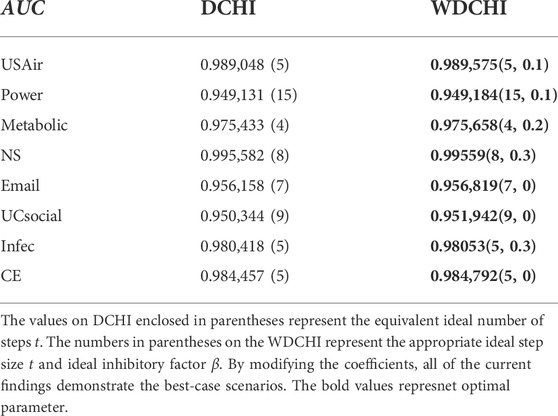
TABLE 2. AUC on the twelve benchmark networks with L = 100 as the line rate. Each data point represents the average of more than 30 independent realization methods, with each point being a random 90%–10% division of the training set and testing set.
The eight link prediction models CN, AA, RA, LP, SRW, CSRW, HSRW, and SHI are then put up against WDCHI in comparison. We display the averaged AUC values for all models across 30 simulations in Table 3 to illustrate the experimental findings. While the underlined bold fonts on WDCHI reflect the best AUC values in each dataset, the numbers in parenthesis on WDCHI show the corresponding optimum number of steps (t) and the ideal inhibitory factor (β). The optimal random-walk steps t are indicated by the numbers in parenthesis. In comparison to other models, WDCHI exhibits optimal values on all datasets, as shown in Table 3. The synthetical endpoint degree and weighted coreness, thus, provide a superior contribution to evaluating endpoint influence, as shown by the results of Figure 3.
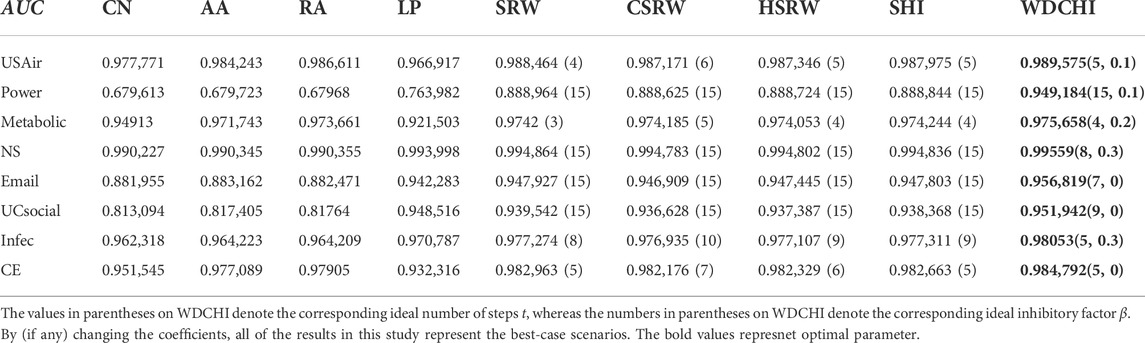
TABLE 3. AUC on the twelve benchmark networks with L = 100 as the line rate. Every data point is a random 90%–10% divide of the training set and testing set, with each point being an average of over 30 independent realization procedures.
In addition, more simplified computation is a critical condition for link prediction. The product’s time complexity of two N × N matrices is O(N3). From the definitions of the baselines, CN, AA, and RA possess the time complexity of O(N3), and LP, SRW, CSRW, HSRW, and SHI have M × O(N3) with coefficient M. Though WDCHI has an identical time complexity as the baselines, WDCHI shows a significant improvement. Most importantly, the proposed scheme achieves satisfactory performance without increasing the complexity.
Traditional link prediction models place more emphasis on the influence of the terminus. More researchers, however, just take degree into account when describing endpoint influence, which is often inappropriate. Through investigations and study, we have discovered that the weighted coreness and synthetical endpoint degree are accurate ways to characterize the influence of the endpoint. Consequently, we suggest a weighted hybrid influence model based on the degree and coreness (WDCHI). On eight real datasets, we compare the prediction results of the WDCHI with those of CN, AA, RA, LP, SRW, CSRW, HSRW, and SHI. As a result, we demonstrate that WDCHI exhibits the same computational complexity and outperforms other models on the metric AUC. The remarkable gain in accuracy demonstrates the weighted coreness and synthetic endpoint degree as endpoint influence can uncover the potential links between two disconnected endpoints and can accurately represent the most linked subgraph. Additionally, our findings can be used to improve social, computer, e-commerce, communication, transportation, and other types of networks.
The datasets presented in this study can be found in online repositories. The names of the repository/repositories and accession number(s) can be found in the article/Supplementary Material.
JH and ZL: conceptualization, methodology, software, and editing the original draft. ZW: validation. JM: reviewing.
ZW was employed by Holley Technology Ltd.
The remaining authors declare that the research was conducted in the absence of any commercial or financial relationships that could be construed as a potential conflict of interest.
All claims expressed in this article are solely those of the authors and do not necessarily represent those of their affiliated organizations, or those of the publisher, the editors, and the reviewers. Any product that may be evaluated in this article, or claim that may be made by its manufacturer, is not guaranteed or endorsed by the publisher.
The Supplementary Material for this article can be found online at: https://www.frontiersin.org/articles/10.3389/fphy.2022.1016535/full#supplementary-material
1. Linyuan L, Medo M, Yeung CH, Zhang Y-C, Zhou T, Zhang Z-K. Recommender systems. Phys Rep (2012) 519(1):1–49. doi:10.1016/j.physrep.2012.02.006,
2. Wang W, Liu Q-H, Liang J, Hu Y, Zhou T. Coevolution spreading in complex networks. Phys Rep (2019) 820:1–51. doi:10.1016/j.physrep.2019.07.001
3. Mahdi J, Sajad A, Maliheh I, Parham M, Salehi M. Evaluating collaborative filtering recommender algorithms: A survey. IEEE Access (2018) 6:74003–24. doi:10.1109/access.2018.2883742
4. Aiello L, Schifanella R, Cattuto C, Markines B. Friendship prediction and homophily in social media. ACM Trans Web (2012) 6(2):1–33. doi:10.1145/2180861.2180866
5. Pan L, Zhou T, Linyuan L, Hu C-K. Predicting missing links and identifying spurious links via likelihood analysis. Sci Rep (2016) 6:22955. doi:10.1038/srep22955
6. Linyuan L, Pan L, Zhou T, Zhang YC, Stanley H. Toward link predictability of complex networks. Proc Natl Acad Sci U S A (2015) 112(8):2325–30. doi:10.1073/pnas.1424644112
7. Leicht EA, Holme P, Newman M. Vertex similarity in networks. Phys Rev E (2006) 73(2):026120. doi:10.1103/physreve.73.026120
8. Angeles Serrano M, Sagues F. Network-based scoring system for genome-scale metabolic reconstructions. Bmc Syst Biol (2011) 5:76. doi:10.1186/1752-0509-5-76
9. Chen X, Wang R, Yang D, Xian J, Li Q. Effects of the awareness-driven individual resource allocation on the epidemic dynamics. Complexity (2020) 2020:1–12. doi:10.1155/2020/8861493
10. Essa FA, Elaziz MA, Elsheikh Ammar H. Prediction of power consumption and water productivity of seawater greenhouse system using random vector functional link network integrated with artificial ecosystem-based optimization. Process Saf Environ Prot (2020) 144:322–9. doi:10.1016/j.psep.2020.07.044
11. Wang W, Zhang Q, Zhou T. Evaluating network models: A likelihood analysis. Europhysics Lett (Epl) (2011) 98(2):28004–9. doi:10.1209/0295-5075/98/28004
12. Zhu B, Xia Y. Link prediction in weighted networks: A weighted mutual information model. PloS one (2016) 11(2):e0148265. doi:10.1371/journal.pone.0148265
13. Newman MEJ. Clustering and preferential attachment in growing networks. Phys Rev E (2001) 64(2):025102. doi:10.1103/physreve.64.025102
14. Adamic LA, Adar E. Friends and neighbors on the web. Social networks (2003) 25(3):211–30. doi:10.1016/s0378-8733(03)00009-1
15. Zhou T, Linyuan L, Zhang Y-C. Predicting missing links via local information. Eur Phys J B (2009) 71(4):623–30. doi:10.1140/epjb/e2009-00335-8
16. Katz L. A new status index derived from sociometric analysis. Psychometrika (1953) 18(1):39–43. doi:10.1007/bf02289026
18. Liu W, Linyuan L. Link prediction based on local random walk. Europhys Lett (2010) 89(5):58007. doi:10.1209/0295-5075/89/58007
19. Sørensen TJ. A method of establishing groups of equal amplitude in plant sociology based on similarity of species content and its application to analyses of the vegetation on Danish commons. Biol Skar (1948) 5:46.
20. Zhu X, Yang Y, Li L, Cai S. Roles of degree, h-index and coreness in link prediction of complex networks. Int J Mod Phys B (2018) 32(16):1850197. doi:10.1142/s0217979218501977
21. Tian Y, Wang Y, Tian H, Cui1 Q. The comprehensive contributions of endpoint degree and coreness in link prediction. Complexity (2021) 2021:1544912–9. doi:10.1155/2021/1544912
22. Batajelj V, Mrvar A. Pajek datasets (2006). Datasets are freely downloaded from the following web sites Available at: http://vlado.fmf.uni.lj.si/pub/networks/data/.
23. Batagelj V, Mrvar A. (1998), Pajek-program for large network analysis. Berlin, Germany: Springer.
24. Watts Duncan J, Strogatz Steven H. Collective dynamics of ‘small-world’networks. Nature (1998) 393:440–2. doi:10.1038/30918
25. Jordi D, Arenas A. Community detection in complex networks using extremal optimization. Phys Rev E (2005) 72:027104. doi:10.1103/physreve.72.027104
26. Holme P, Newman M. Nonequilibrium phase transition in the coevolution of networks and opinions. Phys Rev E (2006) 74(5):056108. doi:10.1103/physreve.74.056108
27. Guimera R, Danon L, Diaz-Guilera A, Giralt F, Arenas A. Self-similar community structure in a network of human interactions. Phys Rev E (2003) 68(6):065103. doi:10.1103/physreve.68.065103
28. Blagus N, Subelj L, Bajec M. Self-similar scaling of density in complex real-world networks. Physica A: Stat Mech its Appl (2012) 391(8):2794–802. doi:10.1016/j.physa.2011.12.055
29. Isella L, Stehle J, Barrat A, Cattuto C, Pinton J-F, Van den Broeck W. What’s in a crowd? Analysis of face-to-face behavioral networks. J Theor Biol (2011) 271(1):166–80. doi:10.1016/j.jtbi.2010.11.033
Keywords: complex network, link prediction, endpoint degree, weighted coreness, synthetical influence of endpoints
Citation: Hao J, Li Z, Wu Z and Ma J (2022) Role of degree and weighted coreness based on endpoints in link prediction. Front. Phys. 10:1016535. doi: 10.3389/fphy.2022.1016535
Received: 11 August 2022; Accepted: 04 October 2022;
Published: 24 October 2022.
Edited by:
Shirui Pan, Monash University, AustraliaReviewed by:
Guanghui Song, Xidian University, ChinaCopyright © 2022 Hao, Li, Wu and Ma. This is an open-access article distributed under the terms of the Creative Commons Attribution License (CC BY). The use, distribution or reproduction in other forums is permitted, provided the original author(s) and the copyright owner(s) are credited and that the original publication in this journal is cited, in accordance with accepted academic practice. No use, distribution or reproduction is permitted which does not comply with these terms.
*Correspondence: Jinming Ma, am1tYUBidXB0LmVkdS5jbg==
Disclaimer: All claims expressed in this article are solely those of the authors and do not necessarily represent those of their affiliated organizations, or those of the publisher, the editors and the reviewers. Any product that may be evaluated in this article or claim that may be made by its manufacturer is not guaranteed or endorsed by the publisher.
Research integrity at Frontiers
Learn more about the work of our research integrity team to safeguard the quality of each article we publish.