 Mario Alcocer-Ávila
 Caterina Monini
94% of researchers rate our articles as excellent or good
Learn more about the work of our research integrity team to safeguard the quality of each article we publish.
Find out more
ORIGINAL RESEARCH article
Front. Phys., 07 November 2022
Sec. Medical Physics and Imaging
Volume 10 - 2022 | https://doi.org/10.3389/fphy.2022.1011063
This article is part of the Research TopicBreakthrough in Particle Therapy: At the Edge of Physics, Biology and MedicineView all 8 articles
Biophysical models are useful tools for predicting the biological effects of ionizing radiation. From a practical point of view, these models can help clinicians to optimize the radiation absorbed dose delivered to patients in particle therapy. The biophysical model NanOx was recently developed to predict cell survival fractions in the context of radiotherapy. The model takes into account the stochastic nature of radiation at different levels and considers as well the accumulation of radio-induced oxidative stress in cells caused by reactive chemical species. We show in this work how the general formalism of NanOx is adapted to hadrontherapy applications. We then use NanOx to compute the cell survival fractions for three cell lines (V79, CHO-K1 and HSG) in response to carbon ions of different energies, and benchmark the predictions against experimental data. The results attest that NanOx provides a good description of both the overkill effect and the evolution of the shoulders of cell survival curves with linear energy transfer.
Hadrontherapy [1, 2] has gained rising interest for tumor treatment due to the physical and radiobiological features of charged particles interactions with biological tissues. On the physical aspect, protons and heavier ions show an inverted depth-dose profile with respect to that of photons, allowing for an increased conformality to the tumor volume and a better sparing of the surrounding healthy tissues. The enhanced efficacy of these ions for killing tumor cells is usually quantified through the relative biological effectiveness (RBE) [3]:
where Dr and Dion are the absorbed doses for reference photon radiation and ions, respectively, producing the same biological effect. In the clinical setting, a constant RBE of 1.1 is usually assumed for proton beams. On the other hand, the RBE for carbon ion beams may vary approximately from 1 to 10 [3]. The accurate determination of the RBE is crucial for the correct absorbed dose prescription in particle therapy. However, the RBE depends on several physical parameters (e.g., radiation quality, absorbed dose and absorbed dose rate), as well as on biological factors such as the cell line, the cell cycle phase and the cell environment. For this reason, estimating the RBE is a difficult task requiring either empirical approaches, e.g. cell survival experiments [4], or theoretical calculations by means of biophysical models.
Cell survival probability is a radiobiological endpoint commonly used for calculating the RBE [3]. Traditionally, experimental measurements of cell survival fractions at different absorbed dose values are fitted by a linear-quadratic (LQ) expression [5]:
where S is the cell survival fraction, D is the absorbed dose, and α, β are coefficients describing the cell’s radiosensitivity. While Eq. 2 is a useful tool to reproduce cell survival curves, much more detailed mechanistic models have been developed in the last decades.
Two biophysical models are currently implemented in the treatment planning systems (TPS) of hadrontherapy facilities using carbon ion beams: the first version of the local effect model (LEM) [6, 7], used for instance at the Heidelberg Ion Beam Therapy Center (HIT) in Germany and at the National Center of Oncological Hadrontherapy (CNAO) in Italy; and the modified microdosimetric kinetic model (mMKM) [8, 9], utilized at the National Institute of Radiological Sciences (Japan). However, the choice of the appropriate biophysical model is still a matter of debate [3]. Furthermore, it has been pointed out that both the LEM and the mMKM present some limitations [10–13].
In this context, our group has developed the NANodosimetry and OXidative stress (NanOx) biophysical model, a theoretical framework that combines some of the ideas previously proposed in the literature with new insights providing a sound mathematical approach to cell survival modeling while, at the same time, solving the shortcomings of existing models. NanOx is able to predict the cell survival to photon and ion irradiations taking into account the stochastic nature of energy deposits induced by ionizing radiation at the micrometric and nanometric scales. It considers both the physical and chemical processes relevant for describing the radio-induced biological effects. Since the general formalism of NanOx has been recently detailed in [14], we provide here only a brief overview of the model.
In NanOx, the cell survival fraction for a macroscopic absorbed dose D is computed as the average over all irradiation configurations delivering the absorbed dose D. Each configuration consists of a stochastic number K of radiation impacts. In the context of hadrontherapy, a radiation impact corresponds to the set of all the interactions of the primary ion and its secondary particles with the medium. The radiation effects are evaluated in “sensitive volumes”, i.e., critical regions inside the cell where energy transfers induced by radiation may trigger cell death mechanisms. As it will be justified later, a single sentitive volume is considered for calculations in hadrontherapy.
One of the main postulates of the NanOx model is that cell survival depends on two classes of biological events occurring at different spatial scales: the “local” and “non-local” lethal events. Since both types of events are considered as independent, the total cell survival probability is computed as:
where
A local lethal event (LLE) takes place at the nanometric scale and is able to induce cell death on its own. It may correspond for instance to irreparable DNA damage. The modeling of LLE in NanOx is based on the inactivation of a single local target among N identical local targets distributed uniformly in the sensitive volume. Currently, local targets are modeled in NanOx as cylinders with diameter dt = 20 nm and length Lt = 10 nm. These dimensions correspond roughly to the extension of a DNA double-strand break (DSB), taking the diffusion of reactive chemical species into account [13]. In general, the inactivation of the local target is assumed to depend on a single quantity x described by a probability function f(x). In the current implementation of NanOx, x is equal to the restricted specific energy z. The latter is defined as the ratio of the energy imparted by one or more events in a target, to the mass of that target, but considering only the energy transfers that may lead to events relevant for radio-induced biological effects (e.g., ionizations, excitations and attachments of electrons) [14]. For practical reasons, NanOx calculations are based on the effective number of local lethal events (ENLLE), defined as:
where ci and ck denote the configuration of the local target i and that of the radiation impact k, respectively;
where we have considered the average over the configurations of N local targets. The cell survival fraction to LLE can be expressed as well in terms of an effective local lethal function (ELLF), F(z), which represents the probability that a local target is inactivated in the sequence of an irradiation depositing the restricted specific energy z in the target:
with:
Moreover, it has been shown [15] that the ELLF is close to an error function and characterizes the response of each cell line by means of three free parameters (h, z0, σ) determined through a fit to experimental values of the radiobiological linear parameter α:
with h the height of the response, z0 the restricted specific energy threshold, and σ the extent of the increase.
On the other hand, non-local lethal events (NLLE) may be associated to physico-chemical mechanisms taking place at the micrometric scale, and that may cause cell death by an effect of accumulation or through the interaction of sublethal lesions. In the current NanOx implementation, however, we consider only a subset of NLLE, to which we refer as “global” events, namely the accumulation of reactive chemical species leading to a state of oxidative stress. The computation of the cell survival to global events is based on the notion of chemical specific energy,
where
All these quantities are obtained from Monte Carlo (MC) simulations performed with the LQD/PHYCHEML/CHEM codes [16]. The cell survival fraction to global events for a configuration cK of radiation impacts is then given by:
where the coefficients αG and βG are determined for each cell line from cell survival curves for reference radiation. As explained in [14], for the sake of simplicity we currently set αG = 0 Gy−1, which allows for an independent adjustment of the local and the global events.
The purpose of the present paper is to adapt the general formalism of NanOx to the context of hadrontherapy, with the aim of producing tables with the α and β coefficients for a set of cell lines of interest irradiated by monoenergetic ion beams. These tables constitute the input data required for TPS in order to estimate cell survival fractions to mixed radiation fields in particle therapy facilities, according to the following equations [17, 18]:
where αmix, βmix are the coefficients characterizing the mixed radiation field, and fi is the fraction in absorbed dose of the ith monoenergetic beam.
In the context of hadrontherapy it is possible to introduce some approximations and simplifications in NanOx thanks to two distinctive features of high-energy ions’ tracks. First, at sufficiently high velocity the ion’s trajectory may be considered as rectilinear and variations in the ion’s energy may be neglected. Second, the presence in ion tracks of a region characterized by a high density of energy-transfer points (the core), and a more “diluted” region, called penumbra.
This paper is structured as follows. Section 2 presents the specific assumptions and simplifications underpinning the hadrontherapy implementation of NanOx. Section 3 contains some results allowing to illustrate the modeling of biological events in NanOx. Then, we present the cell survival fractions, computed with the hadrontherapy version of NanOx, for three cells lines (V79, CHO-K1 and HSG) irradiated with monoenergetic carbon ion beams. Section 4 discusses the findings of this study and the current limitations of the NanOx model. Finally, conclusions are drawn in Section 5.
In this section, we introduce the necessary approximations for adapting the general NanOx formalism to hadrontherapy applications, while at the same time we introduce some simplifications to speed up calculations.
The general formalism of the NanOx model [14] takes into consideration the role that different subcellular structures may have on cell death by defining several sensitive volumes. The latter approach is particularly necessary for some developing radiotherapy techniques such as boron neutron capture therapy (BNCT) and targeted radionuclide therapy (TRT) with α-particle emitters, which involve irradiation with low-energy, short-range ions that may deposit a significant amount of energy outside the cell nucleus, usually regarded as the main target for radio-induced damage. However, the high energy of ion beams used in hadrontherapy justifies the assumption that radiation will traverse the whole cell, including in most cases the cell nucleus. Thus, cell survival predictions in hadrontherapy may be based on the hypothesis of a single sensitive volume, i.e., the cell nucleus. This allows us to introduce the following simplifications.
Simplification 1. (Sensitive volumes associated with local and non-local lethal events) The sensitive volumes associated with local and non-local lethal events are combined into the same sensitive volume, denoted as Vs.
Simplification 2. (Sensitive volume set as the cell nucleus) The sensitive volume Vs is limited to the cell nucleus. It is modeled by a cylinder with length Ls and diameter ds, oriented along the direction of the incident radiation.It follows from Simplification 2 that lethal events that may eventually occur due to energy deposits in other cell organelles or the extracellular medium are not presently described in this implementation of NanOx. However, as the parameters of the model are fitted so that the predictions match experimental data, such events are likely implicitly included.Furthermore, given the high energy of the ions and the small thickness of the cell nucleus, it is possible to adopt “track-segment” conditions for all our calculations in hadrontherapy. The latter implies that the speed of the ions is considered as constant, both in norm and direction, and that the energy loss of the ions along their traversal through the sensitive volume is neglected. This leads to the following working hypothesis.
Hypothesis 1. (Track-segment irradiation conditions are satisfied) A given radiation is associated with a type and an energy considered as constant along the traversal of the sensitive volume. This pair (type, energy) of radiation impact k is denoted tk.
As explained in [14], within the validity of the track-segment approximation an ion track may be decomposed into two regions in which the energy deposition patterns are totally distinct, namely the core and the penumbra. The former region is characterized by a high concentration of energy-transfer points around the ion’s path, while the penumbra consists of sparser energy depositions produced by fast δ electrons. The main interest in treating these two regions differently is to describe the physical and chemical events in the penumbra volume in the same way as those induced by low-LET reference radiation. Here we show how the definition of the core and penumbra volumes is exploited for simplifying NanOx calculations in hadrontherapy.
We define the core volume
Simplification 3. (Constant core volume in the sensitive volume)When the ion crosses the sensitive volume, the core volume is considered constant. Hence, we have:
where ec is the edge of the square cross section of the core volume and Ls the sensitive volume length.Figure 1 illustrates two possible situations in which the core region hits the sensitive volume, or only the track penumbra is partially inside the sensitive volume. The restricted specific energy
where rc and rp represent, respectively, the ratio between the core and the penumbra volumes to the sensitive volume:
and:
with ρW standing for the water density.
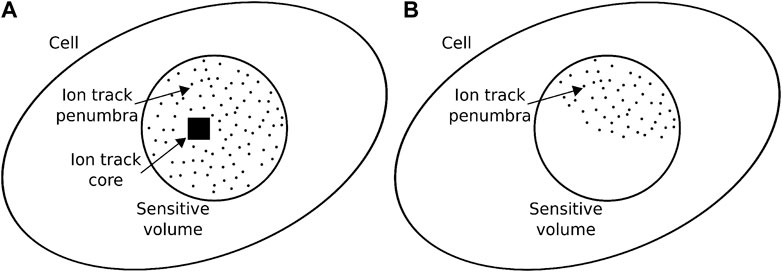
FIGURE 1. Two examples of intersection of the ion track with the cell’s sensitive volume. The ion may hit directly the sensitive volume (A), in which case the core volume is inside the sensitive volume and thus
Let us denote by
The use of NanOx’s Hypothesis 1, together with Simplification 3 lead us to:
Approximation 1. (Definition of α coefficients for a given ion type and energy). The fluctuations in the
Where
This approximation requires that the number of ionizations for a configuration ck is large enough. This number may be estimated from:
where ⟨ɛ⟩ is the mean ionization energy (of the order of 20 eV), and an order of magnitude of Ls (the sensitive volume length) is 10 μm.
For a high-LET ion such as a carbon ion of 300 keV/μm,
For low-LET ions such as a proton of 100 MeV (LET ≈0.74 keV/μm), the total number of ionizations per track is much smaller
where D is the absorbed dose, σs the geometrical cross section of the sensitive volume and a a coefficient for unit conversion.
The mean absorbed dose associated to a single ionization, d1, is then:
For D = 1 Gy, the number of ionizations will be on average:
To summarize, Eq. 20 is valid for high-LET ions and adequate to estimate
Paradoxically, the approximation is even more relevant in the case of low-LET ions, even if the dose is low. Indeed for such ions,
Approximation 2. (Coefficient
On a first-order approximation, volumes irradiated by photons or by the penumbra of an ion track present very similar energy spectra in nanometric targets, since in both cases the deposited energy comes from δ electrons [19] (see Section 3.1). For computing simplifications, thus, the differences between the secondary electron spectra observed in a typical track penumbra and in a volume irradiated by X-rays [20] are neglected. The last piece of the puzzle in order to estimate the average ENLLE is the calculation of the coefficient αc. From Eqs 18, 20 one may derive:
with the new index ti representing the response of a single target.
However, since local targets are numerous and homogeneusly distributed, it is possible to express the same formula exclusively in terms of observables defined at nanometric scale:
where
When track-segment conditions are satisfied, it is possible to consider separately the concentration of reactive chemical species, Y, in the core and penumbra of ion tracks. In addition, let us remind that within the NanOx formalism we take into account the amount of radicals at an early time. This choice allows to consider the tracks as independent [14]. Thus, we have:
However, since Eq. 28 is still very demanding in terms of computer calculations, we develop two more approximations. The first one results from considering the case of particles traversing the sensitive volume with constant type and energy (Hypothesis 1).
Approximation 3. (Chemical yield in the track-segment approximation). The fluctuations of the chemical yield may be considered negligible from a configuration ck to another; this observable is therefore computed as the average over a large number of particles of the same type and energy tk:
The second approximation relies on an intrinsic property of the penumbra of an ion track, i.e., the fact that the density of physico-chemical events in this region is comparable to that of the reference radiation. As we approximated the proportionality coefficient in the penumbra,
Approximation 4. (Chemical yield in the penumbra). The chemical yield in the penumbra volume
Due to Approximation 3, the chemical specific energy (Eq. 9) may be expressed as follows:
It is worth mentioning that within the scope of this paper (and the current version of the NanOx model), primary hydroxyl radicals (•OH) produced by water radiolysis at a time TRCE = 10–11 s elapsed after each radiation impact are chosen to represent the reactive chemical species. The reason is that •OH radicals are among the most effective reactive chemical species in causing cell damage [21]. Moreover, it has been shown [22] that the influence of TRCE on NanOx predictions is limited.
Within the track-segment approximation, the cell survival fraction S(D) after an irradiation of monoenegetic ions of the same type corresponds to the average cell survival over all the possible configurations which may be obtained with a macroscopic absorbed dose D:
In Eq. 32, P(K, D) represents the probability that K radiation impacts are located inside the volume of influence for an absorbed dose D. The volume of influence is defined as the volume around the sensitive volume large enough to encompass all the radiation impacts for which the respective set of interactions with the medium has a non-negligible probability of leading to energy transfer into the sensitive volume. P(cK) denotes the probability associated to the configuration of impacts cK. Since the beam is assumed to be parallel to the axis representing the cell nucleus, the volume of influence is simply described in terms of a surface of influence perpendicularly crossing the beam. In order to implement such an average in our simulations, we consider 1 cell and define the irradiation configurations as a function of the number of particle impacts inside the sensitive volume, Kin, and the number of particles outside the sensitive volume (but still inside the volume of influence), Kout. These two quantities depend on the surface of influence Σ, on the geometrical cross section σs of the sensitive volume, and on the absorbed dose D. By definiton, we have:
The probability of occurrence of a given pair (Kin, Kout) is expressed as follows:
with:
In the previous equation, a is a unit conversion factor equal to 0.1602 Gy ⋅keV−1 ⋅μm3, with the absorbed dose D in Gy, the LET in keVμm−1, and the areas Σ and σs in μm2. S(D) then reads:
To focus on the last factor we introduce the sum on the configurations with Kin and Kout impacts:
and propose an alternative mathematical formulation via the introduction of three Dirac delta functions:
where:
Defining:
Eq. 38 reads:
The implementation of the NanOx model for hadrontherapy, as described in the previous sections, is illustrated in Figure 2. Let us emphasize that NanOx predictions of the biological effect of ions for a wide LET range may be based on only five parameters characterizing a given cell line [22], namely: ds, the average diameter of the cell nucleus, which fixes the geometry of the sensitive volume; βG, which is derived from the β coefficient measured for a beam of photons and is used to describe the cell survival to global events; and the three parameters (h, z0, σ) of the ELLF, obtained from an optimization procedure based on at least three experimental α values (corresponding to an irradiation with photons and carbon ions of intermediate- and high-LET). This optimization procedure consists in finding the parameter values that minimize the χ2 between representative αc, rep values (derived from the experimental α dataset) and the ones computed with Eq. 26 [15]. More details about this procedure are provided in Section 3.3.
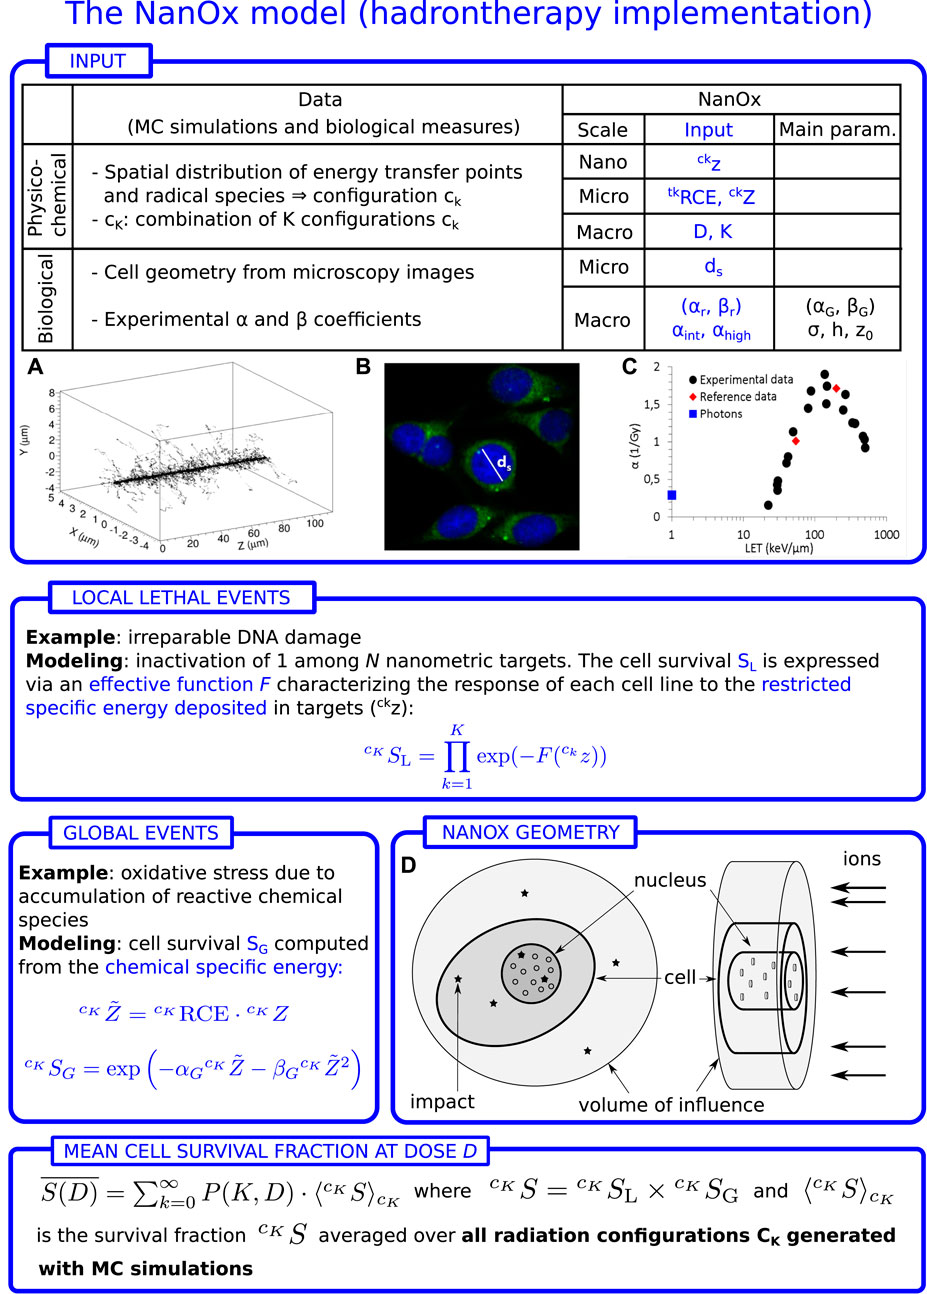
FIGURE 2. Workflow of the NanOx model for hadrontherapy. z and Z are the restricted specific energies in the local targets and in the sensitive volume, respectively. D: macroscopic absorbed dose; K: number of impacts in the volume of influence (volume large enough that the impact of a particle outside this volume leads to a negligible energy transfer into the sensitive volume); ds: average diameter of the cell nucleus; αr, βr: linear-quadratic (LQ) coefficients for reference radiation; αint, αhigh: linear coefficient for intermediate- and high-LET radiation, respectively; F(z): effective local lethal function (ELLF); σ, h, z0: parameters of the ELLF;
All other model parameters, such as the time at which the chemical yields are considered, can be fixed to some standard values without altering the results in a significant way.
In this section, we look at some results illustrating the modeling of local and global lethal events in NanOx (Section 3.1 and Section 3.2). We present afterwards the NanOx predictions for the α coefficients and survival curves of selected cell lines (Section 3.3 and Section 3.4).
As explained throughout this paper, the distributions of restricted specific energy at the micrometric and nanometric scales are a fundamental input for the NanOx model, since they are used for estimating both the local and global lethal events. Here, we examine such restricted specific energy distributions distinguishing the contributions of the core and penumbra volumes of an ion track, as defined in Section 2.1.2.
Figure 3 shows
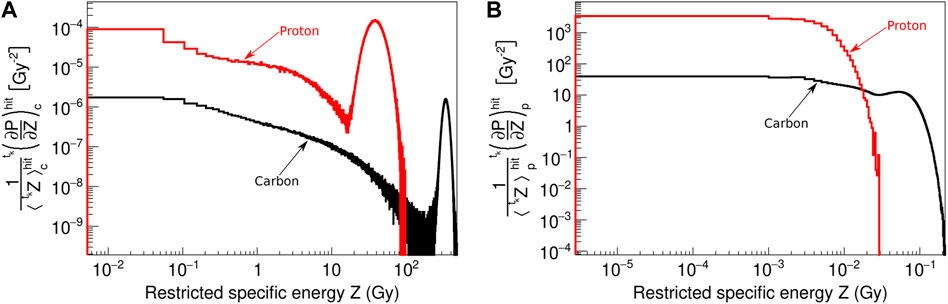
FIGURE 3. Normalized probability distributions of
Figure 4 shows the probability distributions of the restricted specific energy in local targets,
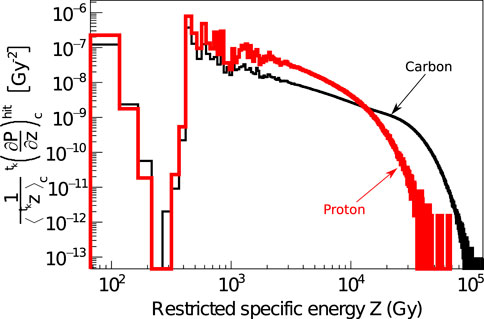
FIGURE 4. Probability distributions of specific energies simulated with LQD in the hit nanometric targets after a single particle impact ck of 2.6 MeV protons (red curve) and 12 MeV/u carbon ions (black curve). The nanometric targets, defined as cylinders with 10 nm radius and length, are simulated only in the ion core volume.
Furthermore, Figure 5 shows the probability distributions of
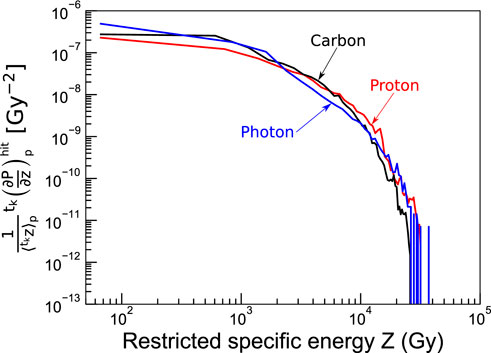
FIGURE 5. Probability distributions of specific energies simulated with LQD for nanometric targets in the penumbra after a single particle impact ck of 100 MeV protons (red curve) and 100 MeV/u carbon ions (black curve). The probability distribution for reference photon irradiation is plotted for comparison (blue curve). The nanometric targets were modeled as cylinders with 10 nm radius and length.
The chemical yields of reactive chemical species are important for estimating the cell survival to global events. It is therefore interesting to examine the time evolution of the total chemical yields, as well as their contribution in the core and penumbra volumes of ion tracks. As an example, we have simulated with the LQD/PHYCHEML/CHEM MC codes [16] the chemical yields of the •OH radical for an irradiation with carbon ions of 35 MeV/u. The results are shown in Figure 6. It can be observed that the chemical yields are similar in the various regions up to approximately 10–10 s, after which part of the radicals in the core volume have drifted and reached the penumbra.
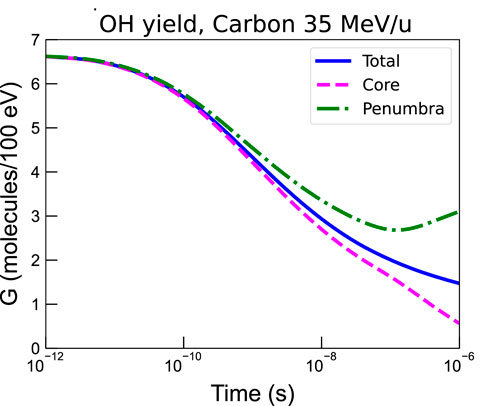
FIGURE 6. •OH radical yield in the whole track volume
While the current NanOx implementation only considers the chemical yield of primary •OH radicals at a fixed time of 10–11 s, future investigations may explore the effect of considering the chemical yields at a later time and for other reactive chemical species.
To provide an example of the NanOx capacity to model local lethal events, we computed the linear parameter α for one illustrative cell line: normal lung fibroblast (V79) cells from a Chinese hamster, irradiated with hydrogen, helium, carbon, neon and argon ions of various energies. The calculation was performed by tuning the ELLF, F(z) (see Eq. 8), on the basis of a representative dataset consisting of 15 experimental α values via the Migrad minimization algorithm [24] implemented in ROOT [25]. The representative dataset included the following radiations: photons, protons (2.6 and 7.7 MeV), helium ions (2.9 and 9.2 MeV/u), carbon ions (12, 28.4, 67.6 and 190 MeV/u), neon ions (23, 47.8 and 105 MeV/u), and argon ions (17.3, 46.5 and 170 MeV/u). As mentioned in Section 2.3, the tuning of the ELLF consists in obtaining the set of parameters h, z0, σ that minimize the χ2, computed as:
where Nα is the number of α values in the representative dataset; the
The second step consists in using the mean cell survival probability S1 to a single particle impact as defined in the formalism of NanOx:
where
Once the ELLF was tuned, it was used to compute the α values for the ions and energies of interest by means of a similar iterative procedure.
The results for the chosen ions are plotted in Figure 7 as a function of LET. It can be observed that the effectiveness of ions is reproduced over a wide range of LET values (from approximately 0.3–3,000 keV/μm). This is particularly remarkable for carbon, neon, and argon ions, for which the overkill effect is well described by the decrease of α coefficients beyond a given LET value. It is worth mentioning that NanOx predictions in terms of the radiobiological linear coefficient α are shown here mainly for illustrative purposes, since a detailed benchmark of these results against experiments as well as against other biophysical models was reported in a previous publication [26]. It that work it was observed that NanOx predictions for the three cell lines (HSG, V79 and CHO-K1) irradiated by monoenergetic ions were more often more accurate than the ones obtained with 5 other biophysical models (MKM and the four versions of the LEM). The latter conclusion was made based on the smallest values of a χ2 estimator.
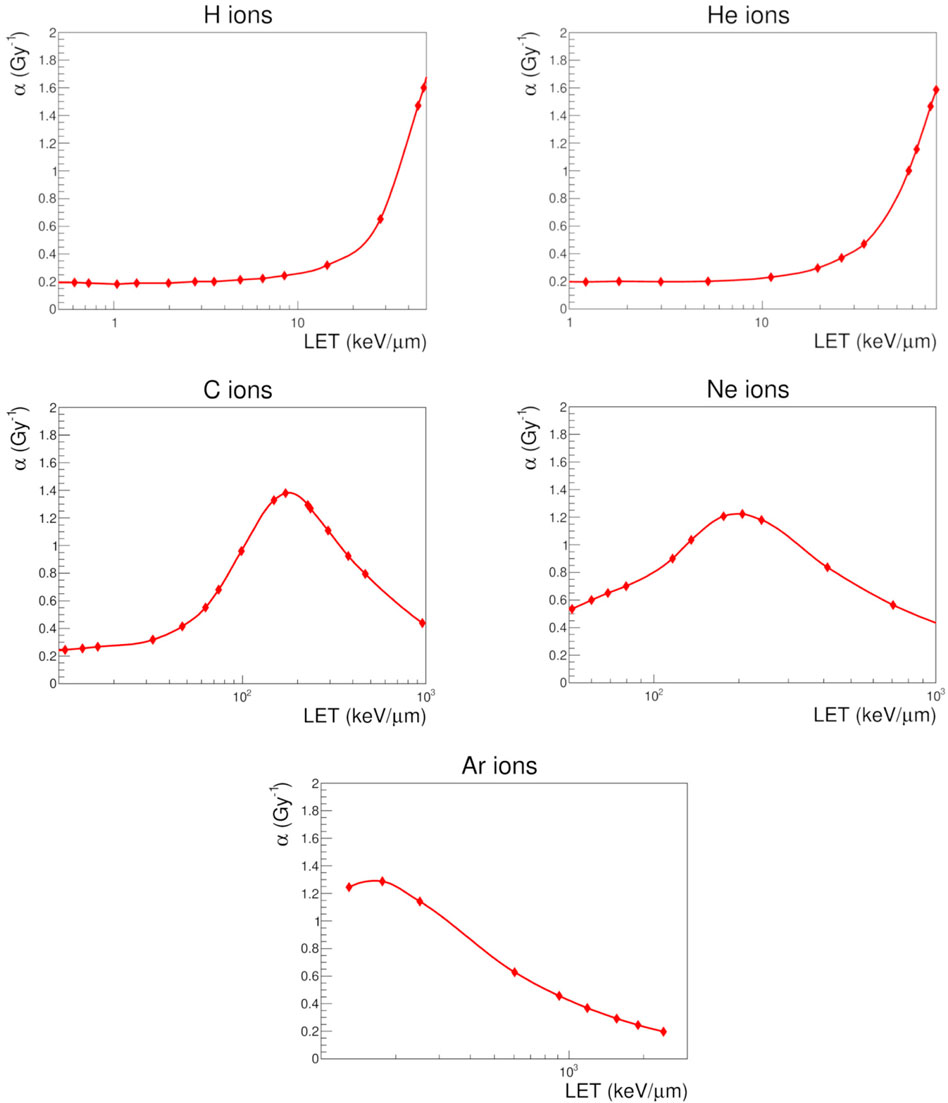
FIGURE 7. Linear parameter α obtained with NanOx (filled symbols) for V79 cells in response to hydrogen, helium, carbon, neon and argon ions in the experimentally-accessible LET range. The solid curves that connect the calculated values are for visualization purposes only.
As an example of application of the NanOx model in the context of hadrontherapy, we considered NanOx predictions for the radiation response of three cell lines to carbon ion beams of different energies. The chosen cell lines were: normal lung fibroblast (V79) and ovary (CHO-K1) cells from a Chinese hamster; and human tumor salivary gland (HSG) cells. The standard set of parameters chosen to model each cell line in NanOx are listed in Table 1. Let us recall that the sensitive volume in NanOx is currently modeled as a cylinder. The values of the cell nucleus radius were set based on experimental data found in the literature. Furthermore, the sensitive volume length was set to 1 μm. Given the scarcity of experimental data, we considered that the latter represents the lowest reasonable value that can mimic the thickness of the nuclei of flattened cells [22]. These dimensions are meant to provide a correct order of magnitude for NanOx calculations, which should be accurate enough for hadrontherapy applications. The impact on NanOx predictions of varying the set of standard parameters, including the sensitive volume dimensions was previously investigated by our team [22].
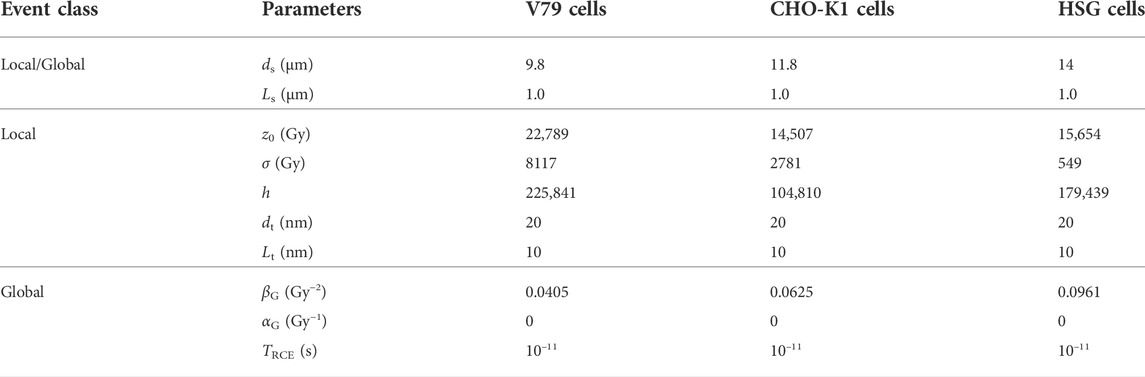
TABLE 1. Values of the parameters used to model the cell lines V79, CHO-K1 and HSG with NanOx. ds and Ls represent the sensitive volume diameter and length, respectively. Similarly, dt and Lt are the local targets’ diameter and length, respectively. TRCE is the time at which the concentration of •OH radicals is considered.
Combining the modeling of local lethal and global events, cell survival fractions were computed for the three cell lines. The results are presented in Figure 8, in which we compare experimental data (symbols) with NanOx predictions (lines). Precisely, we calculated survival fractions for 5–10 doses, which are represented by a LQ fit for the sake of readability. The decision of benchmarking NanOx predictions with experimental data of carbon ion irradiations was motivated not only for the clinical relevance of this ion, but also because of the availability of cell survival curves in the literature. Note that the cell survival curves plotted in Figure 8 correspond to predictions for LET values different than those in the experimental dataset used to tune the effective local lethal function of the NanOx model.
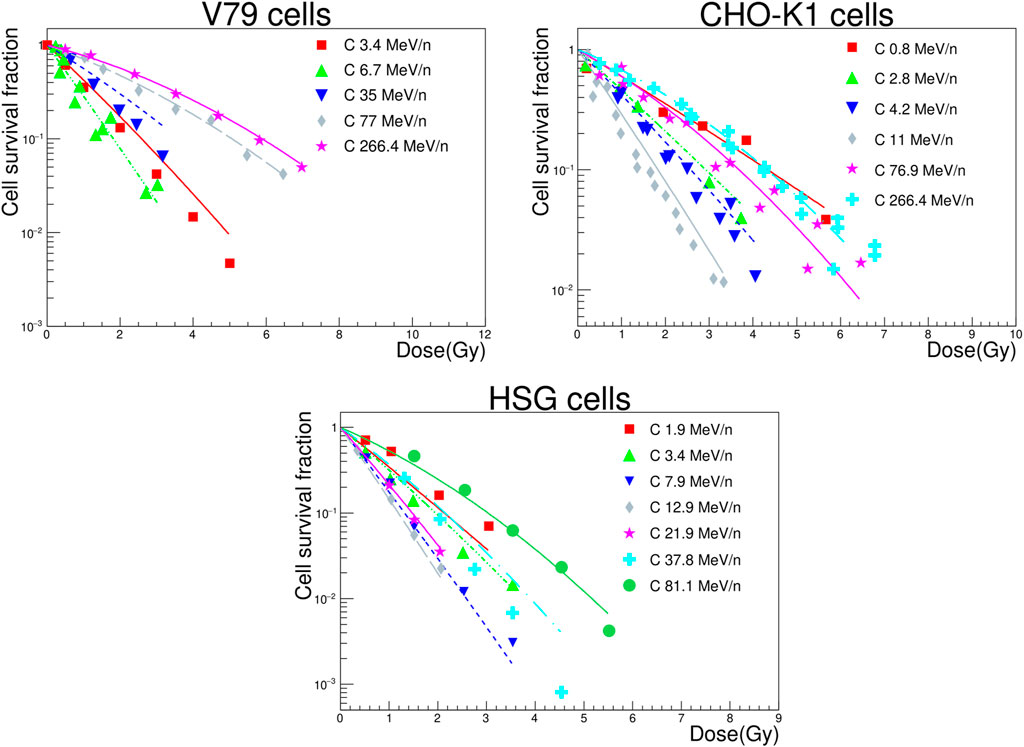
FIGURE 8. Survival curves for V79, CHO-K1 and HSG cells irradiated by carbon ions of various energies. The NanOx model predictions are represented by the solid and dashed lines. The experimental measurements taken from the PIDE project database [37] (filled symbols) are shown for comparison.
Unfortunately, error bars are rarely reported in cell survival experiments, which makes it impossible to evaluate the agreement between the NanOx model predictions and experiments through a statistical test. Thus, we quantified the agreement by means of the following estimator:
where N is the number of experimental points in each survival curve;
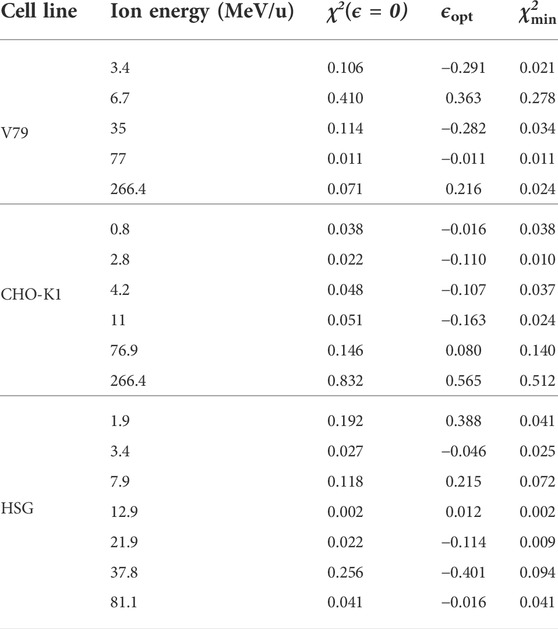
TABLE 2. Values of the χ2 estimator defined in Equation (45) for all cell lines and ion energies considered in this work. The minimum
In order to exploit the therapeutic advantage of ion beams over conventional photon radiotherapy, appropriate frameworks able to account for the complex dependencies of the RBE are needed, particularly for treatments with ions heavier than protons. In this context, many biophysical models have been proposed to relate physical quantities with biological endpoints [27]. In particular, the NanOx biophysical model was introduced some years ago with the purpose of addressing the shortcomings of the two most widely used biophysical models, the mMKM and the LEM [10–13].
Among the innovative aspects of the NanOx model we can mention, for instance, the integration of stochastic effects of ionizing radiation down to the nanometric scale, as well as the inclusion of chemical yields to account for the role of oxidative stress accumulation on cell survival. The direct outcome of the NanOx model is the cell survival fraction for a given configuration cK (with K ion impacts in the volume of influence). Then, mean cell survival fractions over all configurations covered by the experimental conditions can be computed in order to compare the predictions with experimental data. For instance, it is possible to calculate cell survival curves as a function of the dose and derive α and β coefficients (with LQ fits) that can be implemented in any treatment planning system. As a matter a fact, α and β tables calculated with the NanOx model have been implemented in the GATE Monte Carlo simulation software [28] to compute biological dose distributions in spread-out Bragg peaks for pre-clinical and clinical beams [29].
The NanOx model was first presented in 2017 in a concise manner [13]. Although the optimization of the lethal function was described in [15], no detailed description of the formalism has been published yet. Therefore we proposed in this special issue two papers: the first paper gave the general formalism [14], which in principle can be applied to any radiotherapy technique; the present one provided the specific approximations required for an implementation in hadrontherapy.
The efficient implementation of the NanOx model in hadrontherapy is based on three major simplifications/approximations: first, we considered that the sensitive volumes of the cell are restricted to one volume: the cell nucleus. Second, the ion velocity is high enough to consider it as constant during the cell traversal. This can be justified for clinical hadrontherapy beams since the biological dose distributions can be essentially assigned to ions fulfilling this velocity condition. This approximation allowed us to simplify the geometry of the cell nucleus (cylinder) and to assign to each ion type (T) of a given energy (E) well-defined features such as chemical yields, and the coefficients α and β. Third, we separated the ions tracks into two components, the core and penumbra. Then, we assumed that the biological effect of the penumbra is similar to a reference low-LET irradiation. This can be justified by the fact that the penumbra consists of fast electrons, i.e., low-LET particles.
The objective of the present paper is not to compare the NanOx model predictions with the ones of other models such as the LEM and the MKM, since that work has been extensively performed and reported in a recent study for 3 cell lines (V79, CHO-K1 and HSG) irradiated with monoenergetic carbon ion beams [26]. Moreover, it was shown in that study that the NanOx model predictions were more often more accurate than the ones issued from the four versions of the LEM and the MKM. Nevertheless, we performed in the present study some comparisons between the NanOx model predictions and the experimental data of cell survival found in the literature. Overall, we found a qualitative good agreement. NanOx reproduces well two critical features of irradiations, namely the overkill effect in the high-LET region, and the appearance of a shoulder in the cell survival curves for low-LET, low-dose irradiations. It can be observed from Figure 8 that, in general, the cell survival curves for low-energy (high-LET) carbon ions show a more linear behavior, while the shouldering of curves becomes clearer for high-energy (low-LET) carbon ions and low doses. Overall, the evolution of the survival curves shoulder for high-energy carbon ions is well predicted, owing to the introduction of the chemical specific energy and the modeling of the stochastic effects at the microscopic scale. Also, the effectiveness of low-energy carbon ions is globally well modeled, attesting that the overkill phenomenon is accurately represented. This is line with the conclusions of the thorough study of the α coefficient as a function of the LET [26].
A more comprehensive assessment of the agreement through statistical techniques would be feasible if the experimental uncertainties were available. However, we proposed an estimator of the systematic deviation (defined as a relative deviation ϵ) between the experimental and predicted values. This systematic deviation includes both the limitations of the model and the imperfections of the measurements. The estimator was calculated for 18 cell survival curves and 78% of the values were found within ±30%. This is consistent with the variability that can be observed when gathering values of α as a function of the LET [26]. Therefore, we can hardly conclude on the limitations of the model at this stage.
In the context of hadrontherapy, a perspective of the model consists in determining the NanOx parameters for other relevant cell lines in cancer research and testing the accuracy of the predictions. Moreover, the NanOx parameters could also be estimated from clinical data through the calculation of tumor control probability (TCP). Indeed, the methodology to predict TCP in hadrontherapy has been proposed in [30]. Another perspective concerns the treatment of hypoxic tumors. In this context, it may be relevant to consider for the chemical specific energy other chemical species than the hydroxyl radical. In particular, it has been shown that the yields of
BNCT and TRT with α-particle emitters can be other applications of the NanOx model. As the ranges of the ions involved in these therapies are at most of the order of a few cells, an accurate and more realistic modeling of the sensitive volume geometry might be required. Besides, we can question the limitation of the sensitive volume to the cell nucleus in this context. Moreover, the track-segment approximation is no longer valid for these therapies and a new implementation of the NanOx model is necessary and under study. Regarding TRT, the dose-rate effect has to be taken into account as well, since the uptake of the radio-pharmaceutical and the kinetics of radioactive decay imply long irradiation periods in contrast to hadrontherapy and BNCT.
While the results of the present study are encouraging, the use of NanOx in clinical applications will only be possible once its predictions are benchmarked against in vivo experiments [33, 34, 35, 36]. Moving from in vitro to in vivo systems implies different mechanisms such as non-targeted effects, for instance the bystander and abscopal effects, and the micro-environment effects. At this time, no biophysical model applied in therapy takes explicitly into account these mechanisms as it poses a huge challenge. This subject could be therefore another exciting pathway for future developments.
In this paper we established the approximations and simplifications needed for applying the NanOx biophysical model in hadrontherapy. In contrast to other frameworks in the literature, NanOx takes into account the fluctuations in the energy deposits induced by ionizing radiation down to the nanometric scale, and models the oxidative stress induced by chemical reactive species by introducing the notions of chemical specific energy and global lethal events.
Our calculations indicate that such energy fluctuations have an important impact on cell survival probability. The NanOx predictions of the latter are therefore in overall agreement with the available experimental data, as presented for V79, CHO-K1 and HSG cells in response to carbon ions of different energies. These results are encouraging and show that the current implementation of NanOx may be used for generating tables of the radiobiological α and β coefficients for a set of radiation qualities and cell lines of interest in hadrontherapy. Furthermore, a successful translation to clinics (i.e., integration into TPS) would be feasible if the predictive capabilities of the model are verified on in vivo data.
As shown in this work, the rigorous mathematical formalism on which NanOx is built can be easily extended to different radiotherapy techniques. This makes of NanOx a very versatile model with plenty of room for improvement as further research enlightens about new variables and processes to consider for a more accurate description of the radio-induced biological effects.
The raw data supporting the conclusion of this article will be made available by the authors, without undue reservation.
MA-A, CM, and MC performed the simulations and wrote the first draft of the paper. MC, ET, and MB conceived and developed the NanOx model. ET and MB designed and supervised the work and revised the manuscript.
This work was performed in the framework of the LabEx PRIMES (ANR-11-LABX-0063) of the Université de Lyon, within the program “Investissements d’Avenir” (ANR-11-IDEX-0007) operated by the French National Research Agency (ANR). We acknowledge the financial support of the French National Institute of Health and Medical Research (Inserm), through the grant “Apports à l’oncologie de la physique, de la chimie et des sciences de l’ingénieur”, no. 20CP176-00.
The authors declare that the research was conducted in the absence of any commercial or financial relationships that could be construed as a potential conflict of interest.
All claims expressed in this article are solely those of the authors and do not necessarily represent those of their affiliated organizations, or those of the publisher, the editors and the reviewers. Any product that may be evaluated in this article, or claim that may be made by its manufacturer, is not guaranteed or endorsed by the publisher.
1The indexes r and L in the coefficient αr,L mean “reference” and “local”, respectively.
1. Kamada T, Tsujii H, Eea B, Debus J, De Neve W, Durante M, et al. Carbon ion radiotherapy in Japan: An assessment of 20 years of clinical experience. Lancet Oncol (2015) 16:93–100. doi:10.1016/s1470-2045(14)70412-7
2. Durante M, Debus J. Heavy charged particles: Does improved precision and higher biological effectiveness translate to better outcome in patients? Semin Radiat Oncol (2018) 28:160–7. doi:10.1016/j.semradonc.2017.11.004
3. Kim Y, Kim J, Cho S. Review of the existing relative biological effectiveness models for carbon ion beam therapy. Prog Med Phys (2020) 31:1–7. doi:10.14316/pmp.2020.31.1.1
4. Furusawa Y, Fukutsu K, Aoki M, Itsukaichi H, Eguchi-Kasai K, Ohara H, et al. Inactivation of aerobic and hypoxic cells from three different cell lines by accelerated 3He-12C- and 20Ne-ion beams. Radiat Res (2000) 154:485–96. doi:10.1667/0033-7587(2000)154[0485:IOAAHC]2.0.CO;2
5. McMahon SJ. The linear quadratic model: Usage, interpretation and challenges. Phys Med Biol (2018) 64:01TR01. doi:10.1088/1361-6560/aaf26a
6. Scholz M, Kellerer AM, Kraft-Weyrather W, Kraft G. Computation of cell survival in heavy ion beams for therapy. Radiat Environ Biophys (1997) 36:59–66. doi:10.1007/s004110050055
7. Elsässer T, Weyrather WK, Friedrich T, Durante M, Iancu G, Krämer M, et al. Quantification of the relative biological effectiveness for ion beam radiotherapy: Direct experimental comparison of proton and carbon ion beams and a novel approach for treatment planning. Int J Radiat Oncol Biol Phys (2010) 78:1177–83. doi:10.1016/j.ijrobp.2010.05.014
8. Kase Y, Kanai T, Matsumoto Y, Furusawa Y, Okamoto H, Asaba T, et al. Microdosimetric measurements and estimation of human cell survival for heavy-ion beams. Radiat Res (2006) 166:629–38. doi:10.1667/RR0536.1
9. Inaniwa T, Furukawa T, Kase Y, Matsufuji N, Toshito T, Matsumoto Y, et al. Treatment planning for a scanned carbon beam with a modified microdosimetric kinetic model. Phys Med Biol (2010) 55:6721–37. doi:10.1088/0031-9155/55/22/008
10. Schardt D, Elsässer T, Schulz-Ertner D. Heavy-ion tumor therapy: Physical and radiobiological benefits. Rev Mod Phys (2010) 82:383–425. doi:10.1103/RevModPhys.82.383
11. Beuve M. Formalization and theoretical analysis of the local effect model. Radiat Res (2009) 172:394–402. doi:10.1667/RR1544.1
12. Russo G, Attili A, Bourhaleb F, Marchetto F, Peroni C, Schmitt E, et al. Analysis of the reliability of the local effect model for the use in carbon ion treatment planning systems. Radiat Prot Dosimetry (2011) 143:497–502. doi:10.1093/rpd/ncq407
13. Cunha M, Monini C, Testa E, Beuve M. NanOx: A new model to predict cell survival in the context of particle therapy. Phys Med Biol (2017) 62:1248–68. doi:10.1088/1361-6560/aa54c9
14. Alcocer-Ávila M, Monini C, Cunha M, Testa E, Beuve M. Formalism of the NanOx biophysical model for radiotherapy applications (2022). Manuscript submitted for publication.
15. Monini C, Cunha M, Chollier L, Testa E, Beuve M. Determination of the effective local lethal function for the NanOx model. Radiat Res (2020) 193:331. doi:10.1667/RR15463.1
16. Gervais B, Beuve M, Olivera G, Galassi M. Numerical simulation of multiple ionization and high LET effects in liquid water radiolysis. Radiat Phys Chem (2006) 75:493–513. doi:10.1016/j.radphyschem.2005.09.015
17. Zaider M, Rossi HH. The synergistic effects of different radiations. Radiat Res (1980) 83:732. doi:10.2307/3575352
18. Kanai T, Furusawa Y, Fukutsu K, Itsukaichi H, Eguchi-Kasai K, Ohara H. Irradiation of mixed beam and design of spread-out Bragg peak for heavy-ion radiotherapy. Radiat Res (1997) 147:78–85. doi:10.2307/3579446
19. Beuve M, Alphonse G, Maalouf M, Colliaux A, Battiston-Montagne P, Jalade P, et al. Radiobiologic parameters and Local Effect Model predictions for head-and-neck squamous cell carcinomas exposed to high linear energy transfer ions. Int J Radiat Oncol Biol Phys (2008) 71:635–42. doi:10.1016/j.ijrobp.2007.10.050
20. Cucinotta FA, Nikjoo H, Goodhead DT. Applications of amorphous track models in radiation biology. Radiat Environ Biophys (1999) 38:81–92. doi:10.1007/s004110050142
21. Pouget JP, Mather SJ. General aspects of the cellular response to low- and high-LET radiation. Eur J Nucl Med (2001) 28:541–61. doi:10.1007/s002590100484
22. Monini C, Cunha M, Testa E, Beuve M. Study of the influence of NanOx parameters. Cancers (2018) 10:87. doi:10.3390/cancers10040087
23. Beuve M, Colliaux A, Dabli D, Dauvergne D, Gervais B, Montarou G, et al. Statistical effects of dose deposition in track-structure modelling of radiobiology efficiency. Nucl Instrum Methods Phys Res B (2009) 267:983–8. doi:10.1016/j.nimb.2009.02.016
24. James F. MINUIT function minimization and error analysis: Reference manual version 94.1. Geneva, Switzerland: CERN (1994).
25. Brun R, Rademakers F. Root — An object oriented data analysis framework. Nucl Instrum Methods Phys Res A (1997) 389:81–6. doi:10.1016/s0168-9002(97)00048-x
26. Monini C, Alphonse G, Rodriguez-Lafrasse C, Testa E, Beuve M. Comparison of biophysical models with experimental data for three cell lines in response to irradiation with monoenergetic ions. Phys Imaging Radiat Oncol (2019) 12:17–21. doi:10.1016/j.phro.2019.10.004
27. Friedrich T, Scholz U, Elsässer T, Durante M, Scholz M. Systematic analysis of RBE and related quantities using a database of cell survival experiments with ion beam irradiation. J Radiat Res (2013) 54:494–514. doi:10.1093/jrr/rrs114
28. Parisi A, Sato T, Matsuya Y, Kase Y, Magrin G, Verona C, et al. Development of a new microdosimetric biological weighting function for the RBE10 assessment in case of the V79 cell line exposed to ions from 1H to 238U. Phys Med Biol (2020) 65:235010. doi:10.1088/1361-6560/abbf96
29. Sarrut D, Bala M, Bardies M, Bert J, Chauvin M, Chatzipapas K, et al. Advanced Monte Carlo simulations of emission tomography imaging systems with GATE. Phys Med Biol (2021) 66:10TR03. doi:10.1088/1361-6560/abf276
30. Ali Y, Monini C, Russeil E, Létang JM, Testa E, Maigne L, et al. Estimate of the biological dose in hadrontherapy using GATE. Cancers (2022) 14:1667. doi:10.3390/CANCERS14071667
31. Chanrion MA, Sauerwein W, Jelen U, Wittig A, Engenhart-Cabillic R, Beuve M. The influence of the local effect model parameters on the prediction of the tumor control probability for prostate cancer. Phys Med Biol (2014) 59:3019–40. doi:10.1088/0031-9155/59/12/3019
32. Colliaux A, Gervais B, Rodriguez-Lafrasse C, Beuve M. O2 and glutathione effects on water radiolysis: A simulation study. J Phys : Conf Ser (2011) 261:012007. doi:10.1088/1742-6596/261/1/012007
33. Colliaux A, Gervais B, Rodriguez-Lafrasse C, Beuve M. Simulation of ion-induced water radiolysis in different conditions of oxygenation. Nucl Instrum Methods Phys Res B (2015) 365:596–605. doi:10.1016/J.NIMB.2015.08.057
34. Karger CP, Glowa C, Peschke P, Kraft-Weyrather W. The RBE in ion beam radiotherapy: In vivo studies and clinical application. Z Medizinische Physik (2021) 31:105–21. doi:10.1016/j.zemedi.2020.12.001
35. Mein S, Klein C, Kopp B, Magro G, Harrabi S, Karger CP, et al. Assessment of RBE-weighted dose models for carbon ion therapy toward modernization of clinical practice at HIT: In vitro, in vivo, and in patients. Int J Radiat Oncol Biol Phys (2020) 108:779–91. doi:10.1016/j.ijrobp.2020.05.041
36. Saager M, Glowa C, Peschke P, Brons S, Grün R, Scholz M, et al. Fractionated carbon ion irradiations of the rat spinal cord: Comparison of the relative biological effectiveness with predictions of the local effect model. Radiat Oncol (2020) 15:6. doi:10.1186/s13014-019-1439-1
Keywords: NanOx, biophysical model, cell survival probability, hadrontherapy, V79, CHO-K1, HSG, α/β tables
Citation: Alcocer-Ávila M, Monini C, Cunha M, Testa É and Beuve M (2022) Cell survival prediction in hadrontherapy with the NanOx biophysical model. Front. Phys. 10:1011063. doi: 10.3389/fphy.2022.1011063
Received: 03 August 2022; Accepted: 10 October 2022;
Published: 07 November 2022.
Edited by:
Julie Constanzo, INSERM U1194 Institut de Recherche en Cancérologie de Montpellier (IRCM), FranceReviewed by:
Ali Parach, Institut de Recherche en Cancérologie de Montpellier (IRCM), FranceCopyright © 2022 Alcocer-Ávila, Monini, Cunha, Testa and Beuve. This is an open-access article distributed under the terms of the Creative Commons Attribution License (CC BY). The use, distribution or reproduction in other forums is permitted, provided the original author(s) and the copyright owner(s) are credited and that the original publication in this journal is cited, in accordance with accepted academic practice. No use, distribution or reproduction is permitted which does not comply with these terms.
*Correspondence: Michaël Beuve , bWljaGFlbC5iZXV2ZUB1bml2LWx5b24xLmZy
Disclaimer: All claims expressed in this article are solely those of the authors and do not necessarily represent those of their affiliated organizations, or those of the publisher, the editors and the reviewers. Any product that may be evaluated in this article or claim that may be made by its manufacturer is not guaranteed or endorsed by the publisher.
Research integrity at Frontiers
Learn more about the work of our research integrity team to safeguard the quality of each article we publish.