 Xiang Chen
 Mai Hu2,3
 Zhenyu Xu
 Ruifeng Kan
94% of researchers rate our articles as excellent or good
Learn more about the work of our research integrity team to safeguard the quality of each article we publish.
Find out more
ORIGINAL RESEARCH article
Front. Phys., 30 September 2022
Sec. Atomic and Molecular Physics
Volume 10 - 2022 | https://doi.org/10.3389/fphy.2022.1009843
A convenient method of light intensity correction for quartz-enhanced photoacoustic spectroscopy (QEPAS) using photothermal baseline is demonstrated. The laser beam passes through the prongs of the quartz tuning fork (QTF) and then focused on the root of the prongs. First harmonic (1f) analysis is utilized to process the simultaneously induced photoacoustic and photothermal signals. The optical path length for photothermal spectroscopy is minimized to millimeter level, yielding negligible gas absorption. The demodulated 1f signal can be regarded as the superposition of the photoacoustic signal and the non-absorption photothermal baseline. A good linear relationship (R2 = 0.999) is observed between amplitude of photothermal baseline and light intensity. QEPAS signal normalized by photothermal baseline shows a good immunity to light intensity variation. An excellent linear response between normalized QEPAS signal and gas concentration is achieved. According to the Allan deviation analysis, the minimum detection limit for CH4 is 0.31 ppm at an integration time of 1,200 s. With this strategy, the precise gas concentration and accurate light intensity of a QEPAS system can be simultaneously obtained with only a single QTF. Compared with the light intensity correction using a photodetector or a power meter, this method entails a low cost and small footprint. It is promising to mitigate the influence from light intensity drift in long-term field measurement of QEPAS systems.
Quartz-enhanced photoacoustic spectroscopy has been widely employed in trace gas sensing due to its immunity to environmental noise, high detection sensitivity and small size [1–4]. When modulated laser emission is in resonance with gas analyte, its successive non-radiative relaxation [5–7] can generate acoustic waves. Acoustic microresonators with appropriate configurations are usually employed to improve the photoacoustic sensitivity [7–9]. The QEPAS signal is proportional to light intensity, while laser intensity-induced fluctuations could be eliminated with simple compensation process by synchronously measuring the laser intensity variation [10–13] using a photodetector or a power meter. Hence, precise gas concentration can be obtained in long-term filed applications. However, additional photodetector (PD) or power meter will bring detection errors and biases and needs to be calibrated periodically. Moreover, the PD or power meter will entail a high cost and complexity especially for mid-infrared or terahertz laser-based QEPAS system. Furthermore, it can be much more complex to handle light intensity drifts when the light system comprises multiple lasers of different wavelengths or instantaneous broadband spectral coverage [14–17], especially when the responsivity of the PD or the power meter varies with wavelength.
Similar to QEPAS, the QTF can also be used as the high-performance photothermal transducer for quartz-enhanced photothermal spectroscopy (QEPTS) [18–20]. While the laser radiation modulated at the resonance frequency hits the surface of the QTF, the prongs will vibrate due to the light-thermo elastic conversion. The piezoelectric current is then converted to output voltage by a trans-impedance amplifier and the harmonic components can be retrieved with a lock-in amplifier. QEPTS is a non-contact measurement technique that can be used for remote gas detection [21–23]. With the application of scanned wavelength modulation strategy, offset of the demodulated 1f component is proportional to the light intensity and can be utilized to trace the fluctuations of light intensity [24]. However, this requires tricky modulation to stay within the resonance curve of the high quality tuning fork, which makes it less convenient in the application of QPEAS-based sensors.
To mitigate the light intensity drift easily during long-term field measurement for QEPAS systems, we report a method of light intensity correction using photothermal baseline. The CH4 absorption line at 1,653.72 nm, as an example, is experimentally investigated. The distributed feedback (DFB) fiber-coupled semiconductor laser is controlled with scanned wavelength modulation technology. Output laser beam passes through the prongs of the QTF and then focused on the root of the prongs so as to inspire photoacoustic and photothermal signals simultaneously. To minimize the gas absorption for QEPTS, the optical path length is designed as short as 8 mm. First harmonic analysis is performed to process the raw photoacoustic-thermal signals. The relationship between light intensity and photothermal baseline is explored. The concentration calibration and Allan deviation analysis are performed to evaluate the sensor performance. With the 1f analysis, precise gas concentration and accurate light intensity can be concurrently detected.
When a DFB laser is modulated by a sinusoidal modulation current, the laser frequency
where
where C is the gas concentration, N is the total molecular density, S is the line strength,
where kQEPAS is the constant of the photoacoustic spectroscopy. For the sake of simplicity, the phase shift between gas absorption and photoacoustic signal is neglected. Eq. 4 can be further described as
Mathematically, demodulating the signal means multiplying Eq. 5 by cos(
The Fourier coefficients of absorption for QEPAS with orders larger than 3 are strictly equal to 0. According to Eq. 6, the first harmonic component of QEPAS signal is proportional to laser intensity and gas concentration. Also, the first harmonic component for QEPAS will turn to zero for non-absorption conditions, which makes QEPAS a background-free technique. The QEPTS signal is given by [28].
where kQEPTS is the constant of the photothermal spectroscopy, P is the gas pressure, L is the optical path length. Similar to QEPAS, Eq. 7 can be described as
where hm is the mth order Fourier coefficient of absorption for QEPTS. Demodulating the QEPTS signal with the in-phase reference signal, the first harmonic component of QEPTS can be expressed as
According to Eq. 6 and Eq. 9, the main differences between 1f photoacoustic and photothermal signals are the non-absorption background and the response coefficient. If L is short enough to generate a thin absorption, the absorption part of QEPTS can be neglected and Eq. 9 can be simplified as
Hence, the non-absorption first harmonic signal of QEPTS is independent from the h factors and is proportional to laser intensity. If we can obtain the photoacoustic and photothermal signals simultaneously, the QEPAS signal is equal to zero theoretically and the QEPTS signal is proportional to light intensity in the non-absorption area of the spectrum. By normalizing the QEPAS signal to the non-absorption first harmonic signal of QEPTS, the dependence of QEPAS on laser intensity can be intrinsically removed.
Figure 1 shows the schematic diagram of the research on light intensity correction for QEPAS using photothermal signal. A distributed feedback fiber-coupled semiconductor laser with a center wavelength of 1,654 nm is utilized as the light source and is operated by the home-made temperature and current driver. The CH4 absorption line located at 1,653.72 nm is investigated in this experiment. A sinusoidal wave at the resonant frequency of the QTF is superimposed with another sinusoidal wave of 0.04 Hz to modulate the injection current of the DFB laser. The modulation and scanning signals are generated by a waveform generator (SDG1032X, Siglent) and are superposed using a home-made adder. Reference signal used for demodulation is also generated by the waveform generator. The modulated laser beam is collimated with the fiber collimator (FC) and then passes through the prongs of the QTF. A pair of on-beam acoustic micro-resonators are employed to increase the amplitudes of QEPAS signal. A reflector coated with gold film (R>99%) is utilized to reflect the transmission beam to the root of the two prongs of the QTF. The laser beam diameter at the two focusing positions is calculated to be about 0.15 mm. With this configuration, the photoacoustic and photothermal signals can be simultaneously generated. Since the optical path length for QEPTS is only 8 mm, the corresponding gas absorption can be neglected. Piezoelectric current induced by photoacoustic and photothermal effects is converted to voltages by a low noise trans-impedance pre-amplifier with a 10 MΩ feedback resistor. A lock-in amplifier (RS865A, Stanford Research Systems) is used to retrieve the combined 1f component from the photoacoustic-thermal signal. Data acquisition of the 1f signal is performed by a data acquisition device (USB 6363, National Instruments) with a sampling rate of 2 kS/s and a vertical resolution of 16 bits. The raw 1f signal is averaged over 10 scans to enhance the signal-to-noise ratio. All data processing is implemented by a computer.
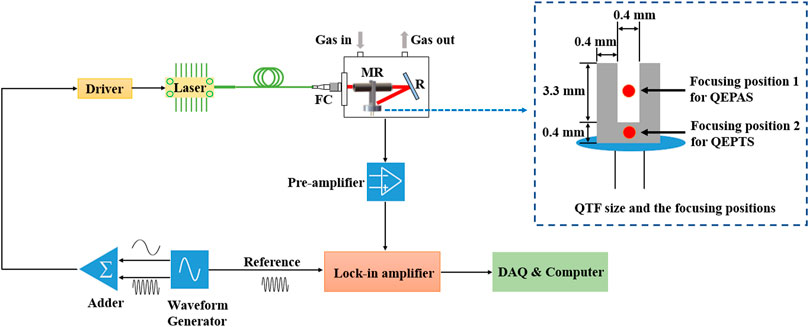
FIGURE 1. Schematic diagram of the experimental setup. FC: fiber collimator; MR: micro-resonators; R: reflector.
The properties of the QTF are investigated via a function generator. Sinusoidal signal ranging from 32701.00 Hz to 32741.00 Hz with a step of 1.00 Hz is injected into the QTF. Peak value of output signal from the QTF is recorded with the data acquisition device and the response curve can be well fitted by a Lorentz profile. As shown in Figure 2, the intrinsic resonant frequency and bandwidth are measured as 32721.60 Hz and 6.81 Hz, respectively, yielding a quality factor of 4,804. In the following experiments, the modulation frequency of 32721.60 Hz for CH4 detection is selected and the corresponding 1f signal is retrieved to demonstrate the method of light intensity correction for QEPAS sensor.
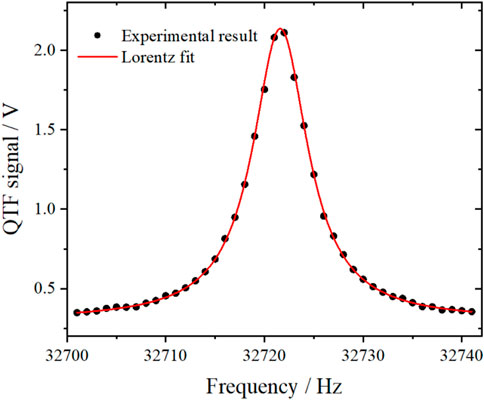
FIGURE 2. Frequency response curve of the QTF fitted with the Lorentz profile.
The laser modulation depth, which relates to the modulation current, should be optimized to improve the amplitude of the 1f signal. The sinusoidal scanning signal of 0.04 Hz, superimposed with a sinusoidal modulation signal of 32721.60 Hz is utilized to modulate the laser current. CH4 gas sample of a fixed concentration is injected into the photoacoustic cell with a flow rate of 50 ml/min. The 1f components of different modulation currents are obtained by demodulating the output signals from the QTF. Figure 3 depicts the relationship between the 1f amplitude and modulation current. The maximum 1f amplitude is achieved while the modulation current is 35 mA. Therefore, the optimized modulation current of 35 mA is selected for CH4 detection in the subsequent investigations.
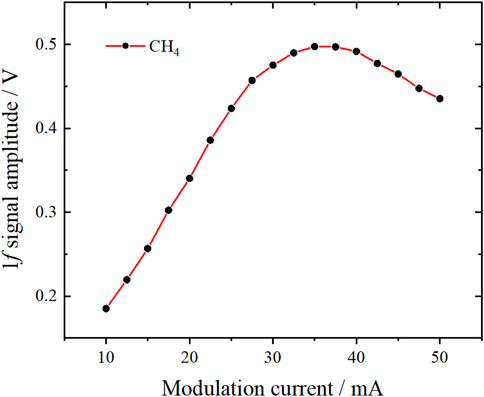
FIGURE 3. 1f signal amplitudes of CH4 corresponding to varied modulation currents.
To demonstrate the method of light intensity correction for QEPAS using photothermal baseline, the output light intensity is adjusted by an attenuator from 4.03 mW to 16.82 mW. Standard gas samples of 500-ppm CH4 and pure N2 are introduced into the photoacoustic cell selectively with a flow rate of 50 ml/min and the measured 1f components under different laser intensities are recorded. The modulation signal during one scanning cycle is shown in Figure 4A. Figure 4B demonstrates typical 1f signals under different conditions while the light intensity is 16.82 mW. The solid red line indicates the QEPAS signal of 500-ppm CH4 without QEPTS signal by blocking the reflector. The dotted blue line indicates the photoacoustic-thermal signal of 500-ppm CH4 while the reflector is installed. The solid blue line indicates the photothermal signal while the reflector is installed and photoacoustic cell is filled with pure N2. It could be seen that the demodulated photoacoustic-thermal signal can be regarded as the superposition of the photoacoustic signal and the non-absorption photothermal baseline. Moreover, the amplitude of the photothermal baseline is barely interfered by the gas absorption. The photoacoustic signal becomes negligible compared to the photothermal signal in the non-absorption area during one scanning cycle.
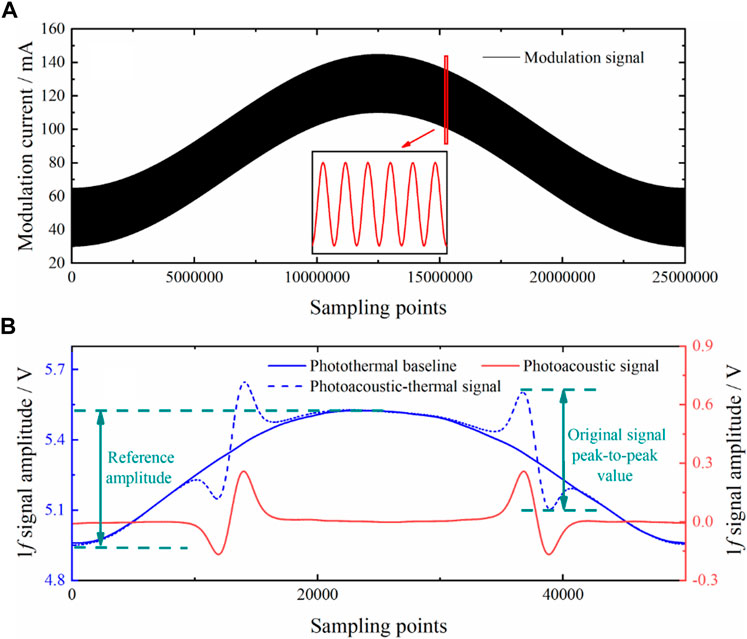
FIGURE 4. (A) The modulation signal during one scanning cycle; (B) Typical 1f signals under different conditions.
Figure 5A depicts the measured 1f photoacoustic-thermal signals under different light intensities. The relationship between amplitude of the photothermal baseline and light intensity is plotted in Figure 5B. An excellent linear relationship is observed with a correlation coefficient of 0.999. The relationship between peak-to-peak amplitude of the photoacoustic-thermal signal and light intensity is plotted in Figure 6A, also indicating an excellent linear relationship (R2 = 0.999). Figure 6B shows the peak-to-peak amplitudes of the photothermal-acoustic signals normalized by the amplitudes of the photothermal baselines under different light intensities. It can be seen that the peak-to-peak amplitude change of the photothermal-acoustic signal induced by varying light intensity can be corrected accurately with the photothermal baseline. The maximum deviation of the normalized peak-to-peak amplitude is within 0.7% under different light intensity from 4.03 mW to 16.82 mW.
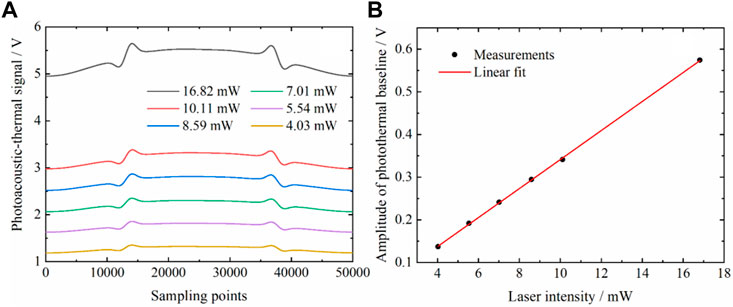
FIGURE 5. (A) Photoacoustic-thermal signals under different light intensities; (B) Amplitudes of photothermal baselines under different light intensities.
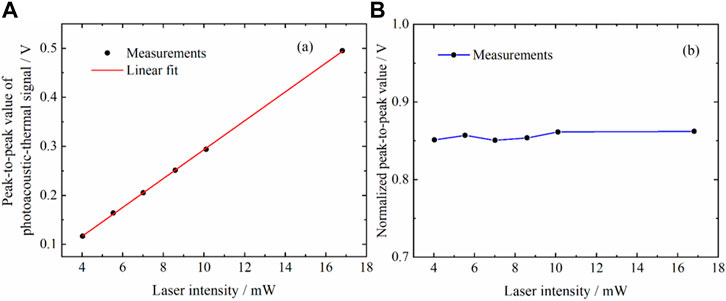
FIGURE 6. (A) Peak-to-peak values of photoacoustic-thermal signals under different light intensities; (B) Normalized peak-to-peak values of photoacoustic-thermal signals under different light intensities.
The response of the detection system at different concentrations of gas samples is investigated. Pure N2 and standard gas samples of CH4 (200 ppm, 300 ppm, 400 ppm, 500 ppm, 600 ppm, 700 ppm, 800 ppm) are introduced into the photoacoustic cell successively at a flow rate of 50 ml/min. Raw 1f photoacoustic-thermal signals under different gas concentrations are demonstrated in Figure 7A. The peak-to-peak values of photoacoustic-thermal signals normalized by the amplitudes of photothermal baselines are calculated and a good linear relationship (R2 = 0.998) between gas concentration and peak-to-peak value for different gas samples is observed in Figure 7B.
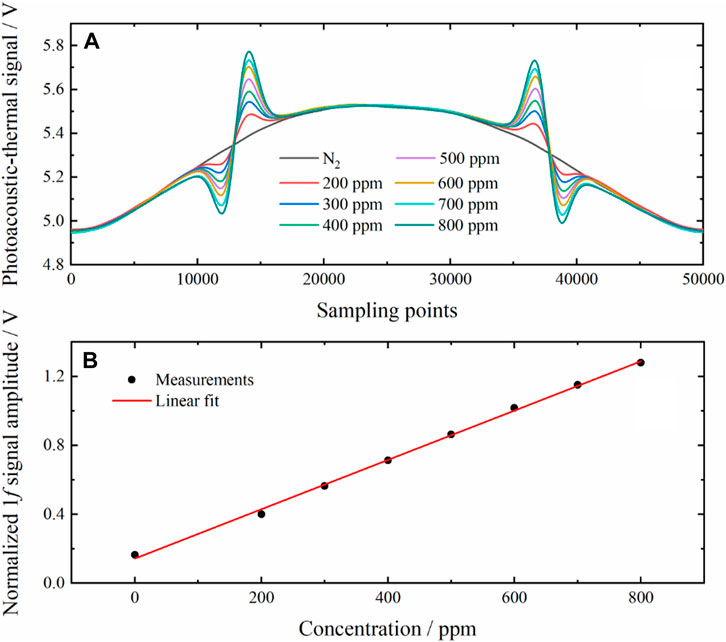
FIGURE 7. (A) Photoacoustic-thermal signals under different gas concentrations; (B) Calibration of the detection responsivity.
The minimum detection limit of the detection system for CH4 is studied as a function of integration time. The standard gas sample of 500-ppm CH4 is introduced into the photoacoustic cell continuously and the peak-to-peak value of photothermal-acoustic signal normalized by photothermal baseline is recorded during a long time period. Allan deviation analysis is performed and the experimental results are plotted in Figure 8. The 25-s detection limit of 2.72 ppm for CH4 is achieved. With an optimum integration time of about 1,200 s, the minimum detection limit for CH4 can be improved to 0.31 ppm.
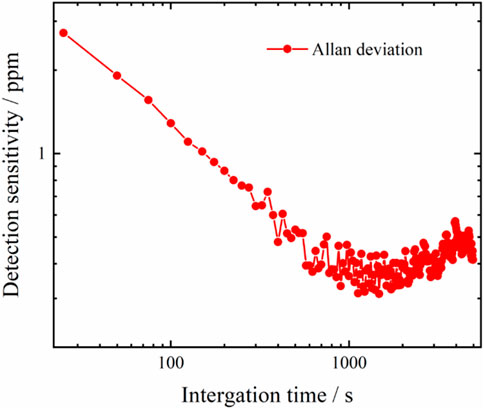
FIGURE 8. Allan deviation analysis.
In this article, we have reported a convenient method of light intensity correction for QEPAS using photothermal baseline. To illustrate its feasibility, the laser beam passes through the prongs of the QTF and then focuses on the root of the prongs. The photoacoustic and photothermal signals are induced simultaneously on the same QTF. Since the optical path length for photothermal spectroscopy is as short as 0.8 cm, the corresponding gas absorption can be neglected. With the 1f analysis, precise gas concentration and accurate light intensity for CH4 detection can be obtained at the same time. QEPAS signal normalized by photothermal baseline shows a good immunity to light intensity changes. An excellent linear response between normalized QEPAS signal and gas concentration is observed. According to the Allan deviation analysis, a minimum detection limit of 0.31 ppm for CH4 is achieved. With this detection strategy, laser intensity-induced fluctuations of the QEPAS signal could be eliminated conveniently with the photothermal baseline. Compared with the light intensity correction using a photodetector or a power meter, this method entails a low cost and a small footprint. It will be promise to handle light intensity drifts when the light system comprises multiple lasers of different wavelengths or instantaneous broadband spectral coverage, especially when the responsivity of the PD or the power meter varies with wavelength. The proposed method will also work while there is a phase shift between laser intensity and the excited sound wave. While laser absorption along the path becomes significant for photothermal signal, the 1f signal can still be regarded as the superposition of the photoacoustic and photothermal signal. We can increase the scanning range of the injection current of the laser to obtain the non-absorption area in the spectrum. However, due to the absorption of the photothermal signal, peak-to-peak value of the 1f signal in the absorption area may change subsequently. Since the installation and adjustment of the internal reflector may be complicated, an improved structure with a reflector located outside the photoacoustic cell will be studied further.
The raw data supporting the conclusions of this article will be made available by the authors, without undue reservation.
XC, Data curation, Formal analysis, Methodology, Writing—original draft. MH, Conceptualization, Visualization, Writing—review and editing. HL, Formal analysis, investigation. LY, Software, Validation. ZX, Resources, Validation. RK, Writing—review and editing.
This research was supported by the National Key Research and Development Project (2019YFB2006003), the Foundation from the Key Laboratory of Environmental Optics and Technology (2005DP173065-2021-03), and the Strategic Priority Research Program of the Chinese Academy of Sciences (XDA22020502).
The authors declare that the research was conducted in the absence of any commercial or financial relationships that could be construed as a potential conflict of interest.
All claims expressed in this article are solely those of the authors and do not necessarily represent those of their affiliated organizations, or those of the publisher, the editors and the reviewers. Any product that may be evaluated in this article, or claim that may be made by its manufacturer, is not guaranteed or endorsed by the publisher.
1. Wang Z, Wang Q, Zhang H, Borri S, Galli I, Sampaolo A, et al. Doubly resonant sub-ppt photoacoustic gas detection with eight decades dynamic range. Photoacoustics (2022) 27:100387. doi:10.1016/j.pacs.2022.100387
2. Elefante A, Menduni G, Rossmadl H, Mackowiak V, Giglio M, Sampaolo A, et al. Environmental monitoring of methane with quartz-enhanced photoacoustic spectroscopy exploiting an electronic hygrometer to compensate the H2O influence on the sensor signal. Sensors (2020) 20:2935. doi:10.3390/s20102935
3. Ma YF, Yu X, Yu G, Li XD, Zhang JB, Chen DY, et al. Multi-quartz-enhanced photoacoustic spectroscopy. Appl Phys Lett (2015) 107:021106. doi:10.1063/1.4927057
4. Zhang H, Jin WL, Hu MP, Hu M, Liang JQ, Wang Q. Investigation and optimization of a line-locked quartz enhanced spectrophone for rapid carbon dioxide measurement. Sensors (2021) 21:5225. doi:10.3390/s21155225
5. Cao Y, Liu K, Wang R, Chen W, Gao XM. Three-wavelength measurement of aerosol absorption using a multi-resonator coupled photoacoustic spectrometer. Opt Express (2021) 29:2258–69. doi:10.1364/OE.412922
6. Wu HP, Dong L, Zheng HD, Yu YJ, Ma WG, Zhang L, et al. Beat frequency quartz-enhanced photoacoustic spectroscopy for fast and calibration-free continuous trace-gas monitoring. Nat Commun (2017) 8:15331. doi:10.1038/ncomms15331
7. Wang ZL, Zhang QD, Chang J, Tian CW, Tang LF, Feng YW, et al. Quartz-enhanced photoacoustic spectroscopy based on the four-off-beam acoustic micro-resonator. J Lightwave Technol (2020) 38:5212–8. doi:10.1109/JLT.2020.2998848
8. Yi HM, Chen WD, Sun SW, Liu K, Tan T, Gao XM. T-shape microresonator-based high sensitivity quartz-enhanced photoacoustic spectroscopy sensor. Opt Express (2012) 20:9187–96. doi:10.1364/OE.20.009187
9. Dong L, Wu HP, Zheng HD, Liu YY, Liu XL, Jiang WZ, et al. Double acoustic microresonator quartz-enhanced photoacoustic spectroscopy. Opt Lett (2014) 39:2479–82. doi:10.1364/OL.39.002479
10. Johannes PW, Harald M, Bernhard L. Compact quantum cascade laser based quartz-enhanced photoacoustic spectroscopy sensor system for detection of carbon disulfide. Opt Express (2016) 24:6559–71. doi:10.1364/OE.24.006559
11. Wang Z, Wang Q, Ching JY, Wu JC, Zhang GF, Ren W. A portable low-power QEPAS-based CO2 isotope sensor using a fiber-coupled interband cascade laser. Sensors Actuators B: Chem (2017) 246:710–5. doi:10.1016/j.snb.2017.02.133
12. Liu H, Hu M, Chen X, Deng H, Xu ZY, Wang Q, et al. Sensitive detection of CH4 and CO2 using frequency-division-multiplexing based quartz-enhanced photoacoustic spectroscopy. Acta Optica Sinica (2021) 41:1430003–250. doi:10.3788/AOS202141.1430003
13. Lewicki R, Wysocki G, Kosterev AA, Tittel FK. Carbon dioxide and ammonia detection using 2 µm diode laser based quartz-enhanced photoacoustic spectroscopy. Appl Phys B (2007) 87:157–62. doi:10.1007/s00340-006-2474-9
14. Sampaolo A, Patimisco P, Giglio M, Zifarelli A, Wu HP, Dong L, et al. Quartz-enhanced photoacoustic spectroscopy for multi-gas detection: A review. Analytica Chim Acta (2022) 1202:338894. doi:10.1016/j.aca.2021.338894
15. Wang Z, Zhang H, Wang JN, Jiang SL, Gao SF, Wang YY, et al. Photothermal multi-species detection in a hollow-core fiber with frequency-division multiplexing. Sensors Actuators B: Chem (2022) 369:132333. doi:10.1016/j.snb.2022.132333
16. Wang Q, Wang Z, Zhang H, Jiang SL, Wang YY, Jin W, et al. Dual-comb photothermal spectroscopy. Nat Commun (2022) 13:2181. doi:10.1038/s41467-022-29865-6
17. Mikkonen T, Hieta T, Genty G, Toivonen J. Sensitive multi-species photoacoustic gas detection based on mid-infrared supercontinuum source and miniature multipass cell. Phys Chem Chem Phys (2022) 8:19481–7. doi:10.1039/D2CP01731H
18. Ma YF, He Y, Patimisco P, Sampaolo A, Qiao SD, Yu X, et al. Ultra-high sensitive trace gas detection based on light-induced thermoelastic spectroscopy and a custom quartz tuning fork. Appl Phys Lett (2020) 116:011103. doi:10.1063/1.5129014
19. Lang ZT, Qiao SD, He Y, Ma YF Quartz tuning fork-based demodulation of an acoustic signal induced by photo-thermo-elastic energy conversion. Photoacoustics (2021) 22:100272. doi:10.1016/j.pacs.2021.100272
20. Zheng HD, Lin HY, Dong L, Huang Z, Gu XH, Tang JY, et al. Quartz-enhanced photothermal-acoustic spectroscopy for trace gas analysis. Appl Sci (2019) 9:4021. doi:10.3390/app9194021
21. Ma YF. Recent advances in QEPAS and QEPTS based trace gas sensing: A review. Front Phys (2020) 8:268. doi:10.3389/fphy.2020.00268
22. Qiao SD, He Y, Ma YF. Trace gas sensing based on single-quartz-enhanced photoacoustic-photothermal dual spectroscopy. Opt Lett (2021) 46:2449–51. doi:10.1364/OL.423801
23. Mi Y, Ma YF. Ultra-highly sensitive ammonia detection based on light-induced thermoelastic spectroscopy. Sensors (2021) 21:4548. doi:10.3390/s21134548
24. Xu LG, Li JS, Liu NW, Zhou S. Quartz crystal tuning fork based 2f/1f wavelength modulation spectroscopy. Spectrochimica Acta A: Mol Biomol Spectrosc (2022) 267:120608. doi:10.1016/j.saa.2021.120608
25. Li HJ, Rieker GB, Liu X, Jeffries J, Hanson RK. Extension of wavelength-modulation spectroscopy to large modulation depth for diode laser absorption measurements in high-pressure gases. Appl Opt (2006) 45:1052–61. doi:10.1364/AO.45.001052
26. Yang CG, Mei L, Deng H, Xu ZY, Chen B, Kan RF. Wavelength modulation spectroscopy by employing the first harmonic phase angle method. Opt Express (2019) 27:12137–46. doi:10.1364/OE.27.012137
27. Ma YF, He Y, Tong Y, Yu X, Tittel FK. Ppb-level detection of ammonia based on QEPAS using a power amplified laser and a low resonance frequency quartz tuning fork. Opt Express (2017) 25:29356–64. doi:10.1364/OE.25.029356
Keywords: photoacoustic spectroscopy, quartz tuning fork, photothermal spectroscopy, laser intensity correction, first harmonic analysis
Citation: Chen X, Hu M, Liu H, Yao L, Xu Z and Kan R (2022) Light intensity correction for quartz-enhanced photoacoustic spectroscopy using photothermal baseline. Front. Phys. 10:1009843. doi: 10.3389/fphy.2022.1009843
Received: 02 August 2022; Accepted: 15 September 2022;
Published: 30 September 2022.
Edited by:
Karol Krzempek, Wrocław University of Science and Technology, PolandReviewed by:
Jean-Michel Melkonian, Office National d'Études et de Recherches Aérospatiales, FranceCopyright © 2022 Chen, Hu, Liu, Yao, Xu and Kan. This is an open-access article distributed under the terms of the Creative Commons Attribution License (CC BY). The use, distribution or reproduction in other forums is permitted, provided the original author(s) and the copyright owner(s) are credited and that the original publication in this journal is cited, in accordance with accepted academic practice. No use, distribution or reproduction is permitted which does not comply with these terms.
*Correspondence: Ruifeng Kan, a2FucnVpZmVuZ0BhaW9mbS5hYy5jbg==
Disclaimer: All claims expressed in this article are solely those of the authors and do not necessarily represent those of their affiliated organizations, or those of the publisher, the editors and the reviewers. Any product that may be evaluated in this article or claim that may be made by its manufacturer is not guaranteed or endorsed by the publisher.
Research integrity at Frontiers
Learn more about the work of our research integrity team to safeguard the quality of each article we publish.