- 1Graduate School of Advanced Integrated Studies in Human Survivability, Kyoto University, Kyoto, Japan
- 2Research Department, Economic Research Institute for ASEAN and East Asia, Jakarta, Indonesia
Economic integration is underway in East Asia and the Asia-Pacific region, including the Association of Southeast Asian Nations (ASEAN) community-building process, with the Comprehensive and Progressive Agreement for Trans-Pacific Partnership (CPTPP) coming into effect in 2018 and the Regional Comprehensive Economic Partnership (RCEP) in 2022. While these Regional Trade Agreements (RTAs) have deepened multilateral relations, there is an insufficient mechanism to quantify multilateral diplomacy within the region. Therefore, this study analyzed the region from three perspectives: countries that have contributed to diplomacy for intra-regional cooperation (diplomatic ranking), the cohesiveness of countries in diplomatic stances (diplomatic clusters), and the synchronization period of cooperative events (diplomatic synchronization); and we quantified them by the ranking of diplomatic centrality, blockmodeling of the signed network, and analytic signal, respectively. For analysis, we used bilateral event data to create a political distance network consisting of the original East Asia Summit (EAS) member countries (ASEAN+6) and the United States for the period 1985–2020 and to define diplomatic centrality. Diplomatic ranking indicated three major trends: 1985–1992, 1993–2011, and 2012–2020. Until 1992, Japan, the ASEAN member states (AMS), and Australia ranked at the top, and from 1993 to 2011, Japan and China almost dominated the top. Since 2012, AMS have joined Japan and China in the top ranks. Diplomatic clusters showed the stances of Australia and New Zealand were closest. Throughout the 36 years, the stances of Japan and Republic of Korea were also closer, followed by China, AMS, and the United States. Diplomatic synchronization quantified the progress of regionalism in East Asia. Furthermore, diplomatic rankings in synchronous periods revealed the difference between the diplomatic positions of Japan and China in East Asia and illustrated that AMS were at the center of multilateral diplomacy in the region in 2018–2019.
1 Introduction
East Asia and the Asia-Pacific region are the most dynamic regions in the world where multiple regional initiatives are multi-layered [1]. The development of regionalism commenced at the occasion of the end of the Cold War at the beginning of the 1990s and deepened the trend after the Asian financial crisis in the late 1990s [2]. In 1992, the Association of Southeast Asian Nations (ASEAN), which had previously consisted of Brunei Darussalam, Indonesia, Malaysia, the Philippines, Singapore, and Thailand, declared the establishment of the ASEAN Free Trade Area (AFTA) (Singapore Declaration) [3]. While starting to promote economic integration among the six countries, ASEAN admitted Vietnam in 1995, Lao People’s Democratic Republic (PDR) and Myanmar in 1997, and Cambodia in 1999. Subsequently, ASEAN declared to establish the ASEAN Community at the ninth ASEAN Summit in 2003, signaling a commitment to promoting economic integration in the East Asian region. ASEAN has succeeded in concluding free trade agreements (FTAs) with neighboring countries since the 2000s. Further, East Asia and the Asia-Pacific region promoted the so-called mega-regional trade agreements (mega-RTAs). One is the Comprehensive and Progressive Agreement for Trans-Pacific Partnership (CPTPP); the other is Regional Comprehensive Economic Partnership (RCEP) agreement which entered into force on 30 December 2018, and 1 January 2022, respectively.
Regionalism and regional integration have been broadly studied in the field of international relations [4]. The research trend has been firstly based on the economic and political integration of the European countries [5], then the deepening economic interdependence in the world [6], and shifted to the development of preferential trade agreements, mainly after the end of the Cold War [2, 7, 8]. In line with the studies, some studies have an interest in dividing them into countries that are considered to have been central (or leading) in their formation and their neighbors, meaning which country is taking regional leadership in East Asia and the Asia-Pacific region [1, 9–12]. While this approach is persuasive as an individual argument, it is difficult to quantitatively answer to what extent the supposedly central country (including multiple countries) was central and whether it is truly considered more central than other countries.
In the literature, there are quantitative studies conducted by applying network analysis methods to political science and international relations [13, 14]. Some research has also been conducted to clarify the economic dynamics of the world as a whole from a micro perspective, based on the three factors of people, goods, and money [15]. Those studies analyzed using network science to quantitatively understand the complex relationships among many factors. Some studies also sought to quantitatively measure progress in regional economic integration. Sada and Ikeda analyzed international value-added networks created from international input-output tables and showed that there has been more substantial economic integration in the Pacific Rim than in Europe since the 2008–2009 Global Financial Crisis [16, 17]. This was the result of regionalism in East Asia and the Asia-Pacific region leading to economic integration, as well as the entry into force of the mega-RTAs. However, while the trade data analysis revealed the results of economic integration, the countries that contributed to the development of economic integration were not unclear. It requires an analysis of multilateral cooperation not only from an economic perspective but also from a diplomatic perspective.
Therefore, this study aimed to understand regional economic integration by analyzing international cooperation based on regional relationships. We constructed a network of international relations from events that occurred bilaterally, identifying periods of regional diplomatic relations and the countries that contributed there.
This study made the following contributions. First, the definition of diplomatic centrality has enabled quantitative observation of diplomatic relations within the region. The results revealed that Japan, China, and the ASEAN member states (AMS) in particular contributed to multilateral diplomacy in East Asia. Second, the correlation of diplomatic centrality allowed us to cluster countries by their diplomatic stance within the region. The results confirmed that the stances of New Zealand and Australia are close, as well as Japan and Republic of Korea, China, ASEAN, and the United States, in that order. Finally, the extent of synchronization was calculated based on the phase of diplomatic centrality to identify when diplomatic stances were aligned in East Asia. The results showed that diplomatic stances were most aligned in 2003, when some diplomatic events, including the ninth ASEAN Summit, were held. Furthermore, our study quantified the progress of regionalism by calculating diplomatic synchronization.
The remainder of this paper is organized as follows. Section 2 describes the data and the methods of calculating diplomatic centrality and synchronization, and clustering signed network. Section 3 illustrates the results of diplomatic centrality, clustering, and synchronization. Section 4 discusses the limitations, implications, and applications of our research. Finally, Section 5 presents conclusion.
2 Data and methods
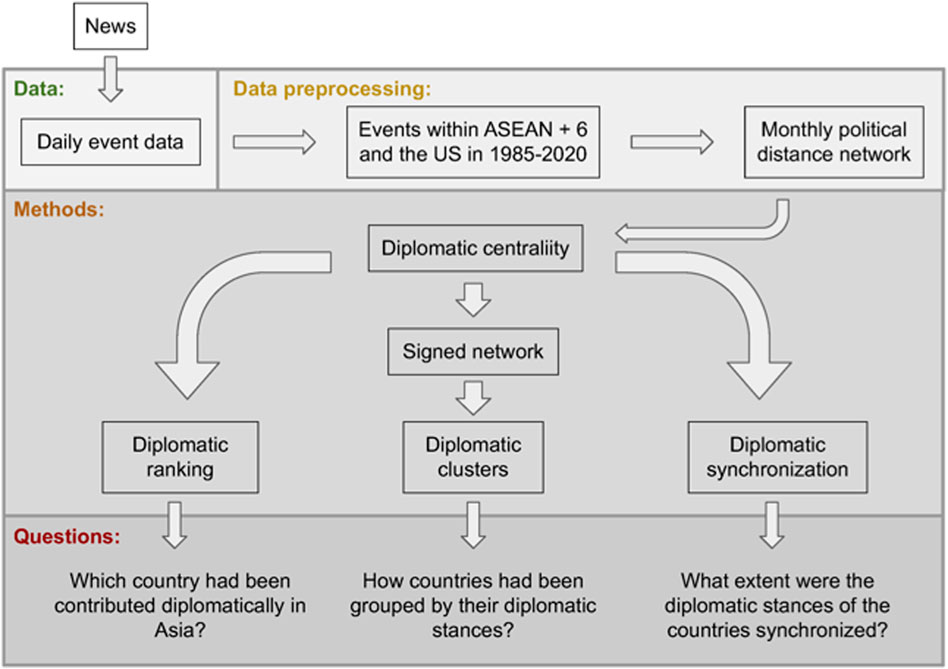
We used event data to quantitatively analyze diplomatic relations in three ways. Figure 1 shows the outline of the international cooperation analysis. It is a quantitative analysis of multilateral diplomacy based on international event data compiled from reports on the Internet.
Unlike economic relations, diplomatic relations do not involve objects to be traded, such as money or goods, and thus cannot rely as directly on data as the economy. However, the development of event data enabled quantitative analysis of diplomatic relations. By applying network science physics methods to these data, we can reinforce our understanding of multilateral diplomacy, which until now has been discussed mainly qualitatively.
2.1 Event data
Databases for analyzing international relations have also been developed. Several data sets have been collected through automated classification of large amounts of text data (e.g. Global Data on Events, Location, and Tone (GDELT) [18], Integrated Crisis Early Warning System (ICEWS) [19], Armed Conflict Location & Event Data Project (ACLED) [20], Militarized Interstate Disputes (MID) [21], Virtual Research Associates (VRA)). These data were used to forecast economy [22], to estimate risks in investment [23], and to study peace [24], protests [25], and economic relations [26–30].
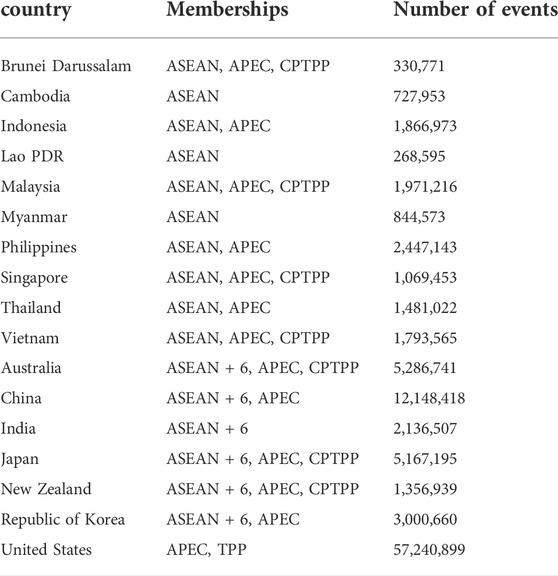
We used GDELT which records daily events involving up to two actors from 1979 to the present. Because it contains the longest period of events of the above data sets and has the largest number of events. In this study, we used the data with no missing country information for the two actors for the years 1985–2020 and selected events that involved 17 countries as actors. The countries are ASEAN plus 6 countries and the United States. Although the United States withdrew from the TPP after signing, it was included in this study because it was pursuing economic integration in the Asia-Pacific region through TPP negotiations. Table 1 displays each country’s number of events in GDELT.
Each daily event data includes the Goldstein scale that rates cooperation-conflict at -10 to +10 for each type of event [31]. GDELT 1.0 used in this study records news reports in English, and Conflict and Mediation Event Observations (CAMEO) is used to classify its events [32]. Each event data in GDELT contains information about its actors (up to two actors). We used data that included two actors and where at least one of the actors was in the country included in Table 1.
For the rationality of using GDELT for our study, we confirmed the FTA negotiations-related events1 (hereafter, FTA events) recorded in GDELT are consistent with the events identified via the press releases by the Japanese government. Table 2 shows the ratio of the number of FTA events of the ASEAN+6 countries recorded in GDELT in a given RCEP-related event (hereafter, RCEP event) month2 identified via Japan’s Ministry of Foreign Affairs (MOFA) website [33] to the average of the FTA events over the year. We can expect that the ratio will take a large value, typically more than one (the number of FTA events in a given month is larger than the yearly average of FTA events) if GDELT successfully detects RCEP events identified via public information. As seen in the table, almost all (26/30) the ratios of RCEP events were more than one. Moreover, the ratios in the months when important RCEP negotiations such as RCEP summits took place were close to or significantly above two. Therefore, using the chronology of the RCEP negotiations compiled by the MOFA of Japan, we confirmed that FTA events were recorded in a given month when RCEP negotiations took place more than in usual months.
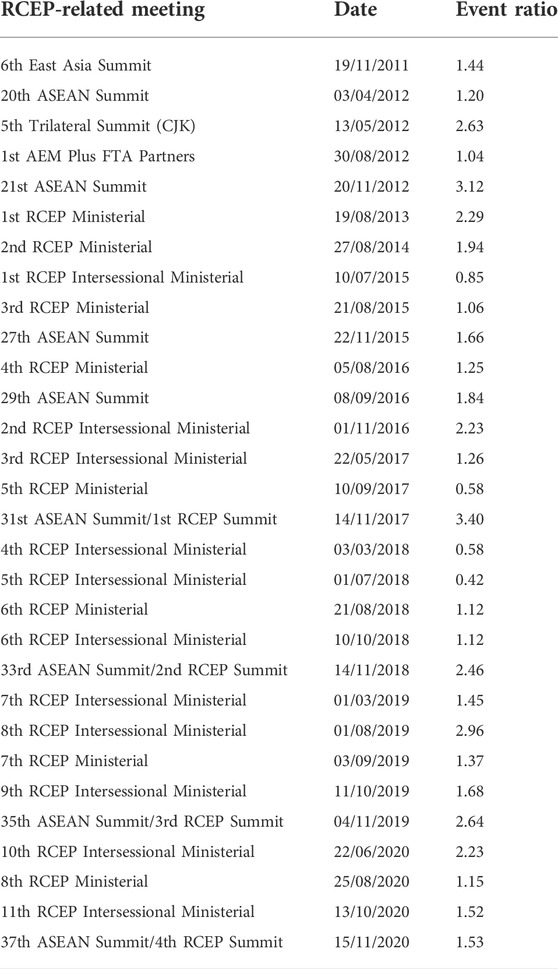
TABLE 2. List of RCEP-related meetings and ratios of a daily average of the number of events in the month per daily average in the year in GDELT. The calculation before the third RCEP Summit used the “engage in negotiation” event and of/after the third RCEP Summit used the “engage in negotiation” and “sign formal agreement” events identified by CAMEO [32] as codes 46 and 57, respectively. These 30 meetings were listed in the timeline summary by the Ministry of Foreign Affairs of Japan [33].
2.2 Political distance and diplomatic centrality
2.2.1 Political distance network
We calculated political distance using the Goldstein scale for events between the 10 AMS and the seven countries taken from GDELT. We redefined the political distance in Hardwick et al. [29] with a value greater than zero that can be used for network analysis.
Let the political distance PM be 1 when the Goldstein scale is 0 or no events in a given month M, and let it be a value that is less than 1 when there are many cooperation events (i.e., the Goldstein scale is positive) and greater than 1 when there are many conflict events (i.e., the Goldstein scale is negative). Then the political distance PijM between country i and country j in a given month M can be expressed as
where G and E are the Goldstein scale and the number of events, respectively.
In this study, the 10 AMS were grouped into one node, ASEAN-10, creating a network of eight nodes. Therefore, extending Eq. 1, we defined the political distance between ASEAN-10 and country i as follows
We constructed a monthly political distance network, a complete undirected graph, using the 6-month moving average of the above political distance P(6ma) as weights. The number of nodes is 8 for ASEAN-10 and the other seven countries, and the number of links is 28. The number of months was 426 months from April 1985 to September 2020 by taking a 6-month moving average.
As explained in Section 1 the number of AMS increased from 6 to 10 between 1995 and 1999. This study, however, analyzed the current 10 AMS collectively as ASEAN-10 throughout the 36-year period. One reason for grouping the 10 AMS together is the small number of events from AMS included in GDELT, especially before the 2000s. The second reason is to remove the effects of disputes among them (e.g., the Cambodian-Thai border dispute). If we create and analyze a political distance network of 17 countries, the political distances with AMS would account for about 60% (56.25% for AMS and 62.5% for other countries) in the calculation of diplomatic centrality presented next. In short, we emphasized the relations between AMS and non-AMS than among AMS.
2.2.2 Diplomatic centrality
Diplomatic centrality is then defined using the average node strength of the political distance network. Let a set of ASEAN-10 and all countries be S, then diplomatic centrality DiM of country i in a month M is
The diplomatic centrality means the average of the political distances for the ASEAN-10 and the seven countries, with the smaller value being more cooperative and the larger value being more conflictual.
Assuming that the better the diplomatic relations are within the region, the smaller the diplomatic centrality, we used the inverse ranking of the diplomatic centrality as the diplomatic ranking. This ranking provides a relative indication of when and which countries have contributed to regional diplomatic relations.
2.3 Signed blockmodeling
Next, to determine how countries are divided by diplomatic stance, we created a signed network based on correlations of diplomatic centrality. Here, we assume that diplomatic stance can be detected by changes in diplomatic centrality and that countries that make the same change at the same time take the same stance. To discover countries with the same diplomatic stance, a network was created from positive and negative correlations between countries, and the nodes were clustered.
We only gave + or − sign information to the links in the signed network. In other words, the signed network was constructed as an undirected and unweighted network. We calculated the correlations of the diplomatic centrality between ASEAN-10 and the seven countries, and if the correlations were significant, the link of the sighed network is the sign of the correlation coefficient. To make it a monthly network, the correlation was first calculated for 6 months from April 1985, and then the starting month was shifted by 1 month thereafter to determine the sign for 426 months. When the p-value was less than 0.01, we considered the correlation significant.
Then, we used blockmodeling to divide a signed network into clusters. We followed Doreian and Mrvar’s blockmodeing approach [34]. The clustering
where
In this study, we performed blockmodeling with k = 3. This is because when k = 2, it is assumed that only two countries (e.g., Australia and New Zealand or Japan and Republic of Korea) are frequently detected as clusters, and then another cluster is missed when it exists.
2.4 Diplomatic synchronization
When a region experiences, for example, progress in economic integration, events on economic cooperation are reported according to the importance of the event. Then, the diplomatic centrality within that region will be reduced in several countries at the same time. In other words, the more synchronized the diplomatic centrality is among countries within a region, the more internationally influential cooperation/conflict events are considered to be occurring in that region. Following this hypothesis, we compute the intra-regional synchronization of diplomatic centrality in order to detect and evaluate events that have developed/declined regional diplomatic relations.
The analysis of synchronization phenomena has been applied to economic phenomena outside the fields of engineering and physics; Ikeda et al. [35, 36] demonstrated the Japanese business cycle by calculating the synchronization of Indices of Industrial Production. Following their method, we estimated the phases for ASEAN-10 and seven other countries by analytic signal and calculated the order parameter.
In computing the analytic signal of country j, we used xj(m = 1, 2, …, 425), which is the standardized log return of diplomatic centrality Dj(m = 1, 2, …, 426). Then, phase θj(m) of diplomatic centrality in country j is obtained by the analytic signal zj(m) and Euler’s formula as
where
where L is the length of x(m), 425. Then, we applied Hilbert transform into Eq. 6 as
because H[sin ωt] = − cos ωt and H[cos ωt] = sin ωt.
Finally, we can obtain the order parameter for all countries and ASEAN as
where 0 < rS < 1 and ϕS mean the extent of synchronization and phase of S.
3 Results
3.1 Networks and diplomatic centrality
Initially, we charted a rank-size plot to identify network and centrality features. Figures 2A,B show the left tail and right tail of the political distance distribution for four periods of 36 years divided by 9 years. The right tails change little, but the inclination of the left tails is steeper in more recent years. In other words, the difference in political distance between countries becomes smaller. The distribution of diplomatic centrality by country over the 36-year period results in Japan being the most central, followed by China (Figures 2C,D). Those farthest from the center are, in descending order, India, New Zealand, the United States, and Australia. The inclination of the distribution for Republic of Korea and China was more gradual than for the other countries. In particular, Republic of Korea shows almost smaller diplomatic centrality than ASEAN-10 in the left tail of Figure 2C and larger than ASEAN-10 in Figure 2D. China and Republic of Korea are characterized by a wider range of diplomatic centrality values over 36 years than other countries.
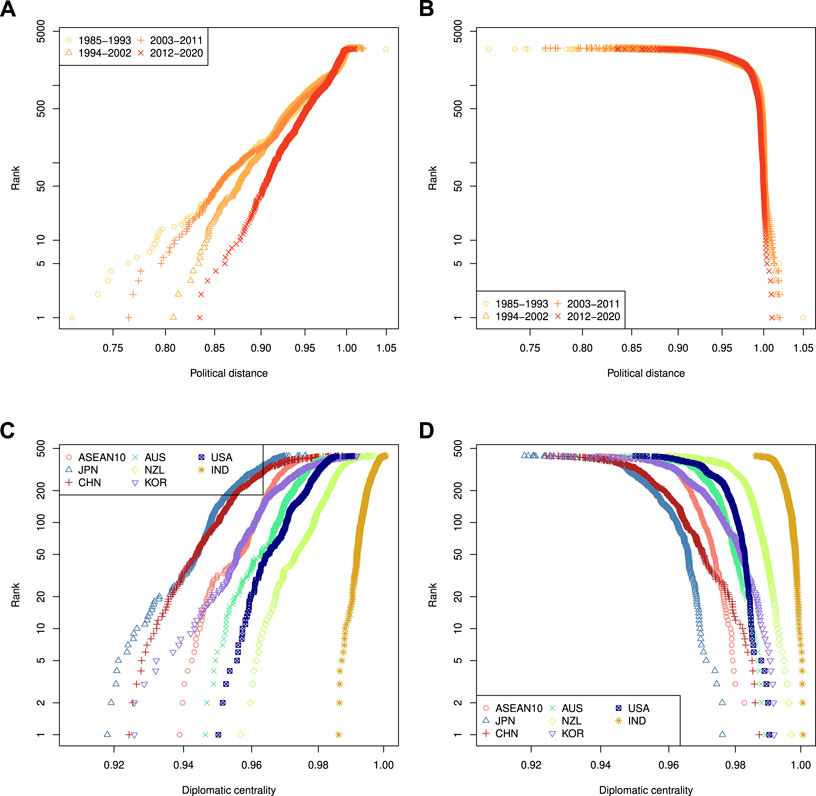
FIGURE 2. Rank-size plots. (A) and (B) are plots of bilateral political distance. (C) and (D) are plots of diplomatic centrality of each country. Rank of (B) and (D) are ascending order of rank of (A) and (C), respectively.
Figure 3 illustrates that there were four notable bottoms of the diplomatic centrality indexes from 1985 to 2020. The first bottom was in October 2003, when the diplomatic centralities of China, Japan, and Republic of Korea (CJK) bottomed at the same time. Also, at this time, the diplomatic centralities declined for all countries and regions except India. The ninth ASEAN Summit and the seventh ASEAN+3 Summit were held the month. This is followed by the second-lowest bottom of CJK’s diplomatic centrality around 2007. The CJK summit took place at this time. For the other countries, the United States is an exceptional country in the meaning that its diplomatic centrality also bottomed around 2007; Australia took even the local maximum. The third-lowest bottom of diplomatic centrality was China’s in October 1997. At this time, the United States also bottomed, as Chinese President Jiang Zemin was invited by American President William Clinton to visit the United States and issued a China-US Joint Statement. The fourth-bottom of diplomatic centrality was Japan’s in November 1989. The first APEC meeting was held in Canberra, Australia, in that month, which also marked the bottom of Australia’s diplomatic centrality.

FIGURE 3. Diplomatic centrality of ASEAN-10 and seven countries. The smaller the diplomatic centrality, the more cooperative the country is in diplomacy among the 17 countries.
3.2 Diplomatic rankings
Diplomatic rankings in Figure 4 show three major trends: 1985–1992, 1993–2011, and 2012–2020 throughout the entire period. Until 1992, Japan, ASEAN-10, and Australia were at the top of the list. Japan was almost always ranked first, but Australia was ranked first in 1987, and ASEAN-10 was frequently ranked first from 1990 to 1993. From 1994 to 2011, Japan and China occupied the top two or more positions, while the United States position gradually declined. From 2012 onward, in addition to Japan and China, ASEAN-10 was again in contention for the top position. Republic of Korea and New Zealand were also affected by these trends. Republic of Korea moved up from around seventh place at the beginning of 1993 to a ranking between third and fifth place. New Zealand followed the same trend as ASEAN-10 and Australia, falling to seventh around 1993 and continuing until around 2014, but in recent years it has competed with the United States and moved up in the rankings. It is also clear from Figures 2, 3 that India consistently remained at the bottom of the list.
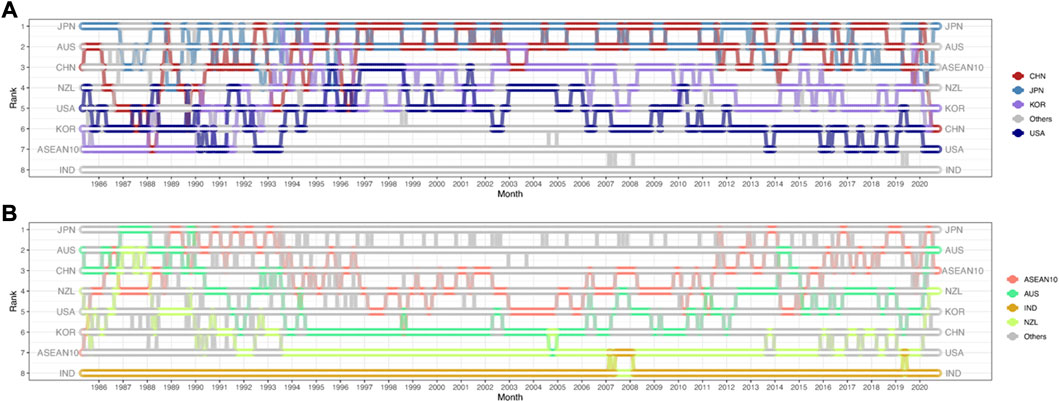
FIGURE 4. Diplomatic rankings of ASEAN-10 and seven countries. (A) is colored in China, Japan, Republic of Korea, and the United States, (B) is colored on ASEAN-10, Australia, New Zealand, India.
3.3 Diplomatic clusters
The links between two countries in the monthly signed network created from the diplomatic centrality correlations are shown in Figure 5. Figure 5A shows the monthly sign of each link, and Figure 5B shows the number of positively, negatively, and not-significantly correlated links by month. It indicates that there were many months in which more than half of the links were not significant before 2001; however, after 2003, links of positive correlation accounted for more than half of the links, and the number of positive correlation links increased.
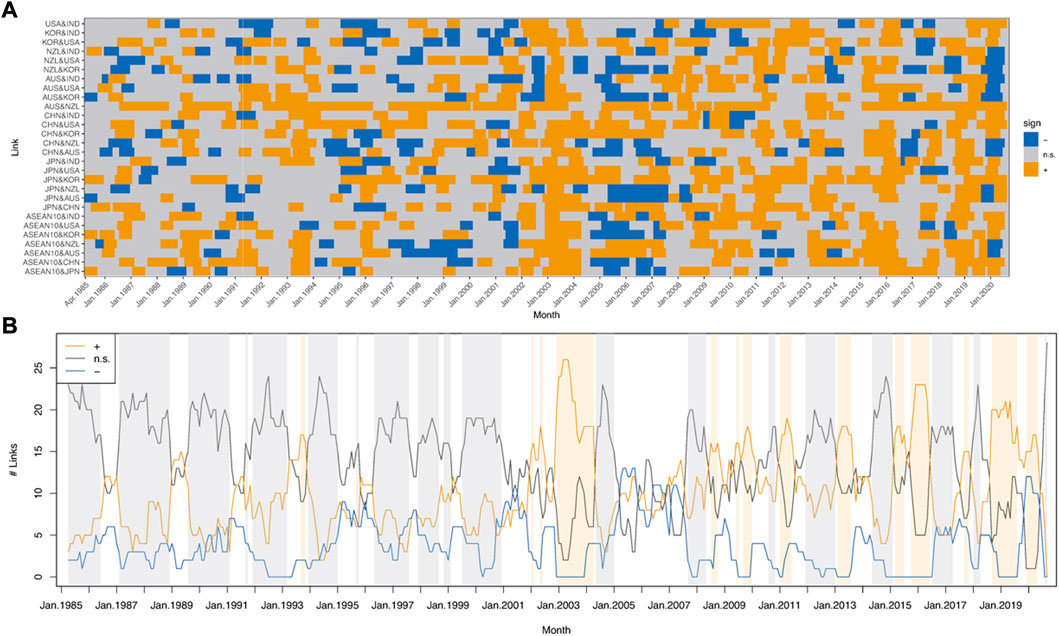
FIGURE 5. Monthly signed network. (A) is signs of links and (B) is the number of links/non-links by sign. If the percentage of links of “+” and “n.s.” in some months is more than 1/2, the background color of the terms in (B) are orange and gray, respectively. The percentage of links of “-” is less than 1/2 for all months.
In dividing the signed network as shown in Figure 5 into clusters, we examined the dependence of α on blockmodeling (Figure 6). Figure 6 shows how many nodes comprise the largest, second-largest, and third-largest clusters in heat maps A, B, and C, respectively. As described in Section 2, the number of clusters was set to 3, but in some cases, only one cluster was detected, depending on α and month. In the periods that were orange in Figure 5, there were often no multiple clusters. This is because, as shown in Eq. 4, reducing α prioritizes reducing the number of positive links between clusters, so that it is optimal not to split into clusters when positive links are in the majority. Since there tended to be more positive links than negative links over the 426-month period, the number of clusters increased as α was increased, and the size of the largest cluster (first cluster) tended to be smaller. In particular, when α was less than 0.5, the probability of the number of clusters being 1 increased in some months (e.g., the first half of 2002 and 2007–2010). Figure 6 shows that the number of clusters can be one when α is less than 0.5, and Figure 6C shows that a third cluster can be detected when α is greater than 0.5. Therefore, α = 0.75, which is greater than 0.5, was used for blockmodeling.
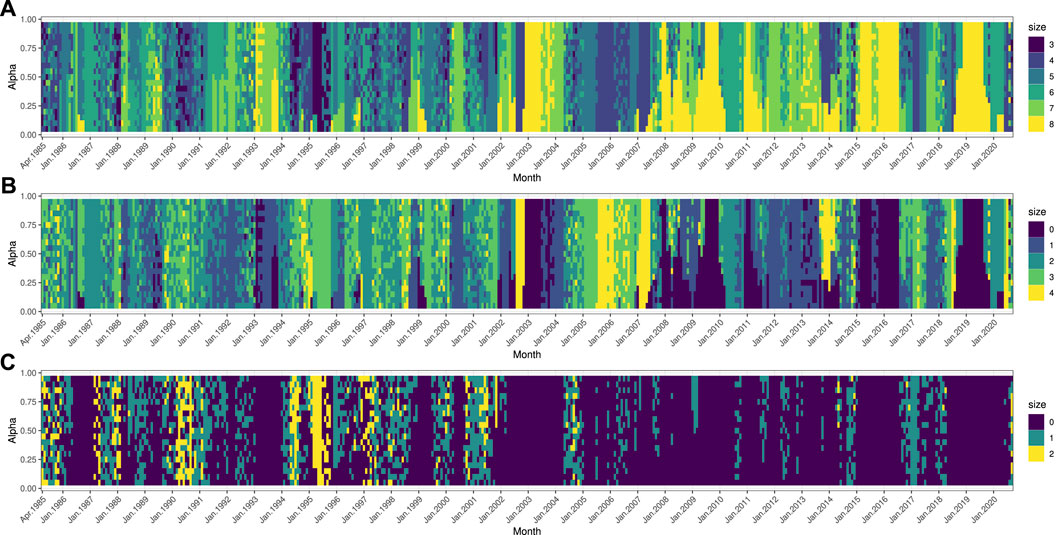
FIGURE 6. Cluster sizes of signed blockmodeling by alpha. This figure shows the results of blockmodeling with alpha varying by 0.05 from α = 0.05 to 0.95 for each month. Each cell represents the size of the cluster in color, with (A) representing the largest cluster, (B) the second largest cluster, and (C) the third largest cluster. If the second and third clusters do not exist, their size is zero.
Blockmodeling results in Figure 7 show that ASEAN-10 and the seven countries were divided into two clusters in 55.6% of all months, and 140 months out of 426 (32.9%) were divided into three clusters, of which 75.7%, or 106 months, had a cluster size of 1. There were also 49 months (11.5%) that were not divided into clusters. By numbering clusters 1–3 from the largest cluster to the third cluster, we can calculate the euclidean distance between countries. The complete linkage method, one of the methods of agglomerative hierarchical clustering, was used to calculate a dendrogram of the proximity between countries based on the cluster classification for the entire period. The closest pair in distance was then Australia and New Zealand, followed by Japan and Republic of Korea. Thereafter, China, ASEAN-10, and the United States were in close proximity to Japan and Republic of Korea, in that order, followed by the pair of Australia and New Zealand, and finally India.

FIGURE 7. Monthly results of signed blockmodeling. The cluster codes 1, 2, and 3 mean the largest, second, and smallest cluster in the month, respectively. The left dendrogram was by the complete linkage method.
3.4 Diplomatic synchronization
Finally, we present synchronization results. The diplomatic centrality of each country is represented in the complex plane by calculating the analytic signals of the diplomatic centrality in each country, as shown in Figure 8. The order parameter is calculated from the phases of these countries according to Eq. 9, and Figure 9 shows the degree of synchronization as a time series. Here, when the 6-month moving average is greater than 0.5, there is synchronization between these countries and ASEAN-10, and the period is shown in orange. It illustrates prior to 2002, seven periods were synchronized, but the synchronous periods averaged 6.125 months, while since late 2002, eight periods have been synchronized for an average of 13.78 months. Of the 273 months between April 1985 and December 2007, 27.4% were synchronized, while 62.1% of the 153 months between January 2008 and September 2020 were synchronized.
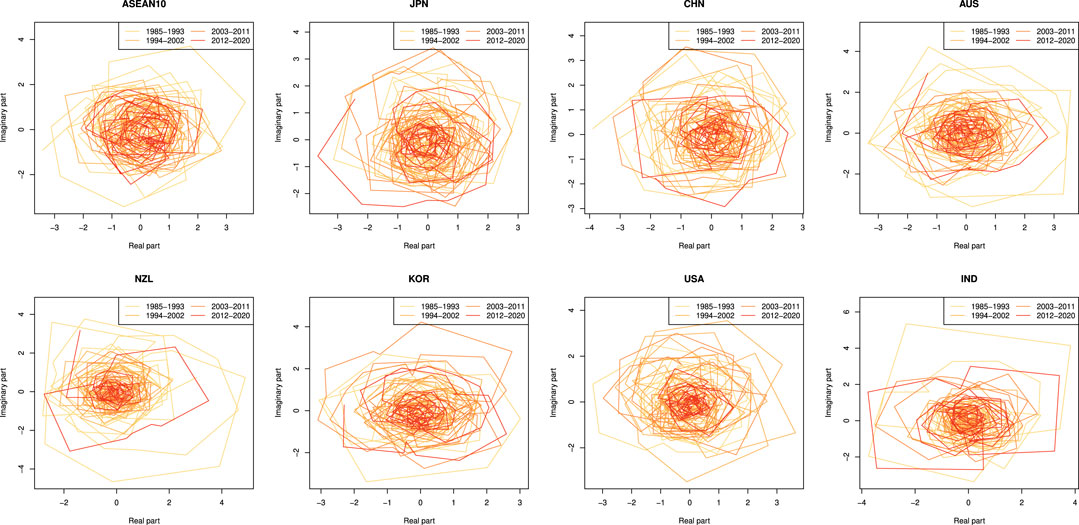
FIGURE 8. Complex planes of the analytic signals of diplomatic centrality in ASEAN-10 and seven countries.

FIGURE 9. Modulus of the order parameter of all countries. Orange-colored periods meant synchronous when the 6-month average of the order parameter was over 0.5.
The proportion of synchronous periods increased after the longest synchronous period, from September 2002 to October 2004, and the subsequent 35-month asynchronous period that lasted until September 2007. Figure 10, a part of Figure 7, shows diplomatic clusters in the 35-month asynchronous period. Although there are small variations in clustering, the division into two main groups, CJK and the United States and others, suggests that this 35-month period is asynchronous.
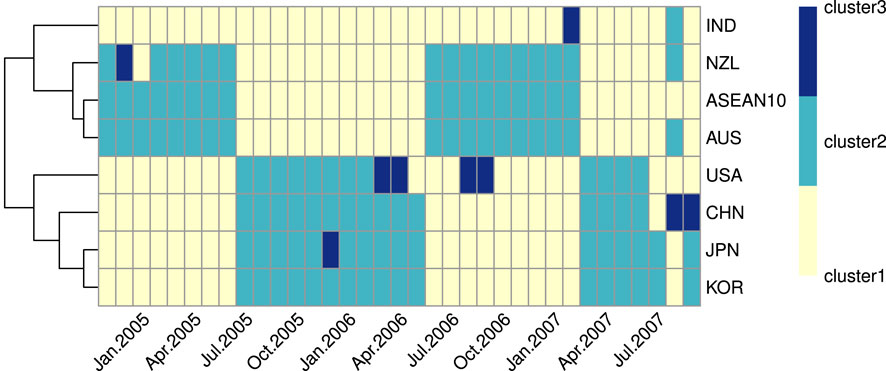
FIGURE 10. Diplomatic clusters in an asynchronous period from November 2004 to September 2007. The cluster codes 1, 2, and 3 mean the largest, second, and smallest cluster of the month, respectively. The left dendrogram was by the complete linkage method.
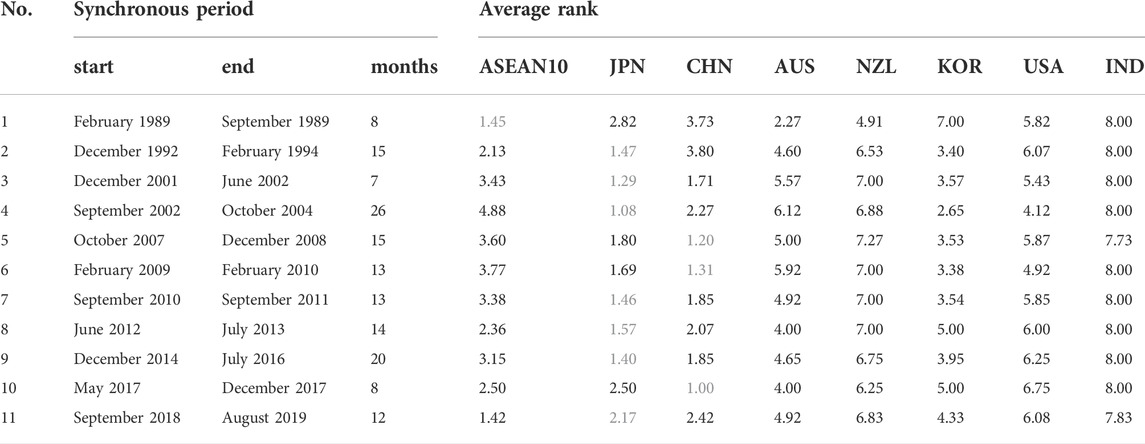
Table 3 summarizes synchronous periods with average ranks of ASEAN-10 and the countries. In the longest synchronous period (No.4 in Table 3), Japan’s average diplomatic rank is 1.04, indicating that it is leading diplomatic relations in East Asia during this period. As Figure 4 confirmed, this period included the year 2003, which had the smallest diplomatic centrality of the 36 years. It was also the period in which Asia Bond Market Initiative (ABMI) was established, the first Six-Party Talk, the ninth ASEAN Summit, and the seventh ASEAN+3 Summit were held. At the ninth ASEAN Summit, ASEAN declared to establish ASEAN Community. Meanwhile, CJK issued the Joint Declaration on the Promotion of Tripartite Cooperation after the seventh ASEAN+3 Summit, and ASEAN and Japan issued the ‘Tokyo Declaration’ which mentioned the East Asia Community. Japan also had the highest diplomatic ranking for the synchronous periods No.2, 3, and 7–9. In period No.2, the AFTA, which was declared at the 4th ASEAN Summit in January 1992, was implemented in 1993, and the first APEC Summit was held in the United States in November 1993. In period No.8, the first rounds of the negotiation on CJK FTA and the negotiation for RCEP were held; TPP was concluded and signed in period No.9.
China had the highest ranking for No.5, 6, and 10 periods. The first CJK trilateral summit was held at the end of the No.5 period. In addition, ASEAN-10 ranked the first in diplomatic ranking over Japan and China for the No.1 and No.11 synchronous periods. Overall, only Japan, China, and ASEAN-10 were in the first position for 11 synchronous periods.
4 Discussion
4.1 Characteristics and limitations of the method
Section 2.1 insisted on the rationality of using GDELT for the political event study. Still, we have to mention that our analysis relied on press-reported event data, not an assessment of actual foreign policy effects. Political distances and diplomatic centrality were calculated based solely on the granularity of media coverage, i.e., information available to the general public. Diplomatic centrality does not indicate the extent to which they were central in the field of diplomacy, but rather the extent to which they were actively engaged in, or reportedly engaged in, diplomatic cooperation in the region.
As noted in Section 2.1, the data analyzed in this study (GDELT 1.0) is based on information reported in English and therefore has an English bias. In other words, Japan, which is closer to the position of the West, may be classified as more optimistic about events than China. In addition, the amount of information available had changed significantly over the past 36 years (especially with the development of the Internet), so the trends may be different before the early 2000s and after 2010.
We analyzed the political distance network of eight nodes, including 17 countries, with the 10 AMS as one node. As explained in Section 2.2, the reasons were the small number of events in AMS and to remove the effects of disputes within them. Consequently, we discounted their diversity though they also uniquely concluded bilateral agreements without the auspices of ASEAN (e.g. US-Singapore FTA). However, our analysis included events of these agreements between an ASEAN member state and a non-ASEAN state as events between ASEAN-10 and the country. Any analysis that includes political distances within AMS would need to gather event information in the language of each country. In our case, the paucity of event data on AMS was compensated for by considering all member states as one entity.
Moreover, there are limitations in analyzing individual measures for economic integration. While we cited RCEP and TPP as specific examples of economic integration, GDELT 1.0 does not distinguish between these agreements. Figure 11 shows the evolution of the annual percentages of the four events related to economic integration as classified by CAMEO, which is the limit this study can identify. Analyzing RCEP and TPP negotiation events separately is not possible in GDELT 1.0; it is necessary to use texts and articles containing specific words (i.e., RCEP and TPP) rather than data classified by CAMEO. Therefore, this study analyzed all events converted to the Goldstein scales without distinguishing between measures to progress economic integration, and the scope of the study did not include an analysis of each agreement or policy.
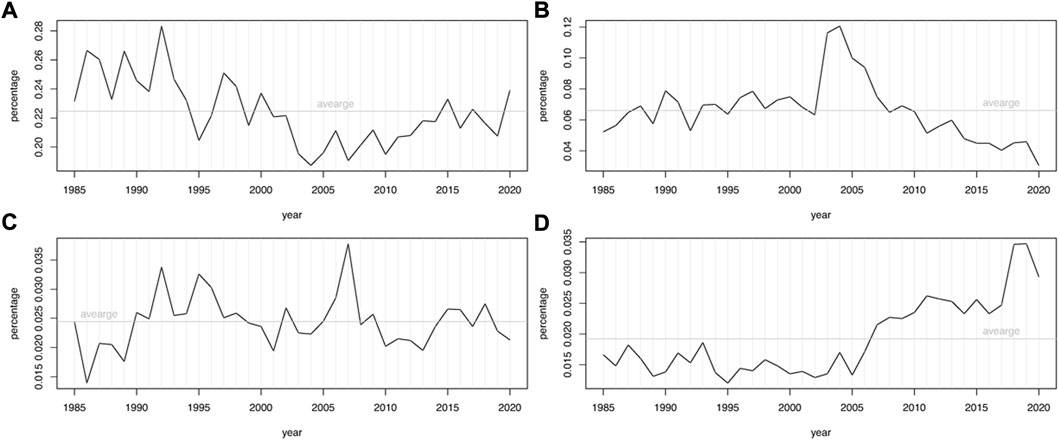
FIGURE 11. Annual event percentages of four types: (A) “make/host a visit,” (B) “engage in negotiation,” (C) “sign formal agreement,” and (D) “cooperate economically.” The event types were identified by CAMEO.
A major limitation of our study is the inability to elucidate the political mechanisms of diplomatic phenomena. However, by applying network science and physics methods to event data, our study provided a quantitative approach to observing multilateral relations. The analysis of complex relationships, such as multilateral relationships, could be unintentionally arbitrary. We augmented the findings of qualitative studies that answer the Why with data-driven research. The next Subsection discusses how the results of the diplomatic centrality analysis are similar to the leading position in regional integration as described in international relations theory, which has been discussed so far by collecting answers to the Why and How.
4.2 Implications from the analysis
The results of the previous section showed the high diplomatic ranking of Japan, China, and ASEAN-10 and the potential for quantitative understanding of cooperative multilateral diplomacy through the observation of diplomatic synchronization. Therefore, this section discusses the results of this study, citing previous studies and specific examples.
4.2.1 Diplomatic centralities of Japan, China, and ASEAN
Our analysis quantitatively demonstrated that Japan’s contribution to East Asian diplomatic relations was significant over a period of 36 years. Japan has been overtaken by China in GDP since 2010 and was about one-third of China’s GDP in 2020 [37], but still competes with China for first place in East Asian diplomatic centrality. It is because Japan contributed to developing the regional production networks [38, 39] and promoted institutional building in Asia in the 21st Century [40].
On the one hand, China has been as influential in East Asia as Japan, especially since 1997, when it repeatedly ranked first in the diplomatic rankings. It is consistent with the growing Chinese role together with other East Asian countries after the Asian financial crisis in 1997 [41, 42]. On the other hand, other countries in East Asia did not align much during the period when China had the highest diplomatic ranking. For the percentage of times it ranked first in the region, it lagged far behind Japan in diplomatic ranking during the synchronous period. This result may suggest that from a security standpoint Japan can be aligned when its diplomatic rank is high, but not with China.
ASEAN-10 had increased its diplomatic ranks from 1989 to 93 and after 2012; in addition, ASEAN-10 was the center of East Asian diplomacy in two synchronous periods, tying with China in the number of times, whereas in most periods it had a lower diplomatic ranking than China. During the 1989–1993 period, ASEAN was central to the development of APEC [43] and declared the formation of the AFTA in 1992 [3]. 1993 was also the year of the publication of the World Bank report that called the rapid economic growth of East Asia between 1965 and 1990 the East Asian Miracle [44]. The period after 2012, when ASEAN’s diplomatic ranking rose, coincided with the period when the establishment of the ASEAN Community [45] made East Asian regional integration a reality and when ASEAN centrality drove the negotiation and conclusion of RCEP [46, 47].
4.2.2 Synchronized cooperative diplomacy
In the 36 years since 1985, East Asian diplomacy was most synchronized in 2003. 2003 was a year of significant progress in cooperation among ASEAN, ASEAN+3, and CJK. First, in May 2003, the ABMI was agreed upon at the ASEAN+3 Finance Ministers Meeting, one of the important ongoing forums of the ministerial level [48]. Efforts to foster the local bond market in the Asian region in reflection of the Asian financial crisis contributed to institutionalizing the ASEAN+3 framework and bringing these countries together in a way that excluded the United States [49]. Second, in August 2003, the Six-Party Talks were held on the North Korean nuclear issue. At that time, China assumed the chairmanship of the Six-Party Talks and fulfilled its responsibility for the security of East Asia. China became the second non-ASEAN member of the Treaty of Amity and Cooperation in Southeast Asia (TAC) with India. Through the ASEAN Regional Forum (ARF) and ASEAN+3, China seemed to support the ASEAN-driven multilateral security community [50, 51]. In October, the ninth ASEAN Summit was held in Bali, Indonesia, and the Declaration of ASEAN Concord II (Bali Concord II) was issued, which called for the creation of an ASEAN Community by 2020 [52]. It was a symbolic moment that ASEAN promoted the integration itself and strengthened the relationship with its external partners [53]. In December, the Tokyo Declaration was issued at the ASEAN-Japan Commemorative Summit Meeting [54], which called for deepening cooperation in East Asia to create the East Asian Community. Japan also declared its intention to negotiate accession to the TAC at the meeting.
The recent trend toward regional economic partnerships such as TPP and RCEP may be reflected in the lengthening of the synchronous period. Interestingly, the trend began during the Global Financial Crisis of 2008–2009. During the crisis, China and other emerging countries increased their international presence through international forums (such as the G20 and BRICS summit, International Monetary Fund (IMF), and World Bank) [55]. This is consistent with the ranking of China in Table 3. During that period, the United States announced its participation in the Trans-Pacific Strategic Economic Partnership Agreement (TPSEP), the original agreement of the TPP which is the piece of United States rebalancing to the Asia-Pacific region [56], and the United States joined the TAC in 2009 and East Asia Summit (EAS) in 2011. In 2012, ASEAN began negotiations for RCEP with original EAS member countries (ASEAN+6), which has each bilateral FTA with ASEAN. RCEP participating countries have agreed that RCEP will affirm the principle of “ASEAN centrality” in Asian regionalism [57]. The ASEAN-centered institutional building has been promoted, such as the ASEAN Defense Ministers’ Meeting Plus in 2010, the Chiang Mai Initiative Multilateralization (CMIM) and the establishment of the ASEAN Plus Three Macroeconomic Research Office (AMRO) in 2011, and the establishment of ASEAN Plus Three Emergency Rice Reserve (APTERR) in 2011, in line with the ASEAN Community Building.
As described above, the period during which our analysis identified diplomatic synchronization was a period when cooperative multilateral diplomacy was gaining momentum in East Asia. Thus, the negotiations and formations of the ASEAN Community, a manifestation of regionalism, may be observed as a synchronous phenomenon of diplomatic centrality.
Furthermore, the years in which economic integration in the Asia-Pacific region was more advanced than in Europe were 2010 and 2013–2014 [16], the years after 2008, when the synchronization became more active. While economic integration was more than in Europe because of the decline in the extent of European economic integration after the crisis, the Asia-Pacific region was steadily increasing its economic integration. Earlier studies also pointed out that while Europe faced serious problems such as the debt and euro crises, the ASEAN and East Asian regions recovered more quickly than Europe after the Global Financial Crisis and advanced economic integration [45, 58]. While economic integration has deepened in East Asia after the Global Financial Crisis, there has also been competition between Japan and China in infrastructure development in the region [59, 60]. The results of this study supported that regionalism in East Asia has been evident, especially since 2008.
4.3 Significance and applicability of the study
We have shown that it is possible to analyze not only bilateral relations by calculating political distances from event data, but also multilateral international relations. Diplomatic centrality made it possible to compare diplomatic cooperation stances in the region over time or internationally. We showed that diplomatic clustering divided countries into groups based on their time-series correlations and that changes in the centrality can be viewed as an analytic signal and the degree of synchronization can be calculated to capture regional diplomatic movements.
GDELT and other event data are freely available, and anyone can apply the methodology of this study to any combination of countries such as APEC, European Union (EU), and North American Free Trade Agreement (NAFTA) members. The content of the data handled in this study was limited due to the long period of time covered by the analysis, but if we focus on more recent years, non-English languages will be included, and we can analyze with less bias. We can also compare how we perceive diplomacy in different reporting languages and media by, for example, analyzing political distance and diplomatic centrality in different languages and media.
Finally, we discuss what our study can contribute. The ability to quantitatively measure multilateral diplomatic relations is helpful in reviewing diplomatic events that have occurred in the region. Events that can be interpreted in multiple ways over various histories occur daily, and it is difficult to understand even bilateral relations alone without being biased toward one point of view. Therefore, it is important to have an objective way to assess the state of diplomatic relations. Having quantitatively stated criteria allows us to begin the discussion from those criteria.
5 Conclusion
We created a political distance network consisting of the ASEAN+6 and the United States for the period 1985–2020 using GDELT, which classifies and records events around the world from the news. We defined diplomatic centrality from the network and analyzed it from three perspectives: rankings, clustering, and synchronization.
Diplomatic rankings showed that Japan had contributed significantly to East Asian multilateral diplomacy over the entire period, China had contributed alongside Japan since 1997, and ASEAN-10 had contributed alongside Japan and China in 1989–1993, from late 2011 to early 2014, and from 2016. Diplomatic clusters illustrated that the diplomatic stances of New Zealand and Australia were closest in any period, and in about 36 years, the diplomatic stances of CJK, ASEAN-10, and the United States were close in that order. Diplomatic synchronization quantified East Asian regionalism which has appeared frequently since 2008. Negotiations and formations of ASEAN Community and Mega-regional FTAs (e.g., TPP and RCEP), a manifestation of regionalism, may be observed as a synchronous phenomenon of diplomatic centrality.
The results of our analysis are consistent with various previous studies and political facts, and demonstrate the progress of East Asian economic integration in recent years. Our research proposes a data-based method of analyzing multilateral diplomacy by applying network science and physics. It allows case studies to be augmented with quantitative evidence, making complex international relations more accessible to a wider audience.
Data availability statement
Publicly available datasets were analyzed in this study. This data can be found here: http://data.gdeltproject.org/events/index.html.
Author contributions
SS and YI contributed to conception of the study. SS, KO, and FI contributed design of the study. SS performed the analysis and visualization. KO and YI supervised the analysis. SS wrote the first draft and sections of the manuscript. KO wrote parts of the introduction, data and methods, and results sections, and FI wrote parts of the introduction and discussion sections of the manuscript. All authors contributed to manuscript revision, read, and approved the submitted version.
Funding
This work was supported by JST SPRING, Grant Number JPMJSP2110.
Conflict of interest
The authors declare that the research was conducted in the absence of any commercial or financial relationships that could be construed as a potential conflict of interest.
Publisher’s note
All claims expressed in this article are solely those of the authors and do not necessarily represent those of their affiliated organizations, or those of the publisher, the editors and the reviewers. Any product that may be evaluated in this article, or claim that may be made by its manufacturer, is not guaranteed or endorsed by the publisher.
Footnotes
1FTA negotiations-related events include two kinds of the bilateral events: One was “engaging in negotiation” event for all meetings; the other was “signing formal agreement” event for the five meetings of/after the third RCEP Summit.
2GDELT possibly records one specific event as multiple events because it regards the same event in two (or more) different date articles as two (or more) different events. It is natural that there were several different date articles regarding one RCEP event. Thus, we aggregate the events by month.
References
1. Oba M. TPP, RCEP, and FTAAP: Mulitlayered regional economic integration and international relations. Asia-Pacific Rev (2016) 23:100–14. doi:10.1080/13439006.2016.1195957
2. Mansfield ED, Milner HV. The new wave of regionalism. Int Organ (1999) 53:589–627. doi:10.1162/002081899551002
3. Wilson JD. Fourth ASEAN summit Singapore, 27–28 january 1992: Singapore declaration of 1992. ASEAN Econ Bull (1992) 8:376–81.
4. Börzel TA, Risse T. The Oxford handbook of comparative regionalism Oxford, United Kingdom: Oxford University Press (2016).
5. Haas EB. International integration: The European and the universal process. Int Organ (1961) 15:366–92. doi:10.1017/s0020818300002198
6. Keohane RO, Nye JS. Power and interdependence: World politics in transition. Little Brown & Co. (1977).
8. Baldwin R. Domino theory of regionalism. In: R Baldwin, P Haapararanta, and J Kiander, editors. Expanding membership of the European union. Cambridge University Press (1995).
9. Christensen TJ. Fostering stability or creating a monster? The rise of China and US policy toward east Asia. Int Security (2006) 31:81–126. doi:10.1162/isec.2006.31.1.81
10. Dent CM. China, Japan and regional leadership in East Asia. Cheltenham, United Kingdom: Edward Elgar Publishing (2010).
11. Nabers D. Power, leadership, and hegemony in international politics: The case of East Asia. Rev Int Stud (2010) 36:931–49. doi:10.1017/s0260210510001373
12. Sukegawa S. ASEAN’s initiatives for free trade in East Asia under AEC. J Contemp East Asia Stud (2021) 10:42–64. doi:10.1080/24761028.2021.1902068
14. Hafner-Burton EM, Kahler M, Montgomery AH. Network analysis for international relations. Int Organ (2009) 63:559–92. doi:10.1017/s0020818309090195
15. Ikeda Y, Iyetomi H, Mizuno T. Big data analysis on global community formation and isolation. Springer (2021).
16. Sada S, Ikeda Y. Regional economic integration via detection of circular flow in international value-added network. PLOS ONE (2021) 16:e0255698–28. doi:10.1371/journal.pone.0255698
17. Sada S, Ikeda Y. Regional and sectoral change of global value-added network around the 2009 economic crisis. In: Y Ikeda, H Iyetomi, and T Mizuno, editors. Big data analysis on global community formation and isolation. Springer (2021). p. 217–47.
18. Leetaru K, Schrodt PA. Gdelt: Global data on events, location, and tone. ISA Annu convention (Citeseer) (2013) 2:1–49.
19. Boschee E, Lautenschlager J, O’Brien S, Shellman S, Starz J, Ward M. ICEWS coded event data (2015). doi:10.7910/DVN/28075
21. Maoz Z, Johnson PL, Kaplan J, Ogunkoya F, Shreve AP. The dyadic militarized interstate disputes (MIDs) dataset version 3.0: Logic, characteristics, and comparisons to alternative datasets. J Conflict Resolution (2019) 63:811–35. doi:10.1177/0022002718784158
22. Campante F, Yanagizawa-Drott D. Long-range growth: Economic development in the global network of air links. Q J Econ (2018) 133:1395–458. doi:10.1093/qje/qjx050
23. Zhang C, Xiao C, Liu H. Spatial big data analysis of political risks along the Belt and Road. Sustainability (2019) 11:2216. doi:10.3390/su11082216
24. Voukelatou V, Miliou I, Giannotti F, Pappalardo L. Understanding peace through the world news. EPJ Data Sci (2022) 11:2. doi:10.1140/epjds/s13688-022-00315-z
25. Ferreira LN, Hong I, Rutherford A, Cebrian M. The small-world network of global protests. Sci Rep (2021) 11:19215–8. doi:10.1038/s41598-021-98628-y
26. Davis CL, Meunier S. Business as usual? Economic responses to political tensions. Am J Polit Sci (2011) 55:628–46. doi:10.1111/j.1540-5907.2010.00507.x
27. Davis CL, Fuchs A, Johnson K. State control and the effects of foreign relations on bilateral trade. J Conflict Resolution (2019) 63:405–38. doi:10.1177/0022002717739087
28. Chen Q, Zhou Y. Whose trade follows the flag? Institutional constraints and economic responses to bilateral relations. J Peace Res (2021) 58:1207–23. doi:10.1177/0022343321992825
29. Hardwick S, Armstrong S. The effects of institutions on the relationship between politics and trade. Tokyo, Japan: The Research Institute of Economy, Trade and Industry (2022).
30. Agarwal V, Golley J. Do political relations affect exports to China? Evidence from the ‘quad’. New York City, United States: John Wiley & Sons (2022).
31. Goldstein JS. A conflict-cooperation scale for WEIS events data. J Conflict Resolution (1992) 36:369–85. doi:10.1177/0022002792036002007
32. Schrodt PA. Conflict and mediation event observations event and actor codebook version 1.1b3 (2012).
33.Ministry of Foreign Affairs of Japan. Regional comprehensive economic partnership (RCEP) agreement (2012). Available at: https://www.mofa.go.jp/policy/economy/page2e_000001.html (Accessed on September 09, 2022).
34. Doreian P, Mrvar A. A partitioning approach to structural balance. Social Networks (1996) 18:149–68. doi:10.1016/0378-8733(95)00259-6
35. Ikeda Y, Aoyama H, Fujiwara Y, Iyetomi H, Ogimoto K, Souma W, et al. Coupled oscillator model of the business cycle with fluctuating goods markets. Prog Theor Phys Suppl (2012) 194:111–21. doi:10.1143/ptps.194.111
36. Ikeda Y, Aoyama H, Iyetomi H, Yoshikawa H. Direct evidence for synchronization in Japanese business cycles. Evolut Inst Econ Rev (2013) 10:315–27. doi:10.14441/eier.a2013016
37. Bank TW. GDP (current US$) - China (2022). Japan. Available at: https://data.worldbank.org/indicator/NY.GDP.MKTP.CD?end=2021&locations=CN-JP&start=1985 (Accessed on September 14, 2022).
38. Yamamura K, Hatch W. A looming entry barrier: Japan’s production networks in Asia, 8. Seattle, United States: National Bureau of Asian Research (1997).
39. Kimura F. International production networks and economic diplomacy in Japan. The Political Economy of Japanese Trade Policy. Springer (2015). p. 175–95.
40. Katada SN. Japan’s new regional reality: Geoeconomic strategy in the Asia-Pacific. Columbia University Press (2020).
43. Stubbs R. ASEAN’s leadership in East asian region-building: Strength in weakness. Pac Rev (2014) 27:523–41. doi:10.1080/09512748.2014.924229
44. Birdsall NM, Campos JEL, Kim CS, Corden WM, MacDonald L, Pack H, et al. the East asian miracle : Economic growth and public policy : Main report (English). Washington, DC, United States: The World Bank (1993).
45. Shimizu K. The ASEAN Economic Community and the RCEP in the world economy. J Contemp East Asia Stud (2021) 10:1–23. doi:10.1080/24761028.2021.1907881
46. Fukunaga Y. ASEAN’s leadership in the regional comprehensive economic partnership. Asia Pac Pol Stud (2015) 2:103–15. doi:10.1002/app5.59
47. Ye M. China and competing cooperation in asia-pacific: TPP, RCEP, and the new silk road. Asian Security (2015) 11:206–24. doi:10.1080/14799855.2015.1109509
48. Padoa-Schioppa T. Regional economic integration in a global framework. In: J McKay, MO Armengol, and G Pineau, editors. Regional economic integration in A global framework. European Central Bank (2005). p. 27–34.
49. Lee B, Lee YW. Experience, communication, and collective action: Financial autonomy and capital market development in East Asia. New Polit Economy (2021) 27:731–53. doi:10.1080/13563467.2021.2013789
50. Jones DM, Smith ML. Making process, not progress: ASEAN and the evolving east Asian regional order. Int Security (2007) 32:148–84. doi:10.1162/isec.2007.32.1.148
51. Van Ness P. Designing a mechanism for multilateral security cooperation in Northeast Asia. Asian Perspective (2008) 32:107–26. doi:10.1353/apr.2008.0006
52. ASEAN . Declaration of ASEAN Concord II (Bali Concord II) (2003). Available from: https://asean.org/speechandstatement/declaration-of-asean-concord-ii-bali-concord-ii/ (Accessed 12, September 2022).
53. Oba M. Asia as a multi-layered region. In: Search for Co-existence in conflicts. Japanese: Yuhikaku (2014).
54.Ministry of Foreign Affairs of Japan. Tokyo Declaration for the dynamic and enduring Japan-ASEAN partnership in the new millennium (2003). Available at: https://www.mofa.go.jp/region/asia-paci/asean/year2003/summit/tokyo_dec.pdf (Accessed on September 12, 2022).
55. Katada SN. In pursuit of stability: Evolution of asia’s regional financial architecture. Pac Rev (2017) 30:910–22. doi:10.1080/09512748.2017.1307873
56. Donilon T. The United States and the asia-pacific in 2013 (2022). Available at: https://obamawhitehouse.archives.gov/the-press-office/2013/03/11/remarks-tom-donilon-national-security-advisor-president-united-states-an (Accessed on September 12, 2022).
57. Wilson JD. Mega-regional trade deals in the asia-pacific: Choosing between the TPP and RCEP? J Contemp Asia (2015) 45:345–53. doi:10.1080/00472336.2014.956138
58. Ishikawa K. The ASEAN Economic Community and ASEAN economic integration. J Contemp East Asia Stud (2021) 10:24–41. doi:10.1080/24761028.2021.1891702
59. Yoshimatsu H. New dynamics in Sino-Japanese rivalry: Sustaining infrastructure development in Asia. J Contemp China (2018) 27:719–34. doi:10.1080/10670564.2018.1458059
Keywords: network analysis, political distance, diplomatic centrality, RCEP, GDELT, signed network, ASEAN community, synchronization
Citation: Sada S, Oikawa K, Iwasaki F and Ikeda Y (2022) International cooperation analysis of Asian political distance network constructed using event data. Front. Phys. 10:1007796. doi: 10.3389/fphy.2022.1007796
Received: 30 July 2022; Accepted: 20 September 2022;
Published: 13 October 2022.
Edited by:
Bikas K Chakrabarti, Saha Institute of Nuclear Physics (SINP), IndiaReviewed by:
Arnab Chatterjee, Tata Consultancy Services, IndiaSiew Ann Cheong, Nanyang Technological University, Singapore
Copyright © 2022 Sada, Oikawa, Iwasaki and Ikeda. This is an open-access article distributed under the terms of the Creative Commons Attribution License (CC BY). The use, distribution or reproduction in other forums is permitted, provided the original author(s) and the copyright owner(s) are credited and that the original publication in this journal is cited, in accordance with accepted academic practice. No use, distribution or reproduction is permitted which does not comply with these terms.
*Correspondence: Sotaro Sada, c2FkYS5zb3Rhcm8uODdhQGt5b3RvLXUuanA=
 Sotaro Sada
 Keita Oikawa
 Fusanori Iwasaki
 Yuichi Ikeda