 T. V. Sachin Krishnan
 P. B. Sunil Kumar
94% of researchers rate our articles as excellent or good
Learn more about the work of our research integrity team to safeguard the quality of each article we publish.
Find out more
ORIGINAL RESEARCH article
Front. Phys., 28 September 2022
Sec. Biophysics
Volume 10 - 2022 | https://doi.org/10.3389/fphy.2022.1003558
Membranes of organelles in the intracellular trafficking pathway continuously undergo recycling through fission and fusion processes. The effect of these recycling processes on the large-scale morphology of organelles is not well understood. Using a dynamically triangulated surface model, we developed a membrane morphology simulator that allows for membrane trafficking, and analyzed the steady state shape of vesicles subjected to such active remodeling. We study a two-component vesicle composed of 1) active species which can have nonzero spontaneous curvature and participate in the recycling and 2) inactive species which do not participate in the recycling. We obtain a plethora of steady state morphologies as a function of the activity rate, spontaneous curvature, and the strength of interaction between species. We observe that morphology changes, as a function of rate of activity, are diametrically opposite for the two signs of the spontaneous curvature, but only have a weak effect on its magnitude. The interplay between the in-plane diffusion, the activity rate, and the spontaneous curvature are shown to determine the vesicle morphology at the steady state. It is shown that the spontaneous curvature and activity inhibits the formation of clusters of active species on the surface. We carry out linear stability analysis of a continuum model and show that the spherical shape of a vesicle is indeed unstable when subjected to active membrane recycling above a certain activity rate.
Organelle membranes exhibit a wide variety of morphologies that are believed to be crucial for their function [1–3]. While peroxysomes and lysosomes are spherical, the endoplasmic reticulum (ER) has sheet-like and tube-like regions [4]. Adjacent sheets of the rough ER are connected through parking-garage like structures called “Terasaki spiral ramps” [5]. The Golgi apparatus consists of flattened membrane compartments called the cisternae and the mitochondria is made of an outer membrane and a highly convoluted inner membrane. There are a number of structural motifs that are commonly observed in these organelle membranes such as sheets, tubules, or interconnected networks [6, 7]. The dimensions of such features have managed to remain conserved throughout evolution. For instance, the diameter of the tubules in the cristae junction of the inner mitochondrial membrane are strictly maintained at 28 nms [7]. To know the functional organization within a cell, it is essential to understand the mechanisms that are responsible for generation and maintenance of organelle morphologies. Together with the fact that organelles dissolve and reassemble to take nearly the same structure during each cell cycle suggests that the generation and stabilization of organelle morphology is the product of a concerted effort. Although there are several molecular players and complex feedback loops involved in the processes of organelle morphogenesis, it is possible that these process can be understood in terms of a few self-organizing principles [8–10].
Different models and mechanisms, that can spontaneously generate such complex shapes have been proposed [6, 7, 11, 12]. One such mechanism, which is specially relevant for the organelle membranes in the membrane trafficking pathway, is the regulated rates of fission and fusion of vesicles. This mechanism is reported to be a crucial factor for maintaining the morphology and composition of these organelles [13]. This process of fission and fusion are active in the sense that they require external energy input through hydrolysis of ATP/GTP and are assisted by special proteins such as SNAREs [14]. It is accepted that such active recycling of essential proteins and lipids are imperative to maintain the composition and function of the membranes. However, an understanding of the effect of such active processes on the morphology and organisation of organelle membranes is still lacking.
In a planar membrane subjected to active deposition and evaporation of membrane materials, it was found that the activity can result in a dynamical instability resulting in long tubular shapes of the membrane [15]. Ramakrishnan et al. [16] studied the spontaneous morphological changes of a vesicle under adsorption and desorption of active curvature modifying agents. It was seen that spontaneous curvature fluctuations can lead to shape transitions through an activity-dependent tension. On a similar line, Goutaland et al. explored the stability of a free standing membrane subjected to active and thermal spontaneous curvature fluctuations induced by binding/unbinding of curvature active components [17]. Both these models however do not consider actual area changes of the membrane due to deposition and evaporation or binding and unbinding of curvature active agents. Another recent work investigates the role of nonequilibrium recycling involving actual material exchange on the conformations of 1D active polymer models [18].
In a work that is closely related to what is presented here Tachikawa and Mochizuki carried out coarse-grained simulations that capture the reassembly of Golgi apparatus as a result of vesicle aggregation, fusion, and membrane shape relaxation [19]. While their work is focused on reproducing the shape of Golgi, our emphasis is on understanding the steady states shapes that results from energy consuming transport of membrane components and curvature modifying agents.
In-plane organisation of membrane components, that are curvature active, can have significant effect on the morphology of the membrane. Coarsening dynamics and domain size distributions of membrane domains undergoing active recycling is investigated in Ref. [20]. It was shown that active stresses in a thin sheet, that depend on the concentration of a stress-regulating molecular species which are dynamically changing in response to flows on and deformations of the surface, can result in spontaneous generation of nontrivial surface shapes and shape oscillations [21]. Another factor that can contribute to the morphology of a vesicle is the rate of growth of volume relative to that of area, which was addressed recently [22].
In contrast, to the above mentioned works, the work presented in this paper addresses the question of the morphology of vesicles, with continuous flux of materials into and out of its surface, at the steady state. We explore the effects of fluctuations in local density and spontaneous curvature using a new method based on Dynamical Triangulation Monte Carlo (DTMC) and local density based potentials. DTMC is a useful technique to explore the non-axisymmetric shapes of membranes which are analytically intractable [23]. Here, we introduce a modified DTMC method, that now allows for addition and removal of membrane material, and explore the steady-state morphology of the vesicle as a function of material addition and removal rates. Here, the recycling of membrane material is considered as an active (energy consuming) process. We observe that such nonequilibrium processes lead to shape instabilities when material exchange is coupled to local membrane curvature.
The vesicle is represented by an infinitely thin triangulated surface where each triangle represents a patch of lipid bilayer. The length unit of the simulation is set by the diameter of the vertex beads. The configuration of the system is specified by the number of vertices, their position vectors
Here, lij is the distance between the two vertices located at Ri and Rj, σij is the length of the bond in the dual lattice, σi is the area of the dual cell of vertex i. In Eq. 1, j(i) denotes all vertices j that are neighbors of vertex i.
The equilibrium dynamics of the membrane is simulated using the vertex displacement and bond flip MC moves, which respectively captures the local radial fluctuations and the in-plane lipid diffusion. More details about the DTMC technique is available in Refs. [23, 24]. The process of fusion of a smaller vesicle is considered to add more membrane material (lipids and proteins). For the large vesicle, the process of fusion essentially increases its area. Similarly, the process of fission removes a small amount of area from the vesicle. In simulations, the addition and removal of area from the vesicle is captured with the help of MC moves for addition and removal of a vertex respectively. The conventional DTMC method has a restriction on the length of the tether connecting neighboring vertices. In order to introduce vertex addition and removal MC moves, we need to relax this restriction on the maximum length of the tether. We use a local density based attractive interaction potential between the vertices to keep the triangulated surface intact [25]. The local density at each vertex is defined using,
where the fcut is a cutoff function defined as
with n = 12, rcut = 2.1, rhalf = 1.8,
where ρ* = 8 is taken as the preferred local density and ϵ = 6 is used for the strength of the potential. The two parameters of the attractive potential, ϵ and ρ* was chosen such that simulations reproduce the edge length and coordination number distributions similar to those obtained using the tether potential (Figures 1A,B). The last term in Eq. 5 allows for interaction between the species on the surface. Here, ϕi denotes the nature of the species occupying the vertex; ϕi = 1 indicates that an active species occupies vertex i and ϕi = 0 indicates that a passive species is occupying vertex i. The interaction is attractive if J > 0 and repulsive otherwise.
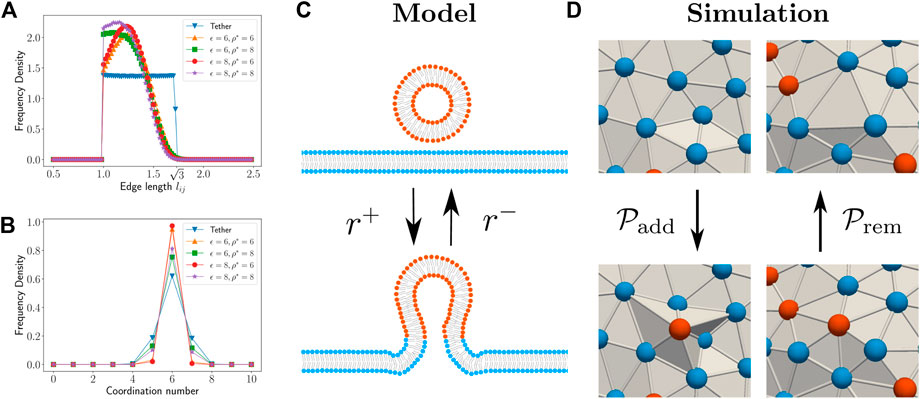
FIGURE 1. The histogram for edge length (A) and coordination number (B) distribution for different parameter choices for the local density based potential in our modified DTMC technique. The histograms for the conventional DTMC technique is shown as “Tether” for comparison. (C) Schematic representation of fission/fusion process in our model. The fission/fusion process takes place with rates r−/r+ respectively. (D) Schematic showing the local configurational changes during vertex addition and removal MC moves in the simulation.
We assume that the fission and fusion processes are actively assisted by and happens only with the help of protein machineries that are present on the smaller vesicle. In simulations, the presence of the protein machinery is taken into account by tagging a vertex as active. Thus, a two component membrane is considered by tagging each vertex as either active or passive to indicate two types of species. Since the protein machinery residing on the small vesicle can also induce membrane curvature, the active species is assigned a preferred curvature Cp. On the other hand, the passive species is assumed to have no preferred curvature. The equilibrium dynamics of the membrane is simulated using the vertex displacement, edge flip, and protein diffusion MC moves. To simulate active processes of fusion and fission, we introduce two new MC moves—vertex addition and vertex removal respectively (Figure 1D). Addition of a vertex to the triangulated surface is considered here as equivalent to fusion of a small vesicle to a large membrane surface. Since the typical size of transport vesicles in the intracellular environment is around 50 nms, this is considered as the size of a vertex. Similarly, removal of a vertex is considered equivalent to fission of a small vesicle from the membrane surface. Note that these 2 MC moves break the detailed balance condition and therefore drives the simulations away from equilibrium. The details of the implementation of the two active MC moves are described below.
Each vertex addition MC move increases the number of vertices in the triangulated surface by one and thereby increases the total area. We perform the vertex addition move in two ways—three neighbor addition and six neighbor addition. In the former, we choose a random face on the surface and attempt to add a vertex at a distance d ∈ (0, dadd) above (outside the surface) it along the face normal. The initially chosen face is removed and three new faces are added along with the new vertex. The coordination number of the newly added vertex in this case is three.
In six neighbor addition, a random face is chosen and a new vertex placement is attempted above it at a distance d ∈ (0, dadd) along the face normal. If the move is accepted, the chosen face and the three edges of the chosen face are removed. This results in six vertices surrounding the newly added vertex. Six new faces and edges are added by connecting the newly added vertex with the six vertices. Thus the coordination number of the newly added vertex is six in this algorithm. The vertex addition attempt is rejected if it violates the self- avoidance criteria. We observed that when dadd < = 0.7, almost all the addition attempts were rejected due to self-intersection. For dadd > 1.1, most of the newly added vertices results in highly obtuse triangle faces wherein the curvature computations are not accurate. Within the range 0.7 < dadd < 1.1, we observed that the results of our simulation do not vary significantly. For the results presented here, we used parameter value dadd = 0.9. Note that vertex addition adds “bumps” on the surface (Figure 2) that models the fusion of a small vesicle to the membrane surface. The sharp edges of these bumps are short-lived compared to the timescale for morphology change of the vesicle.
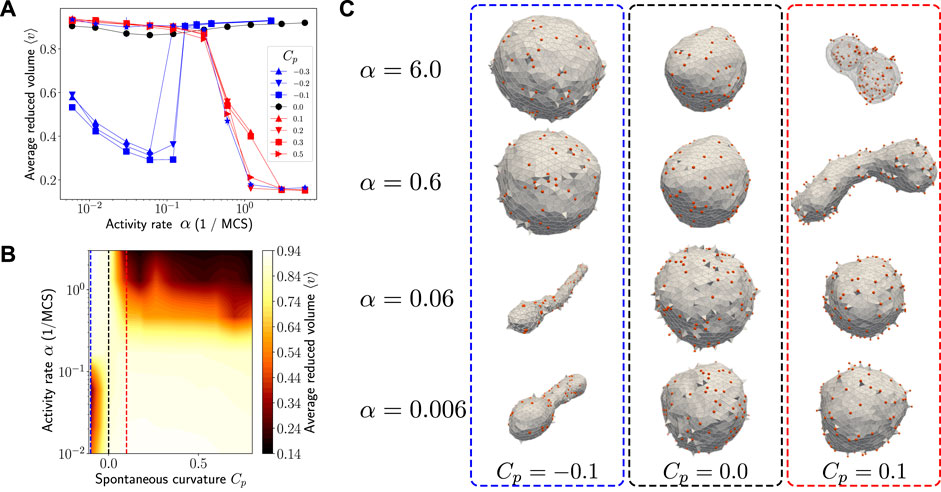
FIGURE 2. (A) Activity makes the spherical shape unstable when Cp ≠ 0.0. When Cp > 0, the reduced volume of the vesicle undergoes a sharp decrease as the activity rate is increased, indicating a sharp change in the vesicle morphology from spherical to flattened shapes. When Cp < 0, the reduced volume undergoes a diametrically opposite transition with activity rate, corresponding to a morphology change from tubular to spherical shapes. The blue filled star, which is overlapping with the red symbols, corresponds to simulations where Cp = −0.1 with no in-plane diffusion of active species. The interaction strength J is set to zero in all these cases. (B) A qualitative morphology phase diagram indicating the parameter ranges where the vesicle assumes a flattened/tubular shape (dark regions) and spherical shape (light regions). The dashed vertical lines show three cross sections corresponding to three different regimes of morphology changes observed in our model—tubular to spherical when Cp < 0 (blue), always spherical when Cp = 0 (black), and spherical to tubular/stomatocyte when Cp > 0 (red). (C) Snapshots of morphologies observed at the steady state for—Cp = −0.1 (blue outline), Cp = 0 (black outline), and Cp = 0.1 (red outline)—at different activity rates. The parameter values used in the simulation are
As vesicle fusion is an active process driven by energy supply from the hydrolysis of ATP molecules, we assume that the statistics of vertex addition is not controlled by the Hamiltonian. Rather, we use the following probability for accepting the addition move
where Nv is the number of vertices in the vesicle at any instant,
where α− Nv is the number of attempts to remove a vertex in one MCS. The parameters α+ and α− respectively affects the rate of fusion and fission processes with respect to the rate of bending relaxation. In order to satisfy the condition that the addition and removal probabilities are equal when
Note that, we have neglected the Gaussian curvature term in the free energy of the vesicle as we are only allowing vesicles of spherical topology. In order to maintain self-avoidance of the surface during addition and removal moves, we performed collision checks between vertices, edges, and faces during each active MC attempt. Collision checks are optimized by using an Octree data structure to represent and perform spatial queries using the geometric objects.
In this section, we derive the dynamical equations for a nearly spherical vesicle subjected to active membrane recycling. A two component vesicle, which has an active component that takes part in the active processes of fission/fusion and an inactive component that does not, is considered. The active component may represent either curvature inducing proteins or small lipid vesicles having a preferred curvature Cp. We derive the coupled dynamical equations for the vesicle radius field and the density of the active component, that includes the equilibrium bending relaxation, the diffusion of the active components and the effects of recycling. The stability of the spherical shape of such a vesicle is analyzed with respect to the activity strength.
The vesicle is modeled as a nearly spherical 2D surface. The configuration of the vesicle is represented using spherical parametrization where the distance from the centre of mass, to each point on the surface, is given by,
Here r0 is the radius of a reference sphere and u is the scaled deviation in radius at point (θ, φ). Assuming that the deviation (u) from the reference spherical shape is small, the relevant local geometric quantities—square root of determinant of the metric tensor and the mean curvature—upto 2nd order in u are,
where ∇⊥ is the surface gradient operator defined as
An effective energy functional can be written for the vesicle based on the Helfrich Hamiltonian as [26],
where κ is the bending rigidity of the membrane and Cp is the preferred curvature of the active component. The integral is defined over the entire area of the reference sphere, where
where Γ is the membrane mobility and M is the lateral mobility of the active species. The first term on the right hand side of Eq. 13 and Eq. 14 represent the relaxation of the local radius and the density field respectively. The second term represents the equilibrium random noise. In this paper we only look at the regime where random forces from the surroundings on the system are small compared to the active noise (to be introduced below) and set ξu(t) = 0 and ξϕ(t) = 0 for the rest of the analysis.
The active processes shown schematically in Figure 1C are modeled as follows. Fusion can happen anywhere on the surface regardless of whether active species are present in the region or not. In a very general case, the rates of fusion may also depend on the local curvature and composition of the active species. Thus, we assume the following form for the rate of fusion
where λ1 represents a uniform rate of fusion and λ2, λ3, and λ4 are appropriate coupling constants. In our model, fission is allowed only from regions where active species are present on the surface, therefore it must always be coupled to
where μ1 and μ2 are coupling constants. Note that, in the special case of spatially uniform fission and fusion, all the coupling parameters except λ1 and μ1 are zero. For a perfectly spherical (u = 0) and homogeneous (ϕ = 0) vesicle, the steady state is attained when the rates are balanced,
where δ1 = λ3 − μ1 and δ2 = λ4 − μ2. We now have four parameters related to the activity—1) λ1: the uniform rate of fusion, 2) λ2: the local curvature dependent rate of fusion, 3) δ1: the activity rate that depends on the local density of active species, and 4) δ2: the activity rate that depends both on the local density and the local curvature. They are not all independently controllable as the steady-state concentration imposes a constraint. Thus, we can write the parameter δ2 in terms of the other three as,
For a configuration that deviates from the reference state by u and ϕ respectively in the radius and local density fields, the net change due to activity is,
The dynamical equations for the local radius and the local density fields of the active vesicle are,
where the quantities l and a represent the temporal variation of local radius and local density field, respectively, due to activity and τ represents the activity timescale. In both Eqs 20, 21, the first term of the right hand side captures the equilibrium relaxation and the second term corresponds to the nonequilibrium dynamics. So as to carry out a linear stability analysis, the variables u and ϕ are expanded in the spherical harmonic basis as
where Ynm (θ, φ) represents a spherical harmonic mode. The modes corresponding to n = 0 and n = 1 with respect to variable u capture the radial expansion and the lateral translation modes respectively. As these two modes do not change the energy of the system, they are neglected in the spherical harmonic expansion. From Eq. 20 and Eq. 21, we get the linearized coupled dynamical equation for the spherical harmonic coefficients unm and ϕnm as,
where, 1/τκ = Γκ. The dimensionless quantities in Eq. 24 are defined as given in Table 1.
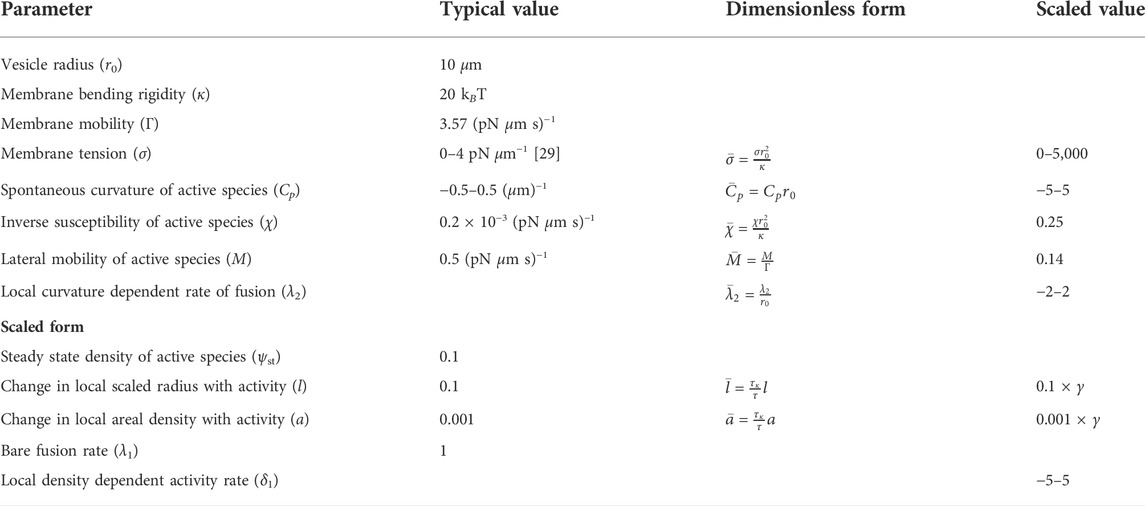
TABLE 1. Parameters considered in the model, their dimensionless form, and the (range of) scaled values used for the stability analysis.
In the absence of activity [τκ/τ = 0], the dynamical equations represent equilibrium relaxation of the membrane. In addition to this, when Cp = 0, the dynamical matrix becomes diagonal and the eigenvalues are ∼ − n4 and
We use the modified DTMC method (described in 2) to explore and characterize the steady state morphologies of a two-component vesicle with a minority component that is curvature inducing. Only the curvature inducing components on the membrane undergo active recycling, when vertices labelled with these components are added on the outer side or removed from the vesicle. The simulation ensures that the mean and the width of fluctuation in the number of these active species is set to specific values. A nearly spherical vesicle is used as the initial configuration in the simulation runs. The reduced volume, defined as the ratio of the vesicle volume to the volume of a sphere having the same area, is used to broadly characterize the shapes. A value of reduced volume close to unity indicates that the vesicle shape is nearly spherical, whereas values smaller than unity indicates that the vesicle is deformed. The organization of active sites on the surface is quantified with the help of cluster size probability distributions. In all the simulations, the spherical topology of the membrane is maintained, the vesicle volume is allowed to change, and the net pressure difference between the inside and outside is set to be zero. We choose the bending modulus and spontaneous curvature values such that in the absence of activity (no vertex addition or vertex removal MC moves) the vesicle remains spherical.
For the results presented in this subsection, we assume that there is no direct interaction between the active components (i.e., J = 0 in Eq. 5). The dependence of the average reduced volume of steady state vesicle configurations on activity rate is shown in Figure 2A. When the preferred curvature of the active species is zero (Cp = 0.0), the reduced volume does not deviate significantly from unity even at higher activity rates suggesting that the vesicle remains spherical (see black curve in Figure 2A). For non-zero spontaneous curvatures, Figure 2A shows a sharp transition in the average reduced volume with increasing activity rate. Such a change in the average reduced volume indicates that there is a drastic change in the vesicle morphology. When the preferred curvature of the active species is positive, we observe a transition from spherical shape to flattened sacs and stomatocytes. On the other hand, when the preferred curvature is negative, we see tubular shapes at lower activity which transitions sharply to spherical shape at higher activity. The steady state shapes obtained at various values for the activity rate and spontaneous curvatures are shown in Figure 2C. A morphology phase diagram as a function of activity rate and preferred curvature of the active components is shown in Figure 2B.
The morphology changes can be understood vis a vis three competing timescales involved in the process; 1) curvature relaxation, 2) membrane recycling or activity and 3) in-plane diffusion. In our simulations, we observed that it requires
The transition from low activity to high activity is independent of the value of Cp and is set by the typical shape relaxation time. The shape relaxation in our simulations is
When the interaction strength J, between the active species, is greater than zero, it is energetically favourable for the active species to form clusters. In this subsection, we focus on the effect of activity rate and the spontaneous curvature on the size of such clusters. Figure 3A shows, a log-log plot between the probability of observing a cluster of a particular size versus the cluster size. The dependence on activity rate and the preferred curvature of the active species Cp are shown separately. The shoulder like regions in both the plots show that there is a preference for clusters having around 10 active species for low activity and low Cp values.
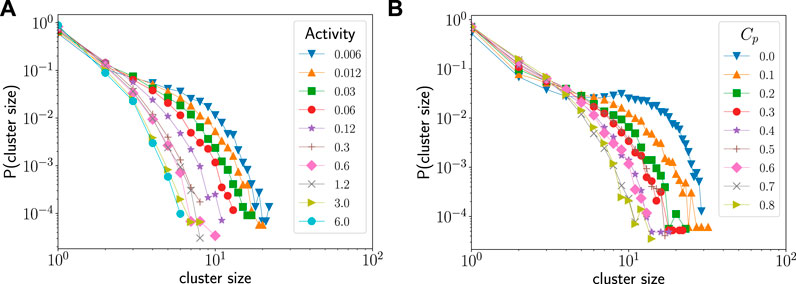
FIGURE 3. (A) The dependence of the cluster size distribution on activity rate. Increasing the activity rate suppresses the formation of large clusters. The spontaneous curvature for all the curves is Cp = 0.6. (B) The dependence of the cluster size distribution on the spontaneous curvature. Increasing the spontaneous curvature suppresses the formation of large clusters. The activity rate for all the curves is 0.06 per MCS. The parameter values used in the simulation are
Figure 3A compares the cluster size distributions at different activity rates when the spontaneous curvature of the active species is fixed at 0.6. We see that as activity rate is increased, the probability of larger clusters diminishes. Similarly, Figure 3B shows the cluster size distributions at a low activity rate (0.06 per MCS) for different spontaneous curvatures. In this case too, we see that the probability of large cluster sizes diminishes with increase in spontaneous curvature. Thus, we conclude that both activity rate and its coupling to the curvature of the membrane inhibit the formation of clusters on the vesicle surface.
We have carried out a linear shape stability analysis of a two-component vesicle subjected to active membrane recycling. The derivation of the linearized dynamical equation about the homogeneous spherical reference state is given in Section 3. The spherical shape of the vesicle remains stable at all Cp values in the absence of activity when the steady state density of the active component ψst is fixed at 0.1. The stability phase diagram of the vesicle in the (Cpr0, ψst) plane, in the absence of activity, is shown in Figure 4A. Here r0 is the radius of a reference sphere. The dark regions in Figure 4A corresponds to the case where curvature-composition coupling is strong enough to destabilize the spherical shape [28]. Values for other dimensionless parameters are chosen as shown in Table 1.
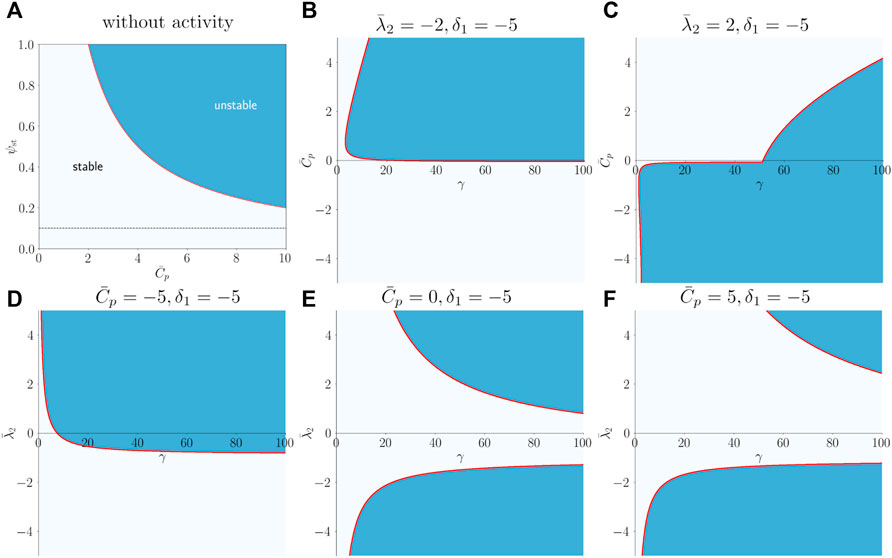
FIGURE 4. (A) Stability phase diagram for the vesicle without activity. Spherical morphology is unstable in the high Cp and high ψst regime (dark blue). The dashed line marks the case of ψst = 0.1, where the spherical shape of the vesicle is stable for the range of spontaneous curvature values considered here. (B,C) The stability diagram in the presence of activity in
In the presence of activity, the stability is also governed by the coupling parameters, namely the local curvature dependent rate of fusion
The linear stability analysis predicts the conditions under which the spherical shape is unstable in a certain parameter space. As a general trend, we observe that, when activity is large and non-uniform
Active transport of membrane materials is considered essential for maintaining the composition of intracellular membranes, particularly for those in the endocytic pathway. Such transport is also expected to influence the large scale morphology of organelles. We have developed a nonequilibrium simulation method based on DTMC to study the effect of fluctuations in area and spontaneous curvature on the steady state morphology of a vesicle. The spherical shape of the vesicle was found to be stable at all activity rates as long as the spontaneous curvature of the active component was zero. At positive spontaneous curvatures, the vesicle is spherical at low activity rates (
The distribution on the membrane, of active proteins that can cause membrane curvature, will have serious implications on the morphology of the vesicle. We expect a non-zero attractive interaction between the active species to result in formation of large clusters on the surface. While at low activity rates we do find the formation of such large clusters, higher activity rates and high spontaneous curvatures were seen to inhibit the formation of large clusters. Our results show that regulation of the membrane recycling rate could offer a robust mechanism to maintain the vesicle in spherical, tubular, or a stomatocyte morphology, without having large clusters of curvature active components.
In order to gain a little more understanding of the factors that drive the membrane shape instability, we derived the dynamical equations for the local shape and composition fields of a nearly spherical vesicle that is subjected to active material transport. The coupled dynamical equations took into account the bending relaxation of the membrane, the diffusion of the components, and changes in the local radius and local composition due to the active processes. The vesicle was composed of passive and active components, with the passive species having no preferred curvature while the active species possessed a spontaneous curvature and took part in membrane fission and fusion. The conditions under which the active recycling of membrane material can destabilize a spherical vesicle was identified using a linear stability analysis.
Though the biological membranes, with its chemical diversity, is far more complex than the simplified models used in this work, we are able to see that membrane area and curvature fluctuations, resulting from active transport of materials, can lead to non-trivial vesicle shapes. Future work will explore the effect of multiple active agents that undergo reaction and diffusion on the vesicle surface.
The original contributions presented in the study are included in the article/Supplementary Material, further inquiries can be directed to the corresponding author.
PBSK and TVSK conceived the presented idea. PBSK developed the numerical code and performed the computations. PBSK supervised the findings of this work. All authors discussed the results and contributed to the final manuscript.
TS thanks IIT Palakkad for the hospitality and for providing high performance computing resources. The authors thank Madan Rao and John Ipsen for fruitful discussions.
The authors declare that the research was conducted in the absence of any commercial or financial relationships that could be construed as a potential conflict of interest.
All claims expressed in this article are solely those of the authors and do not necessarily represent those of their affiliated organizations, or those of the publisher, the editors and the reviewers. Any product that may be evaluated in this article, or claim that may be made by its manufacturer, is not guaranteed or endorsed by the publisher.
1. Alberts B, Johnson A, Lewis J, Raff M, Roberts K, Walter P. Molecular biology of the cell. 2 edn. New York: Garland Science (2008).
2. Phillips R, Kondev J, Theriot J, Garcia H. Physical biology of the cell. New York, NY: Garland Science (2012).
3. Heald R, Cohen-Fix O. Morphology and function of membrane-bound organelles. Curr Opin Cell BiolCell architecture (2014) 26:79–86. doi:10.1016/j.ceb.2013.10.006
4. Shibata Y, Voeltz GK, Rapoport TA. Rough sheets and smooth tubules. Cell (2006) 126:435–9. doi:10.1016/j.cell.2006.07.019
5. Guven J, Huber G, Valencia DM. Terasaki spiral ramps in the rough endoplasmic reticulum. Phys Rev Lett (2014) 113:188101. doi:10.1103/PhysRevLett.113.188101
6. Voeltz GK, Prinz WA. Sheets, ribbons and tubules—How organelles get their shape. Nat Rev Mol Cell Biol (2007) 8:258–64. doi:10.1038/nrm2119
7. Shibata Y, Hu J, Kozlov MM, Rapoport TA. Mechanisms shaping the membranes of cellular organelles. Annu Rev Cell Dev Biol (2009) 25:329–54. doi:10.1146/annurev.cellbio.042308.113324
8. Misteli T. The concept of self-organization in cellular architecture. J Cell Biol (2001) 155:181–6. doi:10.1083/jcb.200108110
9. Karsenti E. Self-organization in cell biology: A brief history. Nat Rev Mol Cell Biol (2008) 9:255–62. doi:10.1038/nrm2357
10. Rafelski SM, Marshall WF. Building the cell: Design principles of cellular architecture. Nat Rev Mol Cell Biol (2008) 9:593–602. doi:10.1038/nrm2460
11. McMahon HT, Gallop JL. Membrane curvature and mechanisms of dynamic cell membrane remodelling. Nature (2005) 438:590–6. doi:10.1038/nature04396
12. Zimmerberg J, Kozlov MM. How proteins produce cellular membrane curvature. Nat Rev Mol Cell Biol (2006) 7:9–19. doi:10.1038/nrm1784
13. Karbowski M, Youle R. Dynamics of mitochondrial morphology in healthy cells and during apoptosis. Cell Death Differ (2003) 10:870–80. doi:10.1038/sj.cdd.4401260
14. Chen YA, Scheller RH. Snare-mediated membrane fusion. Nat Rev Mol Cell Biol (2001) 2:98–106. doi:10.1038/35052017
15. Rao MRCS, R. C. S. Active fusion and fission processes on a fluid membrane. Phys Rev Lett (2001) 87:128101. doi:10.1103/PhysRevLett.87.128101
16. Ramakrishnan N, Ipsen JH, Rao M, Kumar PBS. Organelle morphogenesis by active membrane remodeling. Soft Matter (2015) 11:2387–93. doi:10.1039/C4SM02311K
17. Goutaland Q, van Wijland F, Fournier JB, Noguchi H. Binding of thermalized and active membrane curvature-inducing proteins. Soft Matter (2021) 17:5560–73. doi:10.1039/D1SM00027F
18. Natesan R, Gowrishankar K, Kuttippurathu L, Kumar PBS, Rao M. Active remodeling of chromatin and implications for in vivo folding. J Phys Chem B (2022) 126:100–9. doi:10.1021/acs.jpcb.1c08655
19. Tachikawa M, Mochizuki A. Golgi apparatus self-organizes into the characteristic shape via postmitotic reassembly dynamics. Proc Natl Acad Sci U S A (2017) 114:5177–82. doi:10.1073/pnas.1619264114
20. Rautu SA, Rowlands G, Turner MS. Size-dependent recycling of membrane clusters. EPL (Europhysics Letters) (2018) 121:58004. doi:10.1209/0295-5075/121/58004
21. Mietke A, Jülicher F, Sbalzarini IF. Self-organized shape dynamics of active surfaces. Proc Natl Acad Sci U S A (2019) 116:29–34. doi:10.1073/pnas.1810896115
22. Ruiz-Herrero T, Fai TG, Mahadevan L. Dynamics of growth and form in prebiotic vesicles. Phys Rev Lett (2019) 123:038102. doi:10.1103/PhysRevLett.123.038102
23. Nelson D, Piran T, Weinberg S. Statistical mechanics of membranes and surfaces. 2 edn. Singapore: World Scientific Singapore (2004).
24. Ramakrishnan N, Kumar PS, Ipsen JH. Membrane-mediated aggregation of curvature-inducing nematogens and membrane tubulation. Biophysical J (2013) 104:1018–28. doi:10.1016/j.bpj.2012.12.045
25. Noguchi H, Gompper G. Meshless membrane model based on the moving least-squares method. Phys Rev E (2006) 73:021903. doi:10.1103/PhysRevE.73.021903
26. Helfrich W. Elastic properties of lipid bilayers: Theory and possible experiments. Z für Naturforschung C (1973) 28:693–703. doi:10.1515/znc-1973-11-1209
27. Seifert U, Langer SA. Viscous modes of fluid bilayer membranes. Europhys Lett (1993) 23:71–6. doi:10.1209/0295-5075/23/1/012
28. Leibler S. Curvature instability in membranes. J Phys France (1986) 47:507–16. doi:10.1051/jphys:01986004703050700
Keywords: lipid membrane, active membrane, spontaneous curvature, vesicle fission and fusion, vesicle morphology, self-organization, nonequilibrium
Citation: Sachin Krishnan TV and Sunil Kumar PB (2022) Active membrane recycling induced morphology changes in vesicles. Front. Phys. 10:1003558. doi: 10.3389/fphy.2022.1003558
Received: 26 July 2022; Accepted: 22 August 2022;
Published: 28 September 2022.
Edited by:
Shreyas Kaptan, University of Helsinki, FinlandReviewed by:
Bortolo Matteo Mognetti, Université libre de Bruxelles, BelgiumCopyright © 2022 Sachin Krishnan and Sunil Kumar. This is an open-access article distributed under the terms of the Creative Commons Attribution License (CC BY). The use, distribution or reproduction in other forums is permitted, provided the original author(s) and the copyright owner(s) are credited and that the original publication in this journal is cited, in accordance with accepted academic practice. No use, distribution or reproduction is permitted which does not comply with these terms.
*Correspondence: P. B. Sunil Kumar, c3VuaWxAaWl0cGtkLmFjLmlu
†Present Address: T. V. Sachin Krishnan, Faculty of Computer Science, Technische Universität Dresden, Dresden, Germany
Disclaimer: All claims expressed in this article are solely those of the authors and do not necessarily represent those of their affiliated organizations, or those of the publisher, the editors and the reviewers. Any product that may be evaluated in this article or claim that may be made by its manufacturer is not guaranteed or endorsed by the publisher.
Research integrity at Frontiers
Learn more about the work of our research integrity team to safeguard the quality of each article we publish.