- 1Ande College, Xi’an University of Architecture and Technology, Xi’an, China
- 2The Fourth Engineering Co Ltd of CTCE Group, Hefei, China
- 3China Key Laboratory of Ministry of Education for Geomechanics and Embankment Engineering, Hohai University, Nanjing, China
- 4Anhui Jianzhu University, Hefei, China
- 5Nanjing Greenland Metro Line 5 Investment Development Co., Ltd, Nanjing, China
The deformation prediction of foundation pit is still an open issue in geotechnique engineering. This paper focuses on a new deformation prediction method of foundation pit in soil-rock composite stratum in Nanjing area. To do so, the field monitoring deformation data of deep foundation pit adjacent to the railway in a soil-rock combined stratum is firstly analyzed. Based on these field data, the characteristics of horizontal displacement and surface settlement of rock-socketed support pile, as well as its relationship with Earth excavation are discussed. Results show that the average value of maximum horizontal displacement of support pile in zone with shallow rock depth (soil layer >15 m) is relatively large, which is 3.5 times of that with shallow soil depth (10–12 m into moderately-weathered mudstone). The depth of maximum horizontal displacement is obviously linearly related to the thickness of soil layer (H), while the surface settlement does not change with the increase of soil/rock layer thickness ratio. Utilizing the relationship between the maximum water level displacement and excavation depth, a new Gaussian-type empirical formulation is established to predict horizontal deformation of soil-rock composite stratum with rock-socketed support pile. By comparison with two other methods, it is found that the improved Gaussian curve is in good agreement with the measured horizontal displacement curve. This indicates that the new method can provide a valid reference for the design and construction of foundation pit with rock-socketed support pile in Nanjing area.
1 Introduction
With the rapid development of urban rail transit (URT) in recent years, the underground zone gradually involves deeper foundation pit, more complex geology, and the gradually increasing scale and difficulty of construction works, which triggers higher requirements for rapid, safe and economical construction. The foundation pit of urban metro is often located in a complex surrounding environment. Thus, in consideration of economic and social benefits, it is necessary to ensure the safety and stability of surrounding roads, municipal pipelines and buildings.
Scholars did much research on the deformation regularity and environmental impact of foundation pit based on a large number of site monitoring data. The research reveals that the shape, deformation, depth of foundation pit, geotechnical geology, type of enclosure structure, excavation method, exposure time and hydro-climate affect foundation pit deformation to varying degrees. Deep soft-soil foundation pit is easy to be affected by excavation process, which causes large deformation. Through statistical analysis, Zahmakesh [1] and Wong [2] respectively obtained the deformation regularity and influence scope of foundation pit under soft soil layer in Japan and Europe. Peck [3] and Ou [4] studied the environmental effect of soft-clay area and sandy area. Several investigations [5–9] focused on the foundation pit cases in Shanghai, Hangzhou and Fuzhou and so on, and summarized the deformation law of foundation pit structure in soft clay area. Because the complexity of engineering geology has an obvious impact on the deformation law of foundation pit, the criterion of slope excavation stability in foundation pit design still needs to be classified and discussed. For the deformation prediction of foundation pit, the existing fitting method is mainly positive distribution function, which needs to be optimized by other models. The existing research trend on the deformation law of foundation pit has gradually tilted to water-rich sand layer, soil-rock composite stratum, karst and other special engineering geology in recent years.
For rock-entry foundation pit, Ou [4] and Clough [10] discussed the foundation pit support system of surface soft soil and underlying weathered rock, and obtained the relationship between maximum deformation and excavation depth. Yoo [11] made a detailed study on the diaphragm wall support with sequence method and anchor bolt. Liu et al. [12] studied the design method of rock-socketed pile with large-diameter steel casing. Leung [13] carried out data statistics and analysis on the surface marine residual soil, multiple foundation pits of underlying weathered granite and diaphragm wall along the construction line, and obtained the law of maximum horizontal displacement. Basheer et al. [14] applied the stiffness degradation method (SDM) to single rock-socketed pile to predict the performance of offshore rock socketed pile under cyclic load. AI et al. [15] used the consolidation solution of layered saturated foundation as the kernel function of boundary element method to derive the flexibility matrix of soil and rock mass, and analysed the effects of rock-socketed depth, pile Young’s modulus, length diameter ratio and soil-rock interface on the load deformation of rock socketed pile in multi-layer transversely isotropic saturated medium.
There are also some cases of soil-rock composite stratum in Wuhan, Dalian, Qingdao and other places in China. Huang [16] studied on the surface settlement caused by excavation of foundation pit under the “suspended foot piles” (used as a support structure) and revealed its surface settlement characteristics. Feng [17] discussed the new technology for supporting deep foundation pit in soil-rock composite stratum in Qingdao area, and the reinforced cement soil pile anchor (RCSPA) supporting technology combining prestressed anchor technology with reinforced cement wall. Li [18] summarized the deformation characteristics of deep foundation pit under three typical strata of Xiamen Metro; Tong [19] did detailed research on the key technology of deep foundation pit in pebble stratum in Chengdu area. Chen et al. [20] studied a deformation case of pit in pit (PIP) excavation support structure in Shenzhen soil-rock composite stratum.
For environmental effects of foundation pit excavation, representative research methods currently include field measurement analysis method and numerical method. Numerical methods: Wang [21] et al. carried out finite element simulation on deep foundation pit with bulging soil-rock composite, and considered that inclination of soil-rock joint surface has an important influence on foundation pit deformation, at the same time, bulging and concave angles of soil-rock composite foundation pit have significant local effects; Bai et al. [22], did field experiment and numerical simulation, and studied the synergistic effect of composite support structure (pile + steel support + anchor cable); Janusz et al. [23], based on model experiments, proposed a time-history related numerical model of rock-socketed pile; Li [24] considered the influence of space effect, the prediction method of three-dimensional surface settlement of long and narrow deep foundation pit is deduced; Zhong [9] analyzed the effect of foundation reinforcement of soil-rock composite foundation pit by finite element method, suggesting that the foundation reinforcement can effectively reduce the deformation of foundation pit. Zhang [25] and others put forward the method of predicting settlement by normal distribution fitting curve.
In terms of on-site analysis methods, Xie [26] analyzed the excavation effect of deep foundation pit in soil-rock composite stratum in Jinhua area, and two methods for predicting horizontal displacement by volume and displacement relation are proposed. Chen et al. [27], aiming at the soil-rock composite stratum, explored how to use the stability balance theory of underground engineering to carry out tunnel excavation and support. In the research of foundation pit deformation control, more and more new algorithms such as BP neural network algorithm, LMD-PSO-LSSVM composite model are applied.
Foundation pit has strong regional characteristics. Located in the middle and lower reaches of the Yangtze River, Nanjing has a large relief and is affected by fracture structure. The topography and geomorphy, rock and soil layer types and distribution are complex and changeable. There are low hills, valleys, lakes and swamps, old channel of Qinhuai River, and floodplains of the Yangtze River in Hexi area. This paper takes Xishanqiao Station of Nanjing Metro as the research object, and studies the special soil-rock composite stratum in Nanjing area. The monitoring data of deep foundation pit of underground metro are analysed, deformation regularities of rock-socketed supporting piles and surface settlement is summarized, and deformation prediction is carried out by using Gauss curve, which can provide reference for the design and construction of underground foundation pit under such soil-rock composite stratum in Nanjing. The datum for Xishanqiao station is collected from August 2020 to September 2021.65 points are monitored and these points are divided into 5/group. As for other stations, Jiulong Lake and Kening Road station’s foundation pits are finished, Zhushan Road, Xinting Road, Shangyuan Street station are still in construction, by the time the manuscript was finished (2021.9). We collected completed points from these stations. Table 1 provides monitoring data of deep foundation pit of soil-rock composite metro in Nanjing stations, in which
2 Construction Works Study
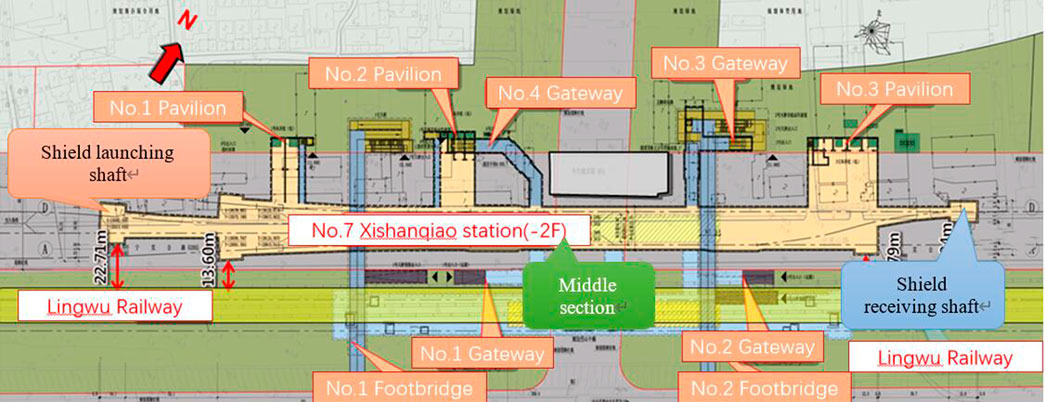
Xishanqiao Station, the first station of Nanjing Metro Line 7 Project, is located on Ningwu Highway (205 National Highway). It is arranged along the east-west direction of Ningwu Highway. As shown in Figures1, 2, the station is an underground two-store island platform station with two-pillar and three-span box-type frame structure. The total length of station is 497.0 m, the effective platform width is 14m, the standard section outer edge width is 22.7 m, and the thickness of roof covering is about 3.3 m. Φ1000 at 800 mm secant pile is used for main body enclosure of the station. For local area it is 1,000at1200 mm cast-in-place bored pile + jet grouting pile as waterproof curtain. Φ1500 mm at 1700 mm Bored cast-in-place bored piles + Φ800 mm at 550 mm triple-pipe jet grouting pile as waterproof curtain in the enlarged section of end shaft near the side of Ningwu Railway. The railway station is constructed by open excavation and normal construction method.
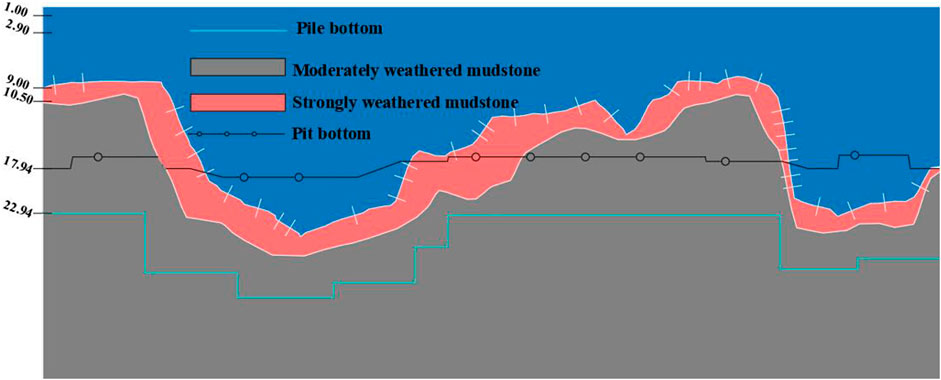
The construction site of the station is located in the floodplain area of the Yangtze River. The soil layers from top to bottom are muddy silty clay, silty clay and silty sand with gravel, and the underlying bedrock is Cretaceous Pukou formation (K2P) mudstone, silty mudstone and argillaceous siltstone. The rock stratum fluctuates greatly, while the buried depth is 8.1–30.6 m. The moderately weathered rock stratum in the excavation range accounts for about 0%–56% longitudinally. The maximum depth of the launching-shield shaft-support pile at the west end of the station embedded in the moderately weathered rock is 12 m. The overall layout is shown in Figure 1, the internal support layout is shown in Figure 2. In this case, the rock entry thickness and displacement settlement effect of Metro deep foundation pit in soil-rock composite stratum are shown in Table 2.
The buildings (structures) around the station mainly include: Ningwu railway in the south, about 12.89 m from the main foundation pit of the station; There is a 5-storey Hotel on the north side, without basement, with prestressed tubular pipe foundation, pile length of 16.5–24 m, pile diameter of 0.4 m and distance of 8.4 m from the main foundation pit; In addition, on the north side, there are some street facades, residential houses and factories that have not been demolished, with 1–2 floors, no basement, strip foundation and 21.4 m nearest to the main foundation pit. Gas pipes, rainwater pipes, water supply pipes, power supply pipes and overhead communication pipelines are buried in the South and north of Ningwu highway, which need to be relocated or avoided. According to expert opinions, the nearby hotel has completed the special risk design, with a settlement control value of 20 mm, a differential settlement control value of 8 mm and an inclination control value of 0.002. The adjacent railway has completed the special design related to railway, with a settlement control value of 10 mm, a uplift of 0 mm and an allowable horizontal displacement of 6 mm. In addition, the anti-floating design of wall crown beam is required.
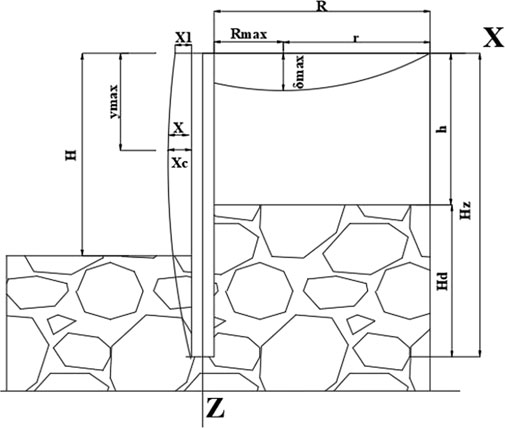
To simplify, the deformation sketch of foundation pit is shown in Figure 3, in which
3 Regularity of Horizontal Displacement and Surface Settlement Deformation of Rock Socketed Deep Foundation Pit
3.1 Analysis of Horizontal Displacement of Foundation Pit
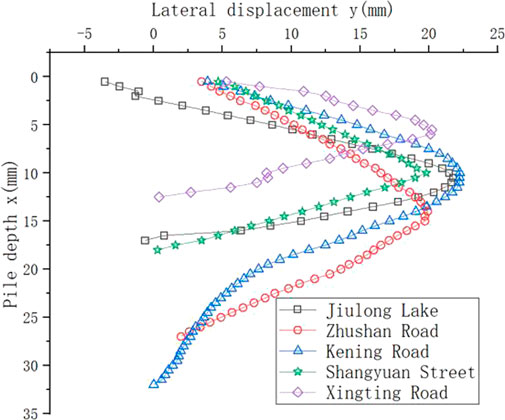
In this work, representative monitoring data of deep foundation pit of soil-rock composite of five metro stations in Nanjing area are used, the evolution of lateral displacement with pile depth of these stations are presented in detail as shown in Figure 4. In order to discuss the influence of soil-rock ratio on deformation of foundation pit, a batch of typical data is selected from monitoring data, which are divided into two groups: 1) the rock layer thickness through which rock-socketed piles pass is larger, and the depth of embedded moderately weathered rock is deeper (10–12 m); 2) the soil layer thickness through which rock-socketed piles pass is larger (soil layer >15 m), which passes by no rock stratum or shallow rock stratum. For convenience of study, “rock stratum” mentioned later refers to moderately weathered rocks.
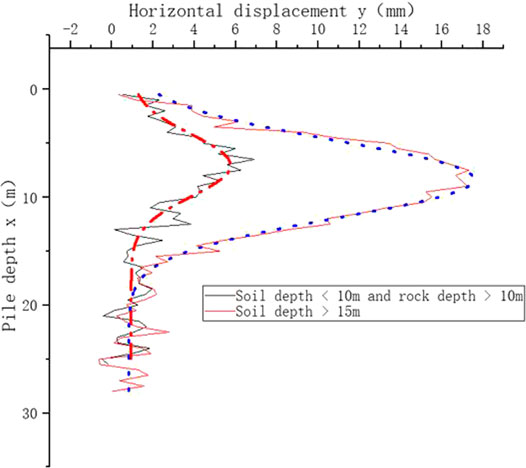
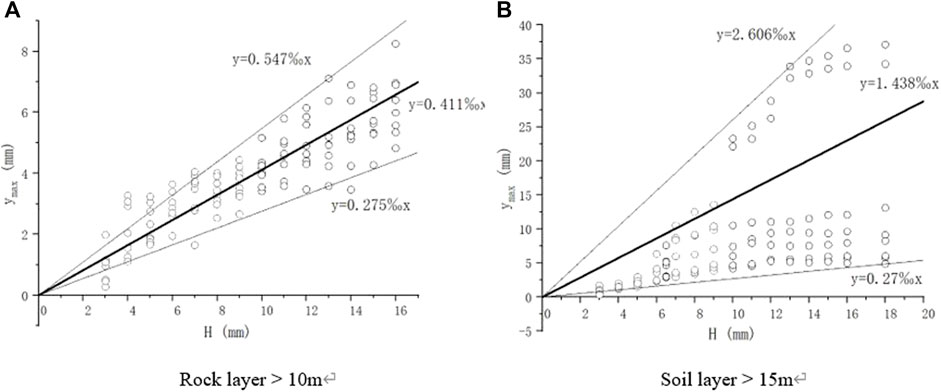
The horizontal displacement curves of the rock-socketed support piles corresponding to the above two cases are shown in Figure 5. The horizontal displacement changes of the deep layer of the piles are all in a “convex” type distribution. The black line in Figure 5 represents the deeper rock-socketed depth (10–12 m), and the corresponding maximum horizontal displacement values of the rock-socketed support piles are mostly between 0.2‰H–0.55‰H, with an average value of 0.4‰H, as described in Figure 6A. The red line in Figure 5 represent the case of the deeper soil embedded depth (>15 m). The corresponding maximum horizontal displacement values of support piles are mostly between 0.2‰H–2.6‰H with an average value of 1.4‰H, as illustrated in Figure 6B.
It can be seen in Table 3 that the thicker the soil layer through which the support pile passes, the greater the maximum horizontal displacement value will be. Moreover, when the proportion of soil and rock layer is high, the horizontal displacement effect caused by excavation is more obvious.
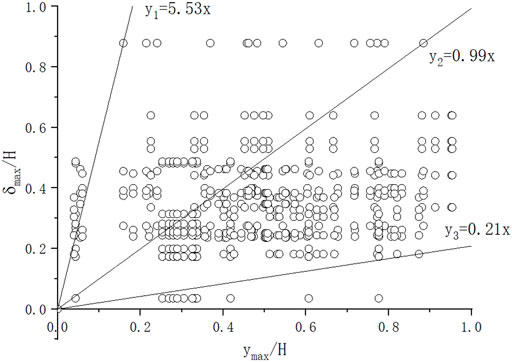
Monitoring data shows that the relative maximum horizontal displacement (
Due to the large stiffness and small deformation of rock stratum, the excavation process has less impact on the horizontal displacement. The change rate decreases slowly, which can be approximately expressed as hyperbola:
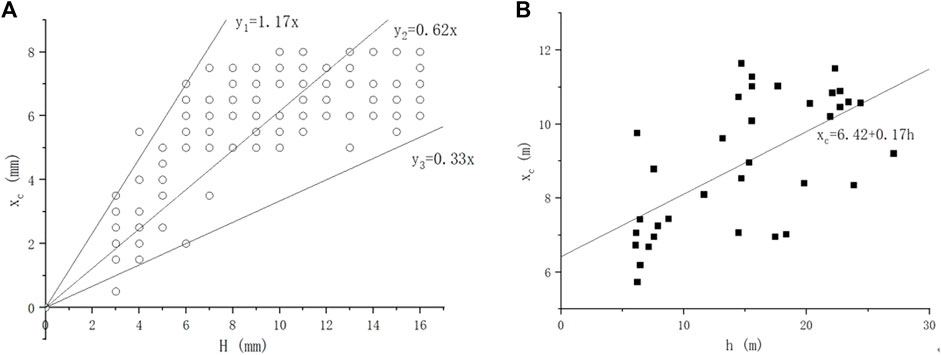
Figure 7A shows the relationship between the position depth of the maximum horizontal displacement of the foundation pit (
According to the statistical data of 65 measuring points at Xishanqiao station, the maximum horizontal displacement is generally located in the middle of the foundation pit side and below the moderately weathered rock surface of the foundation pit excavation line. When the support pile is deep into the moderately weathered rock (10–12 m), the maximum horizontal displacement occurs at the depth of 6–8 m; When the excavation surface is above the moderately weathered rock surface, the support pile does not go deep into the rock stratum, and the soil layer is deep (>15 m), the corresponding depth of the maximum horizontal displacement is deep, which is located at the depth of 8–12 m.
Figure 7B shows the relationship between the maximum horizontal displacement depth of the foundation pit (
Through the monitoring data, it is found that the relationship between
3.2 Analysis of Settlement Around Foundation Pit
In order to analyze the deformation behavior of foundation pit, it is also necessary to do research on the settlement around foundation pit. Here we take Nanjing Metro Line 5 as an example. Figure 8 describes the typical settlement trend of each station of Nanjing Metro Line 5. The deformation caused by deep foundation pit excavation has pile top settlement and surface settlement in the vertical direction, mainly in the form of surface settlement, mostly in the form of groove. The settlement prediction curve in Figure 9 shows that the area within the excavation range twice the distance from the foundation pit is the area with large settlement, and the settlement outside 2H from the foundation pit is very small. Therefore, the distribution influence of surface settlement behind the pile is mainly within 2H from the pile top, which is smaller than that estimated by peck [3] and clough [10].
Nine measuring points of the foundation pit of Xishanqiao station are taken to compare the influence regularity of maximum settlement excavation depth. With the increase of excavation depth, the maximum surface settlement increases. The average value of the maximum surface settlement is 0.24‰ H–0.77‰ H, which is similar to the variation regularity of the maximum settlement of deep foundation pit in pebble stratum in Chengdu (basically less than 0.73‰ H) according to Tong J [19], Xie [26] and others calculated that the average settlement of the case is 0.035‰ H, and the average settlement of this case is 0.24‰H. Meanwhile, under the condition of soil-rock composite stratum, the surface settlement outside the foundation pit does not change obviously with the increase of soil layer thickness, nor does it change obviously with the increase of rock depth.
When the foundation pit is excavated to the bottom, the ratio of the location of the maximum settlement (distance from the edge of the foundation pit) to the excavation depth is less than 50%, accounting for 60% of the total. The maximum surface settlement is mainly distributed in the range of 0.1–0.5H.
3.3 Relationship Between Horizontal Displacement in Deep Foundation Pit and Surrounding Settlement
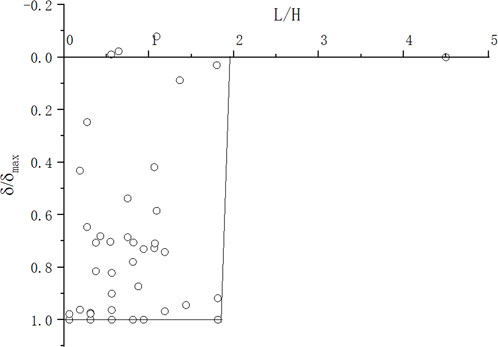
Figure 10 shows relationship between the relative maximum surface settlement of foundation pit (
4 Prediction Method of Foundation Pit Deformation
The deformation mode of retaining structure is closely related to the excavation process of foundation pit. Analyzing and studying the monitoring data of rock foundation pit can master the excavation characteristics of foundation pit in soil-rock composite stratum, predict the deformation of foundation pit through the summarized regularities, and take measures in advance for the potential problems after foundation pit deformation. Therefore, the foundation pit deformation prediction based on mathematical statistics is very necessary and has certain practical guiding significance.
Peck [3] made statistics on the deformation data of foundation pits in Norway and other places, and put forward an empirical method for predicting the surface settlement behind the wall for the first time. Based on OU’s research, Hsieh et al. [30] gave the prediction methods of triangle and groove settlement forms. Y. Tan et al. [31] combined with the case of foundation pit in hard clay soil layer in Suzhou, considered that the method of predicting land settlement in the existing articles were not applicable to the case. Xie [26] predicted the horizontal displacement of Metro deep foundation pit in soil-rock composite stratum in Jinhua area by using the displacement relationship and volume relationship of foundation pit deformation.
Nanjing Xishanqiao station is only 6 m away from the existing railway line. It is a high-risk area with special geographical location. In this paper, Gaussian curve and hyperbola are used to predict the surface settlement and pile horizontal displacement, and compared with the actual monitoring results.
4.1 Calculation of Foundation Pit Settlement Curve
According to the monitoring data of the foundation pit of the shield launching shaft constructed in the early stage, the approximate foundation pit settlement shape can be observed, and the contour curve is shown in Figure 8. Axis x refers to distance from the edge of foundation pit. Axis z refers to the depth of pile body.
It is assumed that the influence range of foundation pit settlement is 1.5H+ a (confidence 95%), and
The settlement influence line equation of foundation pit is given as follow:
The envelope area of influence line, i.e. the lost volume of topsoil around the pile is:
According to the statistical regularity of foundation pit of Nanjing Xishanqiao station, take α = 0.4, that is, the influence range of foundation pit settlement in Nanjing is about 2H, then
4.2 Horizontal Displacement Prediction
The displacement of wall (pile) can generally be calculated by elastic foundation beam method, bar system finite element method or field measurement, but these two algorithms have a large amount of calculation. The horizontal displacement curve of soil-rock composite stratum pile is predicted by structural model and statistical regularity.
Xie et.al [26]. used displacement method and volume method to predict here. This paper uses Gaussian curve to fit. The data regularity of the maximum horizontal displacement at a certain depth of nearly 40 test points of trial excavation can be reflected by Gaussian curve fitting. It is divided into two groups according to the soil layer thickness and rock layer thickness.
The fitting results of Gaussian curve are shown in Figure 5, and the distribution formula is listed as follows:
Where
The following Method 1, Method 2 and Method 3 are used to estimate the horizontal displacement of retaining pile. Method 1 and Method 2 adopt Gaussian simulation. The difference is that Method 1 is based on the statistical regularity between
Method 1. Gaussian curve fitting is adopted based on the statistical rule between
Here, we might as well use the statistical average value for
Method 2. If Gauss curve fitting is adopted based on the statistical rule between
Method 3. Proposed by Xie et.al. [26], the research result of foundation pit in soil-rock composite stratum for Jinhua, Zhejiang use hypobolic function to fit the horizonal displacement. It illustrates that the change rate of maximum horizontal displacement of enclosure structure decreases in a hyperbolic trend. Here also use hyperbolic fitting function to predict Nanjing’s foundation pit:
The maximum horizontal displacement depth is averaged in
4.3 Prediction Verification
4.3.1 Predict the Horizontal Displacement When the Soil Penetration Depth is More Than 15 m
According to the existing design, the depth of 8# and 10# piles crossing the soil layer is 15.54 m, and at last the foundation pit is excavated to H = 18 m. Here Method 1, Method 2 and Method 3 are used for checking and comparing with the measured data. The details are listed as follows:
According to Method 1.Take average
result is:
According to Method 2. Average y0 = 1.07 mm, average w = 6.61. If the thickness of soil layer h = 15.54m, the result is:
According to Method 3. yc average value is 1.4‰H = 25.2 m, xc average value is 11.16, the result is:
Other pile measuring points are calculated in the same way and the results are compared as shown in Figure 11A.

FIGURE 11. Comparison of horizontal displacement fitting curves of piles. (A) The thickness of soil layer :15 m. (B) The thickness of soil layer :6 m.
4.3.2 Predict the Horizontal Displacement When the Pile Depth Into the Rock is More Than 10 m
According to the existing design, 2# and 61# piles should go through the soil layer depth h = 6.2 m, the depth of pile into rock is >10 m, and the foundation pit is finally excavated to H = 18 m.
use Method 1. If the thickness of soil layer is h = 6.2m, average w = 5.99, for consideration of deep rock, take xc = 0.62H = 11.16m, take yc = 0.4‰ × 18 = 7.2mm, the result is:
use Method 2. Average y0 = 1.07 mm, average w = 5.99. If the soil thickness h = 6m, xc = 7.44. the result is:
use Method 3. Final excavation depth H = 18 m, yc average 0.4‰H 7.2mm, xc = 0.62H 11.16mm, the result is:
Other pile measuring points are calculated in the same way and the results are compared as shown in Figure 11B.
4.3.3 Verification
Comparing the horizontal displacement curves predicted by the three algorithms with the site monitoring data, it can be seen from Figures 11A,B that whether the pile is relatively deep into the soil or into the rock, the Gaussian prediction of Method 1 is relatively accurate and has little difference from the actual monitoring, and the Gaussian prediction of Method 2 and the hyperbolic prediction of Method 3 are quite different from the site monitoring data. When the pile depth into the rock is large, the hyperbola is larger than the actual monitoring value, and cannot reflect the displacement below the excavation surface of the foundation pit. In contrast, the Gaussian curve can be fully reflected, which is relatively consistent with the actual monitoring data. For the two Gaussian fitting curves, it is more accurate to predict the horizontal displacement by using the relationship between the maximum horizontal displacement and the excavation depth.
5 Conclusion
According to previous studies, we can get several conclusions as follows:
1) Based on the analysis of the monitoring data of soil-rock composite stratum of metro foundation pit in Nanjing, the average value of the maximum horizontal displacement in the section of thick soil layer is 1.4 ‰H, and the average value of the maximum horizontal displacement in the section with deep moderately weathered rock (10–12 m) is 0.4‰ H; With the increase of the excavation depth of the foundation pit, the change rate of the maximum horizontal displacement in the deep layer of the pile decreases in a hyperbolic trend; The maximum horizontal displacement depth appears at the depth of about 0.62H, which has no obvious relationship with the depth of the pile into the rock, and has an obvious linear relationship with the increase of the thickness of the soil layer. In this example, the maximum horizontal displacement of the pile in the soil-rock composite stratum is less than 2 ‰H, which can ensure the construction safety and the safety of the sideward railway.
2) The influence range of surface settlement of foundation pit excavation in soil-rock composite stratum in Nanjing is 1–2H, and the maximum settlement point is about 0.1–0.5H away from the edge of foundation pit; The average value of the maximum surface settlement is 0.2 ‰H–0.76 ‰H, and the average value is about 0.33 ‰H. The surface settlement has no obvious regularity with the increase of the thickness of the pile into the soil layer/rock layer.
3) On the basis of considering the influence range (2H) of foundation pit settlement in Nanjing soil-rock composite stratum area. According to the subsection function and relationship of settlement curve fitted by the monitoring data, the settlement curve and settlement volume near a monitoring point in this area can be effectively predicted.
4) Three calculation methods for predicting the horizontal displacement curve of rock-socketed retaining structure in soil-rock composite stratum in Nanjing are proposed. Compared with hyperbolic prediction, the Gaussian curve is in good agreement with the measured value. The prediction using the relationship between the maximum horizontal displacement and excavation depth is more accurate, which can provide a reference for the construction of rock related foundation pit of metro in this area.
Data Availability Statement
The original contributions presented in the study are included in the article/Supplementary Material, further inquiries can be directed to the corresponding author.
Author Contributions
QZ: Literature review, Analyze the data and establish a prediction theory, compare data with literature. TZ: As a construction manager, supervise the monitoring collection on site CZ: Sort out datum and draw with Origin, check the theory ZZ: As a tutor, correct the structure of article TC: As an engineer, Collect the data of Xishanqiao station RQ: As an engineer, Collect data of Jiulong Lake, Zhushan Road, Kening Road station LH: As an engineer, Collect data of Shangyuan Street, Xingting Road station.
Conflict of Interest
Authors QZ, TZ, TC and RQ were employed by the company The Fourth Engineering Co Ltd of CTCE Group. Author LH was employed by the company Nanjing Greenland Metro Line 5 Investment Development Co., Ltd.
The remaining authors declare that the research was conducted in the absence of any commercial or financial relationships that could be construed as a potential conflict of interest.
The reviewer YC declared a shared affiliation with one of the authors, ZC, to the handling editor at time of review.
Publisher’s Note
All claims expressed in this article are solely those of the authors and do not necessarily represent those of their affiliated organizations, or those of the publisher, the editors, and the reviewers. Any product that may be evaluated in this article, or claim that may be made by its manufacturer, is not guaranteed or endorsed by the publisher.
Supplementary Material
The Supplementary Material for this article can be found online at: https://www.frontiersin.org/articles/10.3389/fphy.2021.817429/full#supplementary-material
Abbreviations
References
1. Zahmatkesh A, Choobbasti AJ. Evaluation of Wall Deflections and Ground Surface Settlements in Deep Excavations. Arab J Geosci (2015) 8(5):3055–63. doi:10.1007/S12517-014-1419-6
2. Wong KS, Broms BB. Lateral Wall Deflections of Braced Excavations in Clay. J Geotechnical Eng (1989) 115(6):853–70. doi:10.1061/(Asce)0733-9410(1989)115:6(853)
3. Peck RB. Deep Excavations and Tunneling in Soft Ground [J]. Mexico: Proc Of 7th Icsmfe (1969). p. 1969225–290.
4. Ou C-Y, Hsieh P-G, Chiou DC. Characteristics of Ground Surface Settlement during Excavation. Can Geotech J (1993) 30(5):758–67. doi:10.1139/T93-068
5. Wang W, Xu Z, Wang J. Statistical Analysis of Characteristics of Ground Surface Settlement Caused by Deep Excavations in Shanghai Soft Soils [J]. Chin J Geotechnical Eng (2011) 33(11):1659–66.
6. Ying H, Yang Y, Hu A. Analysis on Observed Performance and Environmental Effect of A Deep Excavation in Soft Clay. [J] (2011) 44:90–3.
7. Zhu J, Zhu Y, Xu W. Study on Deformation Behavior of A Deep Soft Clay Excavation in Hangzhou [J]. Chin J Underground Space Eng (2018) 14(S1):335–41.
8. Cheng K, Xu R, Ying H. Performance Analysis of A 30.2 M Deep-Large Excavation in Hangzhou Soft Clay [J]. Chin J Rock Mech Eng (2021) 40(04):851–63.
9. Zhong J, Yin P, Chao T. The Diaphragm Walls Deformation Properties of Excavation for Metro Stations in Fuzhou Soft Soil Deposits [J]. Chin J Underground Space Eng (2018) 14(S2):821–7.
10. Clough GW. Construction Induced Movements of in Situ Walls [J]. Design & Performance Of Earth Retaining Structures (1990). p. 439–70.
11. Yoo C. Behavior of Braced and Anchored Walls in Soils Overlying Rock. J Geotech Geoenviron Eng (2001) 127(3):225–33. doi:10.1061/(Asce)1090-0241(2001)127:3(225)
12. Liu MW, Fang F, Liang Y. Design Method of Large-Diameter Rock-Socketed Pile with Steel Casing [J]. Iop Conf (2018) 113.
13. Leung E, Pappin J, Koo R. Determination of Small Strain Modulus and Degradation for In-Situ Weathered Rock and Old Alluvium Deposits [J]. Hong Kong and Singapore (2010). p. 1–7.
14. Basheer N, Abdel-Rahman K, Albiker J, Chakraborty T, Achmus M. Analysis of Offshore Rock Socketed Monopile Foundations Considering Stiffness Degradation [J]. Cham: Springer (2018). doi:10.1007/978-3-319-95783-8_15
15. Ai ZY, Chen YF. Fem-Bem Coupling Analysis of Vertically Loaded Rock-Socketed Pile in Multilayered Transversely Isotropic Saturated Media. Comput Geotechnics (2020) 120:103437. doi:10.1016/J.Compgeo.2019.103437
16. Huang M, Liu XL. Ground Settlement Induced by Excavation of Pile-Anchor Retaining Foundation Pits in Soil-Rock Mixed Areas [J]. Chin J Geotechnical Eng (2012) 34(S1):571–5.
17. Feng H, Liu T, Chun-Lei XU. Application of the Reinforced Cement-Soil Anchorage Pile for Deep Excavation Support Composed of Soil and Weathered Rock Stratum [J]. Chin J Geotechnical Eng (2010) 32(S2):351–4.
18. Li S. Statistical Analysis on Deformation Characteristics of Deep Foundation Pit in Xiamen Metro Project [J]. Chin J Underground Space Eng (2019) 15(S1):376–84.
19. Tong J. Research on the Key Design Technologies of the Deep Foundation Pit. In: Cobble Stratum in Chengdu Area [D]. Chengdu, China: Southwest Jiaotong University (2014). p. 22–90.
20. Chen Y, Jia P, Ji X. Investigation into the Performance of A Covered Top-Down Pit-In-Pit Deep Excavation in Shenzhen Soil-Rock Mixed Strata [J]. Arabian J Sci Eng (2021) 1–19.
21. Wang H, Qin Y, Ma Y, Zhang L. Comparative Simulation and Measurement of the Deformation Features of the Soil-Rock Deep Foundation Pit with A Positive Corner [J]. J Saf Environ 2013(004):173–8.
22. Bai XY, Chen XY, Zhang MY. "Pile - Steel Support - Anchor" System for Foundation in Rock-Soil Layer. Soil Mech Found Eng (2019) 556:425–32. doi:10.1007/S11204-019-09559-W
23. Janusz K, Zvonko T, Slobodan Z. The Soft Rock Socketed Monopile with Creep Effects – A Reliability Approach Based on Wavelet Neural Networks [J]. Arch Mining Sci (2016) 61(3):571–85.
24. Li T, Shao W, Zheng L. Analytical Solution of Retaining Pile's Deformation for Deep Soil-Stone Composite Foundation [J]. J China Univ Mining Techn (2019) 48(3):9.
25. Zhang S. Analysis of Ground Settlement Around Deep Foundation-Pit [J]. Geotechnical Eng Tech (1999)(04) 7–9.
26. Xie X, Wang L, Wei K, Shou L, Wang K. Analysis and Prediction of Excavation Behavior of Metro Deep Foundation Pit in Soils Underlain by Rock [J]. Chin J Underground Space Eng (2020) 16(No.126S1):253–60.
27. Chen M, Niu F. Deformation Compatibility Control Technique for Tunnels in Soft Strata with Mixed Soil and Rock [J]. Springer Singapore (2017). p. 95–104. doi:10.1007/978-981-10-3011-6_3
28. Wong IH. Axial Load Test Behavior of Bored Piles in Weathered Granite. Proc Tenth Asian Reg Conf Soil Mech Found Eng 1 (1995). p. 200–3.
29. Mana AI, Clough GW. Prediction of Movements for Braced Cuts in Clay [J]. Geotechnical Spec Publ (2002) 107(118):1840–58.
30. Hsieh P-G, Ou CY. Shape of Ground Surface Settlement Profiles Caused by Excavation. Can Geotech J (1998) 35(6):1004–17. doi:10.1139/T98-056
Keywords: foundation pit, deformation prediction, settlement, soil-rock composite stratum, horizontal displacement
Citation: Qin Z, Tao Z, Chen Z, Zhang Z, Tang C, Liu H and Ren Q (2022) Deformation Analysis and Prediction of Foundation Pit in Soil-Rock Composite Stratum. Front. Phys. 9:817429. doi: 10.3389/fphy.2021.817429
Received: 18 November 2021; Accepted: 09 December 2021;
Published: 26 January 2022.
Edited by:
Wei Wang, Hohai University, ChinaReviewed by:
Zheng Zhi, Guangxi University, ChinaLunyang Zhao, South China University of Technology, China
Yajun Cao, Hohai University, China
Copyright © 2022 Qin, Tao, Chen, Zhang, Tang, Liu and Ren. This is an open-access article distributed under the terms of the Creative Commons Attribution License (CC BY). The use, distribution or reproduction in other forums is permitted, provided the original author(s) and the copyright owner(s) are credited and that the original publication in this journal is cited, in accordance with accepted academic practice. No use, distribution or reproduction is permitted which does not comply with these terms.
*Correspondence: Zehong Qin, cXdlYXNkMTgzMDkyN0AxNjMuY29t
 Zehong Qin
 Zhe Tao2
 Zechao Chen
