 Zhitao Hao1†
 Ping Su
- 1Tsinghua Shenzhen International Graduate School, Tsinghua University, Shenzhen, China
- 2College of Science, Shantou University, Shantou, China
Digital holographic imaging can capture a volume of a particle field and reconstruct three-dimensional (3D) information of the volume from a two-dimensional (2D) hologram. However, it experiences a DC term, twin-images, defocus images of other particles and noise induced by the optical system. We propose the use of a U-net model to extract in-focus particles and encode the in-focus particles as squares at ground truth z. Meanwhile, zero-order images, twin-images, defocused images of other particle and noise induced by the optical system are filtered out. The central coordinate of the square represents the lateral position of the particle, and the side length of the square represents the particle diameter. The 2D raw-reconstructed images generated from the pre-processed hologram by utilizing backward Fresnel propagation serve as the input of the network. A dense block is designed and added to the encoder and decoder of the traditional U-net model. Each layer takes the inputs from all previous layers and passes the feature maps to all subsequent layers, thereby facilitating full characterization of the particles. The results show that the proposed U-net model can extract overlapping particles along the z-axis well, allowing the detection of dense particles. The use of that squares characterize particles makes it more convenient to obtain particle parameters.
Introduction
The particle fields comprise small objects, such as bubbles, biological cells, droplets. In recent years, 3D imaging has been widely used in particle detection (including shape, location, and motion) across many scientific domains, such as materials [1], chemical engineering [2–4], biology [5–7], medical sciences [8–10], and environmental science [11–13]. Digital holography (DH) encodes the 3D information of objects into a 2D hologram using the interference of the reference wave and object wave. Owning to only a single hologram can be reconstructed to restore the 3D information of the objects, DH has emerged as a powerful tool for 3D imaging in recent years. A spherical wave was first used as reference wave to observe particles distributed in water [14], the lateral position and size of each particle were gained. Thereafter, a plane wave was used as a reference wave to observe the bubbles in the air [15]. Conventional reconstruction methods have also been proposed. For example, the minimum intensity was applied to detect the edges of the bubbles from raw-reconstructed images. However, the minimum intensity method depends on the threshold setting to distinguish the particles from the background. Background noise and overlapped particles have serious effects [16]. Various criteria (such as edge sharpness and intensity distribution) [15, 17, 18] were applied to characterize the focus level of particles. However, these criteria are sensitive to the detailed characteristics and noise level in the holograms, limiting their application in low-concentration particle fields with low background and cross-interference noise. The deconvolution method [19, 20] models the observed blur in 3D reconstruction as the convolution of an object and a point spread function (PSF). However, the PSF must be based on the known diffraction formula or obtained through a hologram of a point-like object in the experiment. The compressive holography method [21–23] is an effective reconstruction method to eliminate noise because of the sparsity of the signal, but it is time-consuming and requires complicated fine-tuning parameters to obtain optimal results.
Recently, machine learning using deep neural networks (DNNs) [24] has been applied to image analysis. First, the application of deep learning in DH appeared in medical examination [25–28, 34] as well as in the classification of particles in holograms [29, 30]. DNNs were also applied to acquire the depth information of particles [31, 32], and autofocus is accomplished. Further studies have reported impressive results using DNNs for phase recovery [25, 33], phase aberration compensation [34, 35], hologram pixel super-resolution [36, 37] and digital holographic reconstruction [38–40]. Shimobaba et al. [41] first used a U-net model [42] to realize the holographic reconstruction of multiple particles. Shao et al. [43] proposed a U-net model to reconstruct hologram with higher-concentration particles. However, the sizes of the particles were not obtained. Li et al. [44] proposed using a short U-net with average pooling to extract in-focus particles at ground truth z and remove zero-order images, twin-images, and the defocused images of other particles from raw-reconstructed images; lateral position and the size of particles were obtained. However, it is complicated to obtain parameters of particles that are assumed to be circles [45]. Wu et al. [46] proposed the Dense-U-net and obtained particle information directly from the hologram and encoded them into a series of rectangles because it is convenient to identify and calculate the length and width of the rectangles. However, it is difficult to find completely overlapped particles along the z-axis from one single hologram. Inspired by the previous study, we found that encoding in-focus particles into squares is more conducive to the extraction of particle parameters. Simultaneously, to distinguish the particles completely overlapping along the z-axis, it will be better to train the neural network by feeding raw-reconstructed images that are generated from a hologram.
In this study, we propose the use of a U-net network to extract in-focus particles from raw-reconstructed images and encode them into a series of squares. The center coordinate of the square represents the lateral position of the particle, and the side length of the square represents the diameter of the particle. The rest of the paper is organized as follows: hologram preparation, U-net model, and characterization method are introduced in Principles. In Simulation Results the simulation results are presented. Experiment results are introduced in Experimental Results. The discussion is presented in Evaluation and Discussions. Finally, the conclusions are summarized in Conclusion.
Principles
Holography and Fresnel Diffraction Algorithm
Suppose there are n particles in the particle field in Figure 1A, each particle pi has a different size and different distance zi away from the camera. When a plane wave R(x, y) illuminates the particle field, the Fresnel diffraction [47] of each particle on the sensor plane is depicted in Eq. 1, and the object wave O(x, y), which is the coherent superposition of the diffraction fields by all the particles is shown in Eq. 2. The hologram is recorded on the sensor plane, which is the interference of R(x, y) and O(x, y). This process is depicted in Eq. 3.
Here
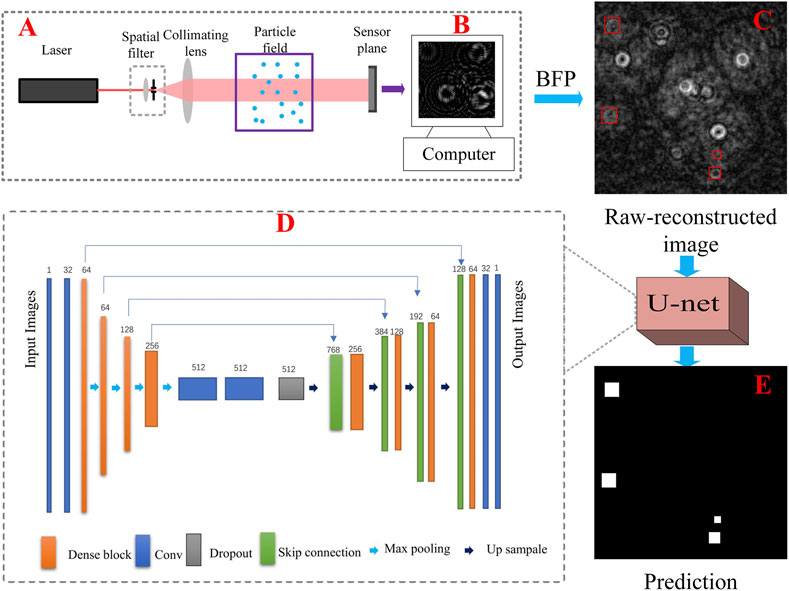
FIGURE 1. (A) In-line digital holographic experimental setup; (B) pre-processed hologram; (C) raw-reconstructed image at 5,238 μm; (D) the proposed U-net model; (E) the predicted image of the U-net model corresponding to (C).
Particle Characterization Method
Each particle in a particle field is characterized by
U-Net Model
A U-net model can be regarded as a black box. When many images are fed into it, the model learn the features of these images and obtain the mapping function
Where
The proposed model, which is shown in Figure 1D, includes four down-samplings and four up-samplings. A dropout layer is applied to prevent overfitting. To simplify the training process, a residual neural network (ResNet) [49] is used to form a dense block. Each dense block consists of two Conv_Blocks which contains convolution, batch standardization, and activation layer. The output of each dense block is connected to the input of the dense block via a skip connection structure, which combines the high signal-to-noise ratio and the low signal-to-noise ratio features of the images for training in the deeper stages of the network. In this section, the raw-reconstructed images serve as the input of the U-net model. The images shown in Figure 1E serve as output of the proposed model, meanwhile, mean square error is applied as the loss function of the model.
Simulation Results
In the simulation section, we use the same Mie scattering model [48] to obtain the original particles. 51 holograms with the size of 256 × 256 are generated. A hologram shown in Figure 2A contains a volume
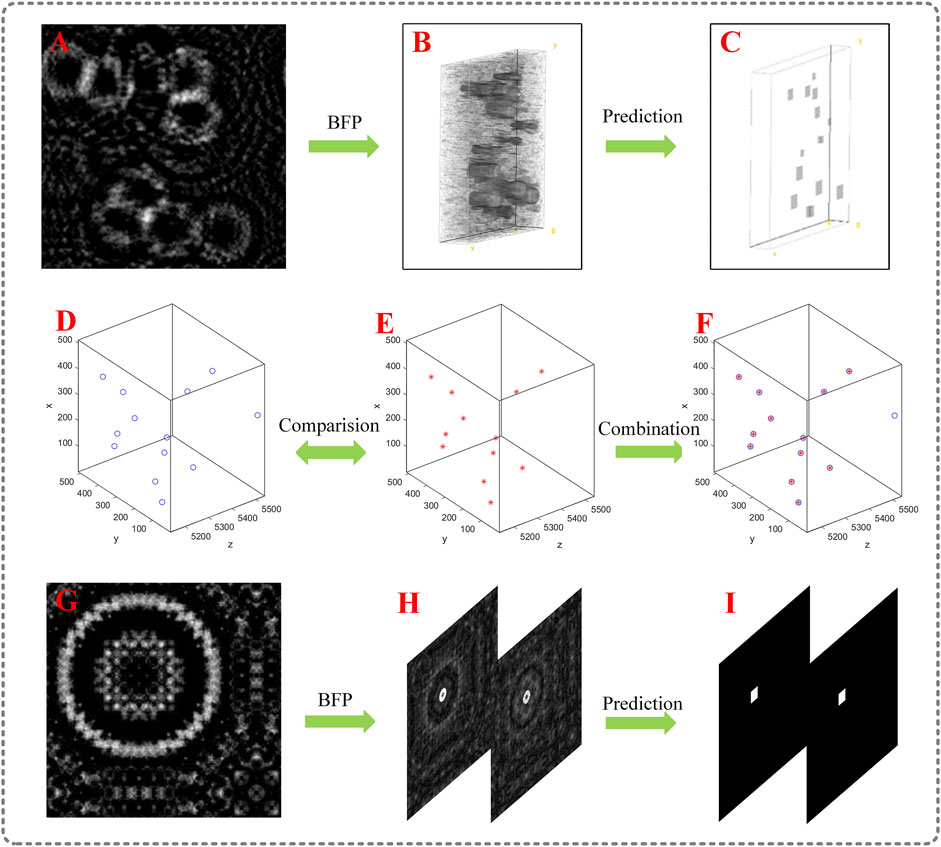
FIGURE 2. Simulation result; (A) a pre-processed hologram with multiple particles; (B) the reconstruction of (A) using BFP; (C) prediction of (B) by the U-net model; (D) ground truth position of the particle field, the blue circles represent ground truth particles; (E) 3D predicted position of the particle field by extracting the information in (C); (F) Combination of ground truth and prediction; (G) a pre-processed hologram with overlapped particles; (H) raw-reconstructed images of (G); (I) prediction corresponding to (H).
The hologram in Figure 2A is first used to test the model. The raw-reconstructed volume comprised five raw-reconstructed images is shown in Figure 2B. The corresponding predictions are presented in Figure 2C. We observe that the in-focus particles are extracted from the noisy images and encoded into squares, and the noise is filtered out. Hence, we obtain the coordinates and side lengths of the squares. The coordinates and the diameters are acquired, and the predicted location of particles are depicted in Figure 2E. The ground-truth distribution of the particle field is shown in Figure 2D. Figure 2F is the combination of ground truth and prediction; the coincidence of the blue circles and red dots represents the correct prediction, and the single blue circle represents the unpredicted particle. Figure 2G also shows a pre-processed hologram comprised of two overlapped particles along the z-axis, in which the spacing between the two particles equals the theoretical axial resolution of DH system (10 mm). The diameter of the particles equals 40 μm. The raw-reconstructed images of Figure 2G are depicted in Figure 2H. Figure 2I is the corresponding prediction of Figure 2H. We observe that the overlapped particles are successfully extracted at ground truth z. The theoretical axial resolution reaches 100 μm when a 10× microscope objectives (MO) is used. 75 raw-reconstructed images corresponding to 15 holograms with the same specifications but different particle distributions are generated for testing. The extraction rate of the particle field is 95.8%, and the lateral positioning error was less than 2 μm. The error of diameter is less than 4 μm. Simulation results show that the U-net network is successful in extracting the information of in-focus particles from the raw-reconstructed images at ground truth z and encoding them into squares. Zero-order images, twin-images, and defocused images of other particles are filtered out simultaneously. When compared with [44], squares are more conducive to extracting particle parameters than circles. Compared with [46], this study can easily distinguish particles with the same lateral position when the depth spacing is greater than 100
Experimental Results
Figure 3 shows the experimental setup, in which the wavelength of the laser is 632.8
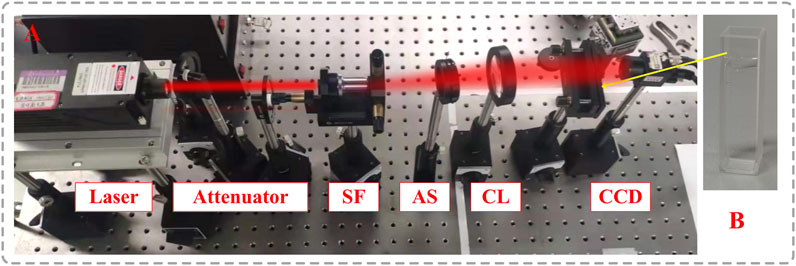
FIGURE 3. (A) Experimental setup, laser, attenuators, spatial filter, SF; aperture stop, AS; collimating lens, CL; particle field, and CCD; (B) particle field in a cuvette.
In the experiment, the holograms have different features from the holograms in simulation because they are composed of noise induced by the optical system (especially the laser). Therefore, a new model was trained using the dataset obtained in experiment. We use polystyrene spheres distributed in milli-Q water shown in Figure 3B to generate the first dataset (Supplementary Material), 60 holograms are obtained. And the second dataset containing 20 holograms is created using the method described below. The particles are deposited between every two adjacent slides in three slides, as shown in Figure 4D. The z-axis position of each slice is similar. Raw-reconstructed images in the dataset are generated by reversed holograms
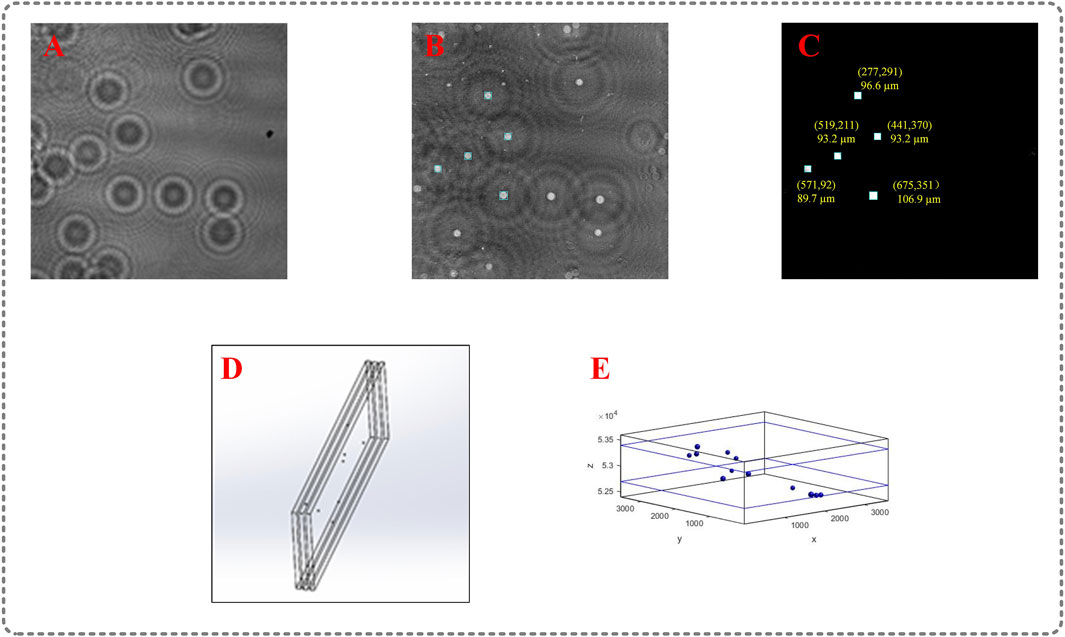
FIGURE 4. Experimental result; (A) captured hologram with multiple particles; (B) the raw-reconstructed image at 52.7 mm; (C) prediction of the U-net model; (D) particle field of the second dataset; (E) 3D distribution of particle field.
Evaluation and Discussions
As shown in Figure 4C, the in-focus particles in Figure 4B are properly restored, and the shapes of all the particles are squares, we can find squares to locate the lateral position of each particle, including the center coordinate and the diameter of each particle. As depicted in Figure 4E, the particle field is restored successfully. The positioning error is less than 3.45 μm (1 pixel) in the x, y directions, the error of diameter is less than 6.9 μm (2 pixel). The holograms are reconstructed when the depth spacing equals 200 μm. We use polystyrene spheres distributed in the milli-Q water to obtain one dataset, and we make the second dataset through adhering particles between every two adjacent slides in three slides because 1) the particles in the second dataset we make are few and scattered, which ensures the correctness of the lateral position of particles, 2) The thickness of the slides is known, so the depth spacing is certain, which is helpful to determine the position of particles along the z-axis. However, as the number of slides increases, the captured hologram is of poor quality. This may be primarily because the slides are not completely perpendicular to the optical axis of the optical system and noise is induced by the slides, therefore, we chose the simplest way by using three slides to divide the particles into two slices. Finally, the simulation and experimental results show that the proposed method is promising, and the time to obtain the prediction of a hologram is less than 96 s, which is much faster than the conventional iterative optimization methods. The raw-reconstructed images are trained to match the ground truth images that in-focus particles are encoded into squares to easily obtain the information of the particles.
Conclusion
In this study, a U-net model is used to extract in-focus particles from the raw-reconstructed images at ground truth z and encode them into squares. Zero-order images, twin-images, defocused images of other particles and noise induced by the optical system are filtered out simultaneously. The center of the square represents the center of the particle, and the side length of the square represents the diameter of the particle. Finally, the information for each particle is obtained. We used squares instead of circles to represent particles because the squares are more convenient to acquire information of particles. The simulation and experimental results demonstrate that the proposed model is feasible. Eventually, a 3D particle field is restored.
Data Availability Statement
The raw data supporting the conclusions of this article will be made available by the authors, without undue reservation.
Author Contributions
ZH, WL, and PS performed the research and wrote the manuscript. BH assisted in the experiment. All authors have read and approved the content of the manuscript.
Funding
This work was supported by Guangdong Basic and Applied Basic Research Foundation (2019A1515110674), Shenzhen basic research key project (JCYJ20200109143031287).
Conflict of Interest
The authors declare that the research was conducted in the absence of any commercial or financial relationships that could be construed as a potential conflict of interest.
Publisher’s Note
All claims expressed in this article are solely those of the authors and do not necessarily represent those of their affiliated organizations, or those of the publisher, the editors and the reviewers. Any product that may be evaluated in this article, or claim that may be made by its manufacturer, is not guaranteed or endorsed by the publisher.
Supplementary Material
The Supplementary Material for this article can be found online at: https://www.frontiersin.org/articles/10.3389/fphy.2021.816158/full#supplementary-material
References
1. Batenburg KJ, Bals S, Sijbers J, Kübel C, Midgley PA, Hernandez JC, et al. 3D Imaging of Nanomaterials by Discrete Tomography. Ultramicroscopy (2009) 109(6):730–40. doi:10.1016/j.ultramic.2009.01.009
2. Yu J, Wu C, Sahu SP, Fernando LP, Szymanski C, McNeill J. Nanoscale 3D Tracking with Conjugated Polymer Nanoparticles. J Am Chem Soc (2009) 131(51):18410–4. doi:10.1021/ja907228q
3. Wang A, Marashdeh Q, Fan L-S. ECVT Imaging of 3D Spiral Bubble Plume Structures in Gas-Liquid Bubble Columns. Can J Chem Eng (2014) 92(12):2078–87. doi:10.1002/cjce.22070
4. Wu X, Li X, Yao L, Wu Y, Lin X, Chen L, et al. Accurate Detection of Small Particles in Digital Holography Using Fully Convolutional Networks. Appl Opt (2019) 58(34):G332–G44. doi:10.1364/AO.58.00G332
5. Prevedel R, Yoon Y-G, Hoffmann M, Pak N, Wetzstein G, Kato S, et al. Simultaneous Whole-Animal 3D Imaging of Neuronal Activity Using Light-Field Microscopy. Nat Methods (2014) 11(7):727–30. doi:10.1038/nmeth.2964
6. Kumar SS, Sun Y, Zou S, Hong J. 3D Holographic Observatory for Long-Term Monitoring of Complex Behaviors in Drosophila. Sci Rep (2016) 6:33001. doi:10.1038/srep33001
7. Adams JK, Boominathan V, Avants BW, Vercosa DG, Ye F, Baraniuk RG, et al. Single-frame 3D Fluorescence Microscopy with Ultraminiature Lensless FlatScope. Sci Adv (2017) 3(12):e1701548. doi:10.1126/sciadv.1701548
8. Choi Y-S, Lee S-J. Three-dimensional Volumetric Measurement of Red Blood Cell Motion Using Digital Holographic Microscopy. Appl Opt (2009) 48(16):2983–90. doi:10.1364/AO.48.002983
9. Su T-W, Xue L, Ozcan A. High-throughput Lensfree 3D Tracking of Human Sperms Reveals Rare Statistics of Helical Trajectories. Proc Natl Acad Sci (2012) 109(40):16018–22. doi:10.1073/pnas.1212506109
10. Taute KM, Gude S, Tans SJ, Shimizu TS. High-throughput 3D Tracking of Bacteria on a Standard Phase Contrast Microscope. Nat Commun (2015) 6(1). doi:10.1038/ncomms9776
11. Ekvall MT, Bianco G, Linse S, Linke H, Bäckman J, Hansson L-A, et al. Three-Dimensional Tracking of Small Aquatic Organisms Using Fluorescent Nanoparticles. PLoS ONE (2013) 8(11):e78498. doi:10.1371/journal.pone.0078498
12. Beals MJ, Fugal JP, Shaw RA, Lu J, Spuler SM, Stith JL. Holographic Measurements of Inhomogeneous Cloud Mixing at the Centimeter Scale. Science (2015) 350(6256):87–90. doi:10.1126/science.aab0751
13. Lindensmith CA, Rider S, Bedrossian M, Wallace JK, Serabyn E, Showalter GM, et al. A Submersible, off-Axis Holographic Microscope for Detection of Microbial Motility and Morphology in Aqueous and Icy Environments. PLOS ONE (2016) 11(1):e0147700. doi:10.1371/journal.pone.0147700
14. Darakis E, Khanam T, Rajendran A, Kariwala V, Naughton TJ, Asundi AK. Microparticle Characterization Using Digital Holography. Chem Eng Sci (2010) 65(2):1037–44. doi:10.1016/j.ces.2009.09.057
15. Tian L, Loomis N, Domínguez-Caballero JA, Barbastathis G. Quantitative Measurement of Size and Three-Dimensional Position of Fast-Moving Bubbles in Air-Water Mixture Flows Using Digital Holography. Appl Opt (2010) 49(9):1549–54. doi:10.1364/AO.49.001549
16. Malek M, Allano D, Coëtmellec S, Lebrun D. Digital In-Line Holography: Influence of the Shadow Density on Particle Field. Opt Express (2004) 12(10):2270–9. doi:10.1364/OPEX.12.002270
17. Shao S, Li C, Hong J. A Hybrid Image Processing Method for Measuring 3D Bubble Distribution Using Digital Inline Holography. Chem Eng Sci (2019) 207:929–41. doi:10.1016/j.ces.2019.07.009
18. Guildenbecher DR, Gao J, Reu PL, Chen J. Digital Holography Simulations and Experiments to Quantify the Accuracy of 3D Particle Location and 2D Sizing Using a Proposed Hybrid Method. Appl Opt (2013) 52(16):3790–801. doi:10.1364/AO.52.003790
19. Latychevskaia T, Gehri F, Fink H-W. Depth-resolved Holographic Reconstructions by Three-Dimensional Deconvolution. Opt Express (2010) 18(21):22527–44. doi:10.1364/OE.18.022527
20. Latychevskaia T, Fink H-W. Holographic Time-Resolved Particle Tracking by Means of Three-Dimensional Volumetric Deconvolution. Opt Express (2014) 22(17):20994–1003. doi:10.1364/OE.22.020994
21. Brady DJ, Choi K, Marks DL, Horisaki R, Lim S. Compressive Holography. Opt Express (2009) 17(15):13040–9. doi:10.1364/OE.17.013040
22. Li W-N, Zhang Z, Su P, Ma J, Wang X. Removal of Defocused Images Using Three-Dimensional Nonlinear Diffusion Based on Digital Holography. J Opt (2019) 22(1):015701. doi:10.1088/2040-8986/ab5bad
23. Chen W, Tian L, Rehman S, Zhang Z, Lee HP, Barbastathis G. Empirical Concentration Bounds for Compressive Holographic Bubble Imaging Based on a Mie Scattering Model. Opt Express (2015) 23(4):4715–25. doi:10.1364/OE.23.004715
24. Barbastathis G, Ozcan A, Situ G. On the Use of Deep Learning for Computational Imaging. Optica (2019) 6(8):921–43. doi:10.1364/OPTICA.6.000921
25. Wu Y, Rivenson Y, Zhang Y, Wei Z, Günaydin H, Lin X, et al. Extended Depth-Of-Field in Holographic Imaging Using Deep-Learning-Based Autofocusing and Phase Recovery. Optica (2018) 5(6):704–10. doi:10.1364/OPTICA.5.000704
26. Wang H, Lyu M, Situ G. eHoloNet: a Learning-Based End-To-End Approach for In-Line Digital Holographic Reconstruction. Opt Express (2018) 26(18):22603–14. doi:10.1364/OE.26.022603
27. Liu T, de Haan K, Rivenson Y, Wei Z, Zeng X, Zhang Y, et al. Deep Learning-Based Super-resolution in Coherent Imaging Systems. Sci Rep (2019) 9(1):3926. doi:10.1038/s41598-019-40554-1
28. Liu T, Wei Z, Rivenson Y, Haan K, Zhang Y, Wu Y, et al. Deep Learning‐based Color Holographic Microscopy. J Biophotonics (2019) 12(11):e201900107. doi:10.1002/jbio.201900107
29. Gӧrӧcs Z, Tamamitsu M, Bianco V, Wolf P, Roy S, Shindo K, et al. A Deep Learning-Enabled Portable Imaging Flow Cytometer for Cost-Effective, High-Throughput, and Label-free Analysis of Natural Water Samples. Light Sci Appl (2018) 7(1):66. doi:10.1038/s41377-018-0067-0
30. O’Connor T, Anand A, Andemariam B, Javidi B. Deep Learning-Based Cell Identification and Disease Diagnosis Using Spatio-Temporal Cellular Dynamics in Compact Digital Holographic Microscopy. Biomed Opt Express (2020) 11(8):4491–508. doi:10.1364/BOE.399020
31. Ren Z, Xu Z, Lam EY. Learning-based Nonparametric Autofocusing for Digital Holography. Optica (2018) 5(4):337–44. doi:10.1364/OPTICA.5.000337
32.R Zhenbo, X Zhimin, and YL Edmund, editors. Autofocusing in Digital Holography Using Deep Learning. San Francisco, CA: ProcSPIE (2018).
33. Rivenson Y, Zhang Y, Günaydın H, Teng D, Ozcan A. Phase Recovery and Holographic Image Reconstruction Using Deep Learning in Neural Networks. Light Sci Appl (2018) 7(2):17141. doi:10.1038/lsa.2017.141
34. Liu S, Lian Q, Xu Z. Phase Aberration Compensation for Digital Holographic Microscopy Based on Double Fitting and Background Segmentation. Opt Lasers Eng (2019) 115:238–42. doi:10.1016/j.optlaseng.2018.12.001
35. Nguyen T, Bui V, Lam V, Raub CB, Chang L-C, Nehmetallah G. Automatic Phase Aberration Compensation for Digital Holographic Microscopy Based on Deep Learning Background Detection. Opt Express (2017) 25(13):15043–57. doi:10.1364/oe.25.015043
36. Luo Z, Yurt A, Stahl R, Lambrechts A, Reumers V, Braeken D, et al. Pixel Super-resolution for Lens-free Holographic Microscopy Using Deep Learning Neural Networks. Opt Express (2019) 27(10):13581–95. doi:10.1364/OE.27.013581
37. de Souza JC, Freire RBR, dos Santos PAM. Compressive Holography with Resolution Improvement and Lensless Adjustable Magnification. Opt Commun (2019) 437:337–41. doi:10.1016/j.optcom.2018.12.081
38. Zeng T, So HK-H, Lam EY. RedCap: Residual Encoder-Decoder Capsule Network for Holographic Image Reconstruction. Opt Express (2020) 28(4):4876–87. doi:10.1364/OE.383350
39. Wang K, Kemao Q, Di J, Zhao J. Y4-Net: a Deep Learning Solution to One-Shot Dual-Wavelength Digital Holographic Reconstruction. Opt Lett (2020) 45(15):4220–3. doi:10.1364/OL.395445
40. Go T, Lee S, You D, Lee SJ. Deep Learning-Based Hologram Generation Using a white Light Source. Sci Rep (2020) 10(1):8977. doi:10.1038/s41598-020-65716-4
41. Shimobaba T, Takahashi T, Yamamoto Y, Endo Y, Shiraki A, Nishitsuji T, et al. Digital Holographic Particle Volume Reconstruction Using a Deep Neural Network. Appl Opt (2019) 58(8):1900–6. doi:10.1364/AO.58.001900
42. Ronneberger O, Fischer P, Brox T. U-net: Convolutional Networks for Biomedical Image Segmentation. In: International Conference on Medical Image Computing and Computer-Assisted Intervention (2015).
43. Shao S, Mallery K, Kumar SS, Hong J. Machine Learning Holography for 3D Particle Field Imaging. Opt Express (2020) 28(3):2987–99. PubMed PMID: 32121975. doi:10.1364/OE.379480
44. Li W-N, Su P, Ma J, Wang X. Short U-Net Model with Average Pooling Based on In-Line Digital Holography for Simultaneous Restoration of Multiple Particles. Opt Lasers Eng (2021) 139:106449. doi:10.1016/j.optlaseng.2020.106449
45. Fish J, Scrimgeour J. Fast Weighted Centroid Algorithm for Single Particle Localization Near the Information Limit. Appl Opt (2015) 54(20):6360–6. doi:10.1364/AO.54.006360
46. Wu Y, Wu J, Jin S, Cao L, Jin G. Dense-U-net: Dense Encoder-Decoder Network for Holographic Imaging of 3D Particle fields. Opt Commun (2021) 493:126970. doi:10.1016/j.optcom.2021.126970
48. Bohren CF, Huffman DR. Absorption and Scattering of Light by Small Particles. Weinheim, Germany: Wiley-VCH Verlag GmbH (1998).
49.K He, X Zhang, S Ren, and J Sun, editors. Deep Residual Learning for Image Recognition. In:IEEE Conference on Computer Vision and Pattern Recognition (CVPR), 27-30 June 2016 (2016).
Keywords: digital holography, particle imaging, 3D imaging, U-net, image reconstruction
Citation: Hao Z, Li W-N, Hou B, Su P and Ma J (2022) Characterization Method for Particle Extraction From Raw-Reconstructed Images Using U-Net. Front. Phys. 9:816158. doi: 10.3389/fphy.2021.816158
Received: 16 November 2021; Accepted: 16 December 2021;
Published: 01 February 2022.
Edited by:
Jianglei Di, Guangdong University of Technology, ChinaReviewed by:
Zhenbo Ren, Northwestern Polytechnical University, ChinaJiachen Wu, Tsinghua University, China
Copyright © 2022 Hao, Li, Hou, Su and Ma. This is an open-access article distributed under the terms of the Creative Commons Attribution License (CC BY). The use, distribution or reproduction in other forums is permitted, provided the original author(s) and the copyright owner(s) are credited and that the original publication in this journal is cited, in accordance with accepted academic practice. No use, distribution or reproduction is permitted which does not comply with these terms.
*Correspondence: Ping Su, c3UucGluZ0Bzei50c2luZ2h1YS5lZHUuY24=
†These authors have contributed equally to this work