- 1Key Laboratory of Ministry of Education for Geomechanics and Embankment Engineering, Hohai University, Nanjing, China
- 2Research Institute of Geotechnical Engineering, Hohai University, Nanjing, China
Numerical simulation analysis of landslide-induced surge wave field characteristics offers great insights for engineering practices and is crucial for studying reservoir landslide disaster warning, prevention, and control. Based on the computational fluid dynamics, a numerical calculation model of typical landslide surge was established, and the surge waves caused by the movement of a rigid landslide body along the slope and its propagation process was to simulated and analyzed. The results were compared with classical physical experiments to validate the applicability of the numerical calculation model. Furthermore, effects of the shape and density of landslide body on the surge wave generation, water entry characteristics of landslide body, propagation pattern of surge waves were also studied. It was showed that the starting position of far-field landslide surge negatively correlated with the landslide body density. The shape of landslide body did not substantially impact the far-field starting position, which was mainly influenced by the area of water surface in contact with the sliding body.
Introduction
Reservoir bank landslide surges and their subsequent disaster chain are key factors that cause disasters and are being studied worldwide. These surges undermine the engineering safety of reservoir and dam projects and the ecological environment in the reservoir area. Studying the propagation characteristics of reservoir bank landslide surge can provide support and scientific grounds for the design, construction, and safe operation of high dam projects, and is theoretically significant in offering insights into engineering practices.
So far, hydrodynamic theories and numerical analysis have played important roles in characterizing the surge wave propagation in reservoir bank landslides. Zhou et al. [1] developed the GEO-FLOW program based on the shallow water control equations to numerically evaluate the dynamic processes of landslide surge propagation. Deng et al [2]. 1 simulated the two-dimensional landslide surge process using the finite volume method in FLUENT software. In addition to the traditional finite difference and finite element methods, the Smoothed Particle Hydrodynamics method has also been applied to simulate surge waves. Tan et al. [3] employed a coupled digital elevation modeling-SPH model to simulate the surge wave characteristics of a loose landslide on water by considering the lubricating effect of water in the landslide. Noda [4] proposed that the landslide body could be simplified as a rigid rectangular box with a drop height greater than static water depth and ignored the effect of the height of the landslide on the surge. Liu et al. [5] derived the analytical solution for the surge generated by a two-dimensional landslide block moving down a slope based on one-dimensional linear phreatic equations. Yim et al. [6] used the unsteady-state Reynolds-averaged N-S equations and the SPH method to simulate the surge generated by free fall of a rigid rectangular body, where the dynamic balance of the forces acting on the rigid body determined its displacement. Du et al. [7] used a new Method of extending TPDP-MPM to landslide surge problem. Tan et al. [8] proposed a hybrid DEM-SPH model to simulate landslides and reproduce the surge waves generated by them and concluded that the lubrication of the solid particles and the drag effect are important effects influencing the underwater landslide movement.
Physical model tests can also delineate landslide surge propagation characteristics. The current landslide surge test models generally classify the landslide body into two categories: rigid body (blocky rock landslide) and granular materials (granular landslide). Wiegel [9] simulated surge wave generation by vertically dropping rigid blocks through a two-dimensional flume and found that the generated surge waves were dispersed, and their maximum wave amplitude was closely related to the weight of the block. Walder et al. [10] also applied the two-dimensional flume model to investigate the near-field surge wave propagation characteristics of landslides. They derived a dimensionless formula for the maximum amplitude of the near-field surge wave according to the Euler equations. Apart from these, some researchers have also applied three-dimensional landslide models to determine surge wave characteristics. Assuming that the generated 3D radial surge waves were symmetrical along the main movement direction of the landslide body in a 3D block landslide experiment. Panizzo et al. [11] proposed new prediction equations that incorporated the underwater movement time of the landslide, which was considered as a major influencing factor for the primary wave height based on the experiments by Watts [12]. Liu et al. [13] carried out landslide surge experiment and found that the lower the wave height, the higher the propagation speed to the front of the dam. Through physical experiments, Xu et al. [14] analyzed the failure mechanism of surge to landslide dam, and obtained the contact area and the landslide height have a significant impact on the dam-break surge.
Most of the abovementioned research focused on the near-field surge characteristics of landslides to delineate surge features of near-dam reservoir bank landslides. However, these studies were not applicable to the simulation of catastrophic landslide-induced surge wave disasters in a reservoir area far from the high dams. Hence, it is important to divide landslide surge propagation processes into near-field and far-field to further investigate their surge-wave propagation characteristics. This study applied a computational fluid dynamics approach to establish computational programs for near-field and far-field propagation processes. The model was verified by relevant physical model tests of landslide-induced waves in rigid bodies. Furthermore, this study explored the characteristics of various shapes and the density of the slide block body and landslide body when moving into the water to determine the near-field and far-field propagation patterns of landslide-induced surges of rigid bodies.
Landslide-Induced Surge Propagation Dynamics Model and Validation
A unique free-surface tracking algorithm (volume of fluid, VOF) based on computational fluid dynamics was used to track the liquid-liquid or liquid-solid interfaces. A finite difference method, which was established using a multi-grid modeling approach, was adopted to solve three-dimensional Navier-Stokes equations. The VOF algorithm introduced volume fraction variables for individual phases and determined the relative variable relation by calculating the volume fraction within the control cell. The volume fraction of the mth phase within a given control cell was denoted as θm (0 ≤ θm ≤ 1). When θm = 0, the mth phase does not exist in the control cell; when θm = 1, the control cell is filled with the mth phase; when 0 ≤ θm ≤ 1, the control cell contains a multi-phase interface. Within the control cell, the sum of the volume fractions of multiple phases is 1
Control Equations of the Landslide-Induced Surge Propagation Process
Continuity equation:
Momentum equations:
where ρ is the density of water, VF is the volume fraction of the fluid, (
Initial and Boundary Conditions
Kinematic boundary conditions:
where η is the height of the wave surface, g is the acceleration of gravity (9.81 m/s2), and
Dynamic boundary conditions:
The bottom boundary of the computational domain was set as a solid-wall no-slip boundary, which required the fluid velocity gradient and flow variables to be zero at the fluid-solid interface. The upper part of the flume was set as a free surface boundary, which required the liquid pressure to be equal to the gas pressure and the normal velocity on the free surface to be zero. The remaining four boundaries were symmetric and required that zero flow flux and shear stress. Initially, the water surface was not impacted by the landslide body and remained stationary. The initial velocity of the landslide body was zero.
Model Validation
To validate the performance of the numerical simulation, the physical experiment by Heinrich [15] was used as the reference standard for comparison. The landslide surge experiment was conducted in a flume (20 m length, 0.55 m width, and 1.5 m height). The size of the sliding block was 0.5 × 0.5 m in the form of an isosceles right triangle. Smooth sliding surfaces were used in the experiment without considering the deformation of the block. The degree of the slope was 45°, and the water depth was 0.4 m. Initially, the bottom of the block was only in contact with the hydrostatic surface, making it a subaerial landslide. Under the influence of gravity, the block freely moves along the slope and stops when it reaches the bottom. The calculated parameters in the numerical simulation were consistent with the parameters obtained from the physical experiment, and the weight was 2,282 kg/m3. The landslide model input data is shown in Table 1. The numerical simulation model is shown in Figure 1.
Variations of the free surface levels at points A (x = 4 m), B (x = 8 m), and C (x = 12 m) were extracted and compared with the physical experiment model for validation. Dots and lines represent the results of the physical experiment and the numerical simulation, respectively (Figure 2).
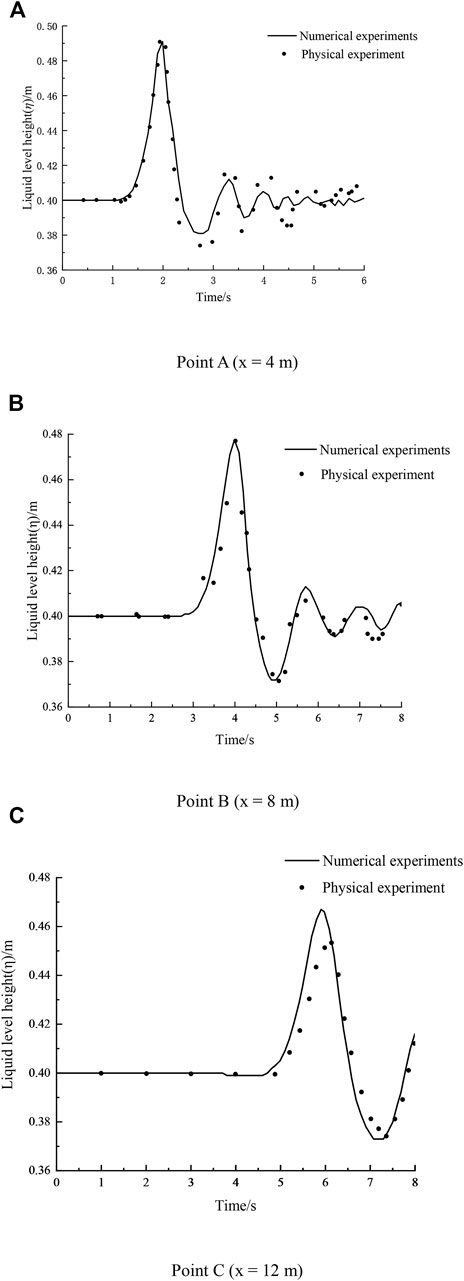
FIGURE 2. Comparison of liquid surface levels at different locations. (A) Point A (x = 4 m), (B) Point B (x = 8 m), and (C) Point C (x = 12 m).
The numerical simulation results of this study (Figure 2A) agreed well with Henrich’s test results. Both generated the maximum wave height and the first peak (1.96 s). The experiment showed that the maximum crest was 0.907 m above the water surface, and the numerical simulation revealed that the maximum crest was 0.91 m above the water surface, with a relative error of 3.3% compared to the experimental result. The trough first appeared at 2.72 s. The experiment showed that the trough was located 0.0261 m below the water surface. The first trough of the numerical simulation about occurred at 2.72 s. The trough was calculated to be 0.019 m below the initial water surface with an error of 2.72%.
Figure 2B indicates that the maximum wave height has decayed. At 4 s, the maximum height of the physical experiment was 0.77 m above the water surface, while the numerical simulation showed a maximum crest of 0.776 m above the water surface. Both results showed almost the same height, which was lower than the peak height at point A. The second crest occurred at 5.7 s, which was significantly lower than the height of the previous crest but slightly higher than the test value. Two primary reasons might explain this observation: First, in the numerical simulation, the bottom and side walls of the flume were assumed to be smooth with no friction, neglecting the effects of roughness and frictional resistance on the water flow. Second, in the physical experiment, a rubber baffle was placed near the bottom of the flume in order to suddenly stop the sliding block when it reached the bottom of the flume; the collision and energy dissipation between the block and the baffle were omitted in the numerical simulation.
Both the physical experiment and the numerical simulation results showed a lower crest at point C than the peak height at point B (Figure 2C), which occurred at ∼5.86 s for both events.
The comparison analysis concluded that the occurrence time of both peaks in the numerical simulation and physical experiments coincided, indicating the calculation results were consistent with the physical experiment. The numerical calculation based on computational fluid dynamics was highly accurate for the simulation of landslide-induced surge wave generation and propagation processes. The results of this study were effectively validated for simulating surge wave propagation processes caused by a reservoir-bank landslide.
Study of Landslide-Induced Surge Characteristics
Near-Field and Far-Field Division
In recent years, numerous studies have been conducted in China regarding the near-field characteristics of landslide-induced surge waves. Ke et al. [16] analyzed the formation mechanism of landslide-induced surges and the characteristics of the initial surge wave form in the near-field area based on a physical model test. However, these research outcomes focused on the generation and propagation processes of landslide-induced surges and did not numerically verify the water wave characteristics of near-field and far-field landslide surges. Few researchers have explored the differences in the near-field and far-field of landslide surge waves. Two forms of energy are involved in the propagation of gravity waves: kinetic energy, which is the energy inherent in the movement of water particles; and potential energy, which is the energy generated by the displacement of particles from their average position. The energy of a wave generated by a landslide-induced surge is the sum of the kinetic and potential energy of the vibration. According to Fritz et al. [17] the potential energy of surge waves and kinetic energy generated by the landslide body entering water are defined as follows.
Numerical Experimental Study of Field
This study adopted the sliding block shape used by Lo et al. [18] (Figure 3). The experiment was done in a flume with a width of 0.55 m, 30 m length, and a water depth (h) of 2 m. The slope angle was 45°, the shape of the block was parabolic, with the specific shape equation:
where B(θ) is the block shape function and H(θ) is a step function. The length of the bottom of the slide block is
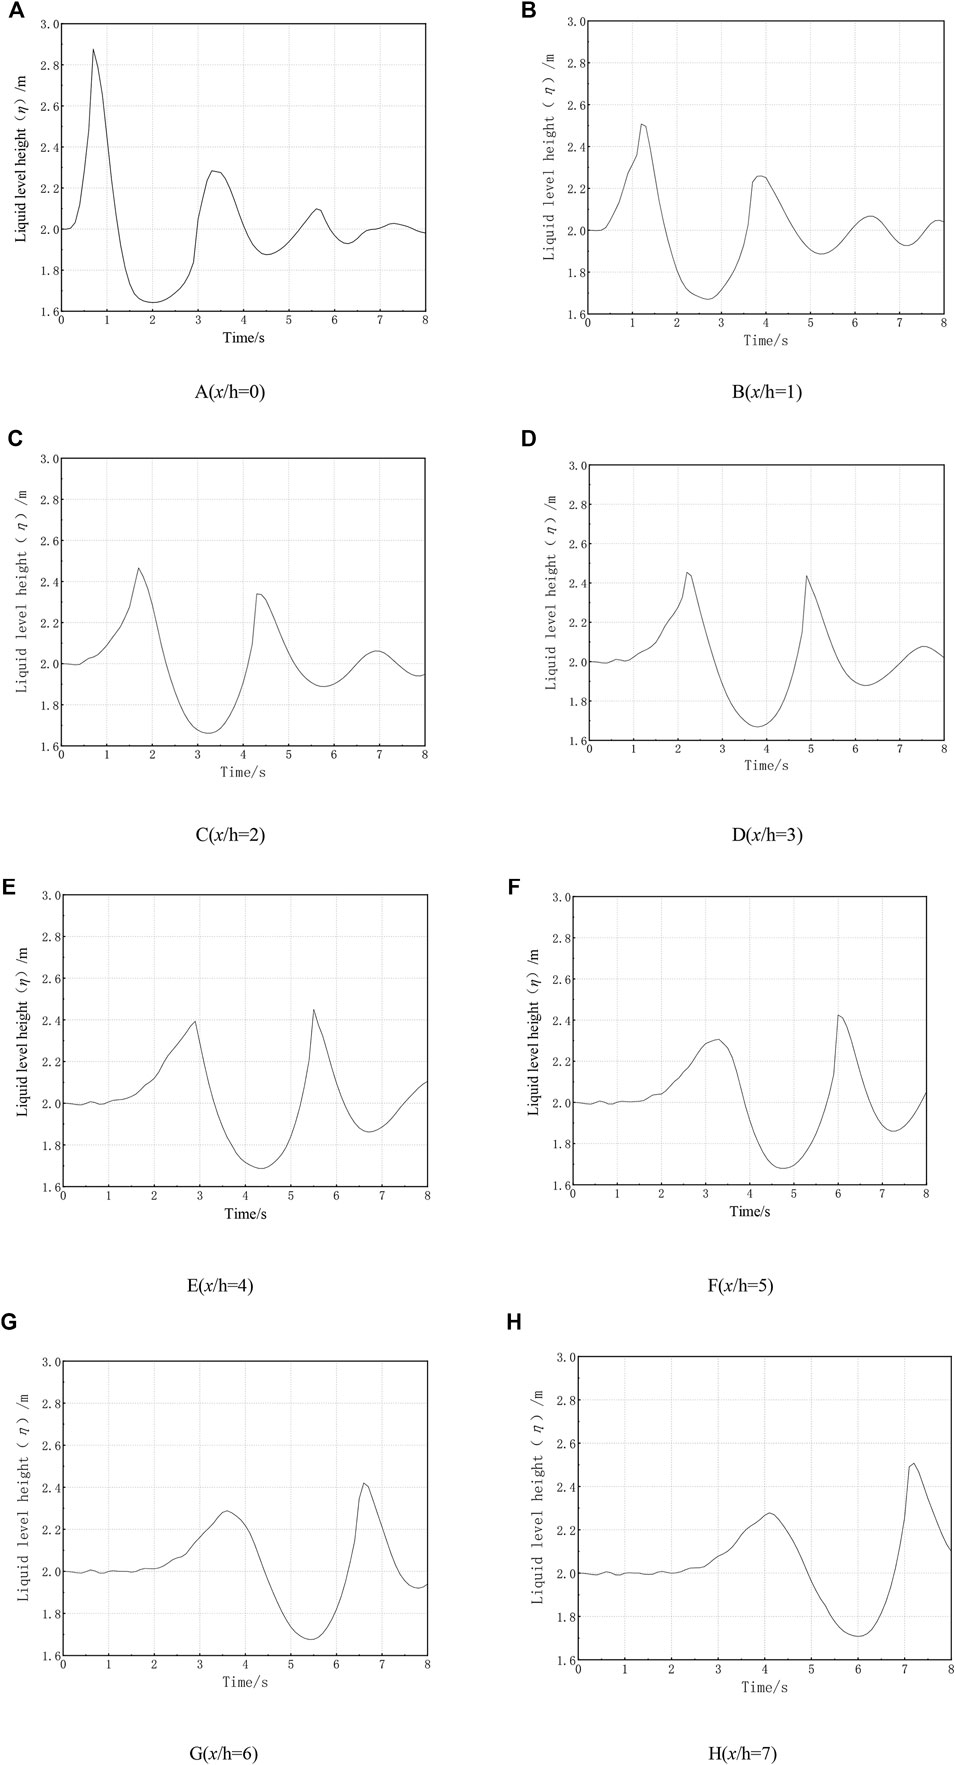
Slide block A, with density ρb = 2,650 kg/m3, slid down the slope with an initial velocity of 2.83 m/s and stopped at the bottom of the flume. Monitoring points were arranged at 0.5 m intervals from 6.5 to 20.5 m, with monitoring point A at 6.5 m as the starting point for recording the surge recording (x = 0). Characteristic points A through H were analyzed, and the plots for the free surface height time-history at each point are shown in Figure 4.
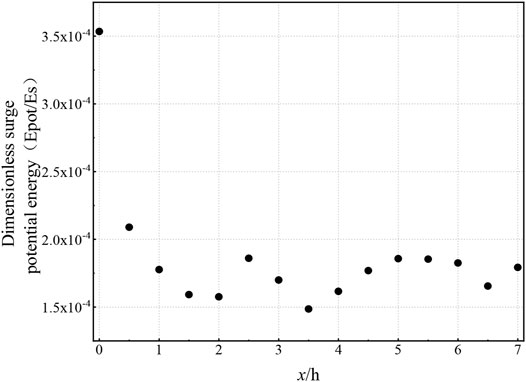
At 0.7 s, the first wave peak generated at point A was 0.88 m, with a wave speed of 0.88 m/s; at 3.3 s, the second wave peak occurred, with a wave height of 0.28 m and a wave speed of 0.25 m/s (Figure 4A). At 1.2 s, the peak height was 0.508 m (Figure 4B). Figures 4C–H display that the first wave peak of each measurement point was lower than the previous one, revealing energy decay during wave propagation. The energy decay was primarily caused by dispersion, which transferred partial energy of the main peak to the trailing wave [19] (Fritz 2003). Due to the reduction in the wavelength of the trailing wave, wave propagation speed decreased from the front to the back of the wave group. The crest of the second wave was greater than that of the first wave (Figures 4E–H). Because the right boundary was not set as the absorbing boundary in this experiment, the second wave crest was considered as the emission wave peak generated by the surge when it reached the boundary. Dean et al. [20] have proposed that the limit of the linear wave was H/h = 0.03. For measurement point A, at 6.8 s, the wave group was linear and propagating at a group velocity rather than a single column propagation. The surge energy was stored in the alternate forms of kinetic energy and potential energy, with the total energy of the surge area remaining unchanged. The total wave potential energy at different x/h can be calculated according to Eq. 7. With a longer propagation time, the free surface of the surge further approached a stationary state.
For x/h > 2, the potential energy and kinetic energy of the waves interconverted during wave propagation, were almost equal at infinite distance, and stabilized at a constant value
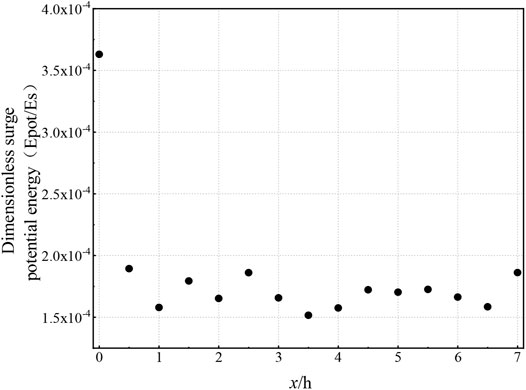
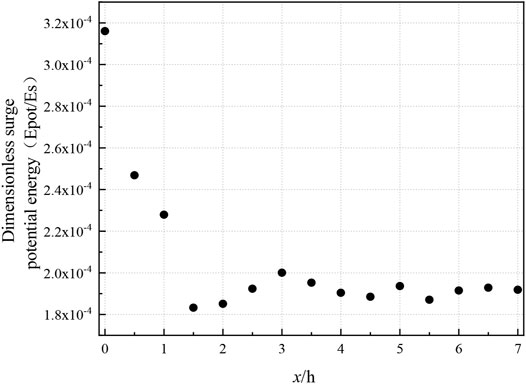
FIGURE 5. Variations of surge potential energy Epot vs. distance x/h for quadratic parabolic shaped slide block.
Influence of Various Densities of Slide Blocks on Near- and Far-Field Surges
Slide blocks B (ρb = 2,450 kg/m3) and C (ρb = 2,250 kg/m3) were also investigated with other parameters remaining uniform. At measurement point A (near-field), the heights of the first wave generated by slide blocks A, B, and C were 0.87 m, 0.85 m, and 0.83 m, respectively (Figure 6), indicating that the height of the first wave grew as the slide block density increased in the near-field surge because blocks with greater density generated a greater kinetic energy. There were slight differences in the surge time-history plots under the three operating conditions, but their characteristics were mostly uniform. The highest free surface level occurred at the landslide’s water entry stage (i.e., the first wave), and forward splashing of the water wave followed, while a depression was formed at the landslide entry point. After the first wave subsided, the depression in the liquid surface was replenished by the surrounding water. At the end of this replenishment, the surge wave began to propagate outwards at a certain wave height, during which the free liquid surface oscillated repeatedly and formed a wave train with continuously decaying amplitude. The wave generation efficiency of a denser slide block was lower than that of a comparatively lighter slide block; the lower the density of the slide block, the earlier the trough of the first peak disappears (Figure 6). At measurement point C (far-field), the wave crests were 0.466 m, 0.452 m, and 0.450 m, respectively, and the wave characteristics were consistent with those of the near-field. In the far-field area, wave frequencies generated under the three working conditions were equivalent.
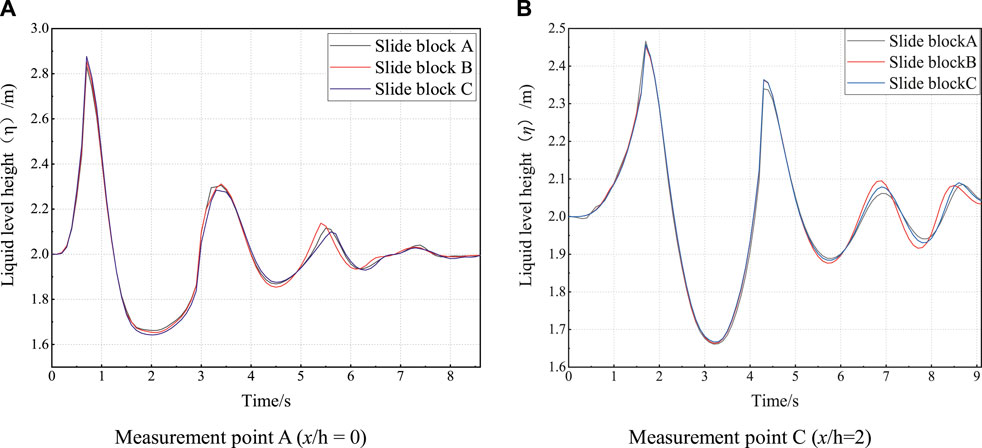
FIGURE 6. Variations of the free surface level at near and far-field measurement points. (A) Measurement point A (x/h = 0) (B) Measurement point C (x/h = 2).
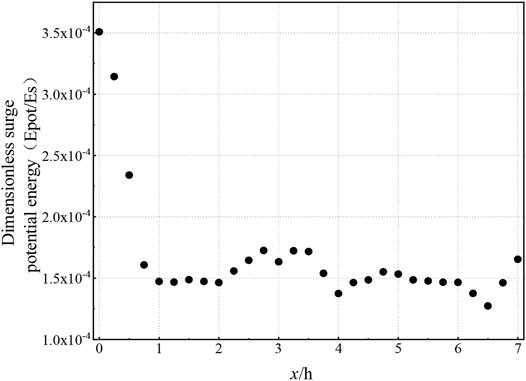
The potential energy of slide blocks B and C is shown in Figures 7, 8. For block B, the potential and kinetic energy of the surge waves became approximately equivalent at x/h = 1.5–2; therefore, x/h = 1.75 was set as the starting position of the far-field surge. For block C, the potential and kinetic energy became approximately equal at x/h = 1–1.5; thus, x/h = 1.25 was set as the starting position of the far-field surge. Thus, it was observed that a heavier block increases the distance of the far-field starting position from the surge generation area, and the first wave potential energy also grows with the increasing density of the block. The dissipation of potential energy accelerated with the decreasing density since a greater density generated a greater initial kinetic energy, taking a longer time to dissipate the potential energy.
Influence of Different Block Shapes on the Near- and Far-Field Areas of Surges
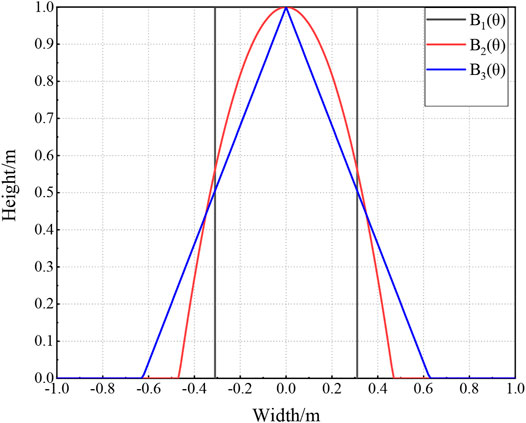
The three shapes of slide blocks and their details are shown in Figure 9. All blocks were 1 m thick with ρb = 2,650 kg/m3 and an initial velocity of 2 m/s, where
B1(θ) was a rectangle defined by the following equation:
The bottom width was about 0.62 m.
B2(θ) was a quadratic parabolic type block with a specific equation shown in the Eq. 9.
B3(θ) was an isosceles triangle:
The bottom width was about 1.25 m.
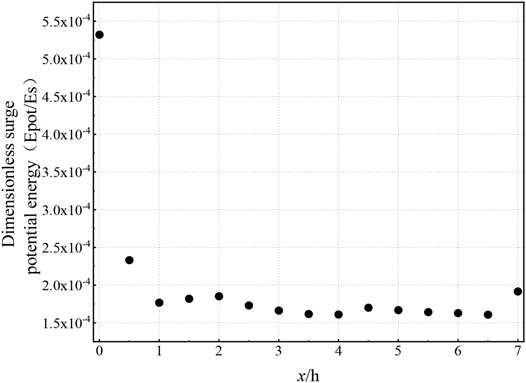
Compared to the previous numerical simulation of the different block shapes of B1(θ), B2(θ) and B3(θ) generated the largest dimensionless potential energy. When the block was rectangular, as shown in Figure 10, the potential and kinetic energy of the wave became approximately equal for the first time at x/h = 1.5–2; thus, x/h = 1.75 was set as the starting position of the far-field surge. When the block was an isosceles triangle, as shown in Figure 11, the potential and kinetic energy of the wave approached equivalency for the first time at x/h = 1.5–2.5; therefore, x/h = 2 was set as the starting position of the far-field surge. When the block was a quadratic parabolic type, x/h = 2 was the starting position of the far-field surge. It was concluded that the shape of the slide block did not substantially impact the starting position of the far-field surge.
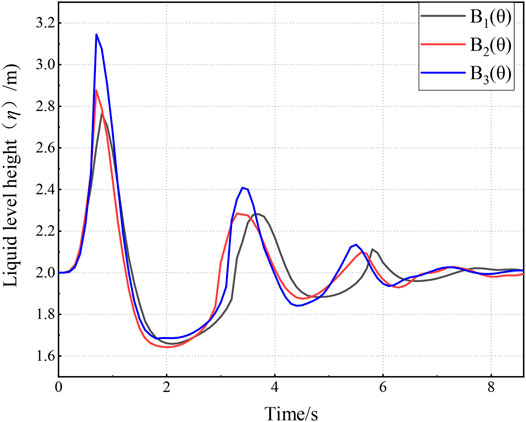
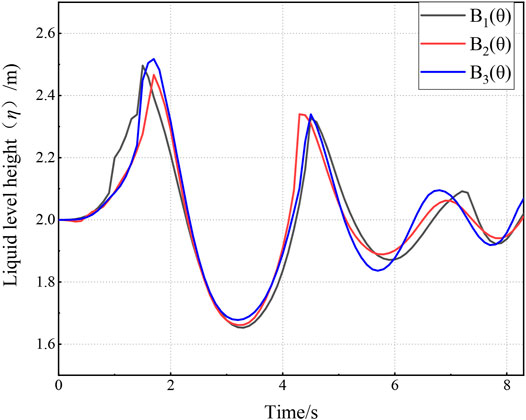
The surge time-history curves of the three shapes in the near- and far-field are shown in Figures 12, 13. In the surge generation area, block B3(θ) had the highest height of the first wave, followed by block B2(θ), and finally block B1(θ). These might result from the amount of contact areas between water and the blocks, with the largest contact area for block B3(θ), followed by block B2(θ) and then block B1(θ). When the surge reached the far-field area, the general characteristics of the wave curves generated by the three slide blocks were similar. Block B2(θ) had a slightly shorter wavelength than the other two blocks, and all three blocks showed equivalent surge wave peak heights. Therefore, it was inferred that the block shape impacted the near-field surge propagation more than the far-field.
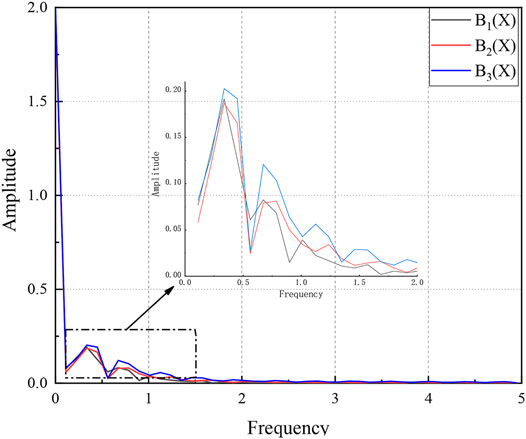
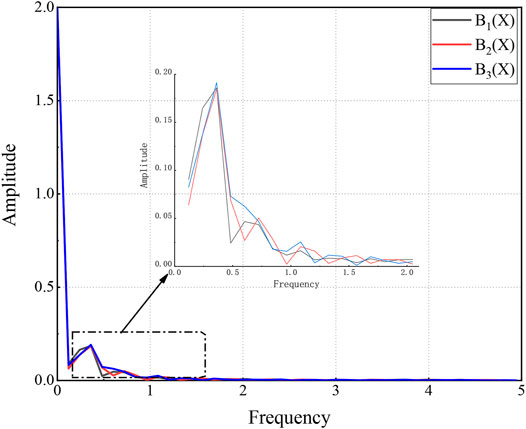
Fourier transform (FT) was performed on the surge time-history curves at x/h = 0 and x/h = 2, the frequency-amplitude curves of which are shown in Figures 14, 15. In the surge generation area, the frequency spectra of the three slide blocks were generally the same. Under the same frequency and similar conditions, the rectangular slide block [B1(θ)] generated slightly higher surge amplitude. In the far-field range (x/h = 2), the frequencies and amplitudes of the three blocks were consistent with each other, with the main frequency of the surge (f) at about 0.32 ± 0.01 Hz, indicating a negligible impact of the block shape on the far-field surge propagation.
Conclusion
The following conclusions were drawn from the study:
1) In the near field, the highest free surface of surge appears in the stage of landslide entering water (i.e., the first wave), and then the surge wave begins to spread to the periphery with a certain wave height. The smaller the density of the slide block was, the earlier the first wave trough disappeared. The height of the first wave increased with increasing block density. The first wave height of the isosceles triangular block was the largest, followed by the parabolic type, and then the rectangular block, due to the differences in the contact area of the blocks with water.
2) In the far-field area, the first wave height generated by the three block shapes was about 2.5 ± 0.1 m, with the main frequency of the surge at about 0.32 ± 0.01 Hz, suggesting that the influence of block shape on the far-field propagation was negligeable. The main reason for the decay of wave crest energy was the dispersion of waves, where the first wave energy was transferred to the trailing wave that followed closely. In the far-field range, the potential and kinetic energy were approximately equivalent and converted to each other.
3) For a 45° slope and 2 m water depth, x/h = 2 was determined to be the starting position of the far-field surge wave according to the change in the wave potential energy at the measurement point for the quadratic parabolic block. A block of large density can increase the distance of the starting position of the far-field surge from the water entry point. The slide block shape has no significant imflunence on the starting position of the far-field surge, which was mainly related to the contact area between the slide block and the water surface.
Data Availability Statement
The original contributions presented in the study are included in the article/Supplementary Material, further inquiries can be directed to the corresponding author.
Author Contributions
1) The contribution of RW is the idea, introduction, dynamics model and validation, landslide-induced surge characteristics, and the conclusion. 2) The contribution of MD is the calculation and simulation of surge characteristics. 3) The contribution of YW is the numerical experimental study of field. 4) The contribution of WX is the surge propagation mechanism. 5) The contribution of LY is the laws of near- and far-field areas of surges.
Funding
This work is supported by the National Natural Science Foundation of China (No. 51939004), the Fundamental Research Funds for the Central Universities (Nos. B200204008 and B210203003).
Conflict of Interest
The authors declare that the research was conducted in the absence of any commercial or financial relationships that could be construed as a potential conflict of interest.
Publisher’s Note
All claims expressed in this article are solely those of the authors and do not necessarily represent those of their affiliated organizations, or those of the publisher, the editors and the reviewers. Any product that may be evaluated in this article, or claim that may be made by its manufacturer, is not guaranteed or endorsed by the publisher.
References
1. Zhou G, Li T, Qian Q. Finite Element Numerical Simulation of Water Waves Due to Reservoir Landslides. Rock Soil Mech (2013) 34(04):1197–201.
2. Deng C, Yuan Q, Hou Y, Jia W. Numerical Simulation of the Surge Wave in Reservoir Based on FLUENT Software. Hydro-Science Eng (2014) 3:84–91. doi:10.3969/j.issn.1009-640X.2014.03.013
3. Tan H, Xu Q, Chen S, Wang X. Numerical Modeling of Surge Caused by Granular Deformable Landslide Based on a Coupled DEM-SPH Model. Rock Soil Mech (2020) 41(S2):1–11. doi:10.16285/j.rsm.2020.0165
4. Noda E. Water Waves Generated by Landslides. J Wtrwy., Harb Coast Engrg Div (1970) 96(4):835–55. doi:10.1061/AWHCAR.0000045
5. Liu PL-F, Lynett P, Synolakis CE. Analytical Solutions for Forced Long Waves on a Sloping beach. J Fluid Mech (2003) 478:101–9. doi:10.1017/S0022112002003385
6. Yim SC, Yuk D, Panizzo A, Di Risio M, Liu PL-F. Numerical Simulations of Wave Generation by a Vertical Plunger Using RANS and SPH Models. J Waterway, Port, Coastal, Ocean Eng (2008) 134(3):143–59. doi:10.1061/(asce)0733-950x(2008)134:3(143)
7. Du W, Sheng Q, Fu X, Chen J, Zhou Y. Extensions of the Two-phase Double-point Material point Method to Simulate the Landslide-Induced Surge Process. Eng Anal Boundary Elem (2021) 133:362–75. doi:10.1016/j.enganabound.2021.09.020
8. Tan H, Chen S. A Hybrid DEM-SPH Model for Deformable Landslide and its Generated Surge Waves. Adv Water Resour (2017) 108:256–76. doi:10.1016/j.advwatres.2017.07.023
9. Wiegel RL. Laboratory Studies of Gravity Waves Generated by the Movement of a Submerged Body. Trans Am Geophys Union (1955) 36(5):759–74. doi:10.1029/tr036i005p00759
10. Walder JS, Watts P, Sorensen OE, Janssen K. Tsunamis Generated by Subaerial Mass Flows. J Geophys Res (2003) 108(B5):2236. doi:10.1029/2001JB000707
11. Panizzo A, De Girolamo P, Petaccia A. Forecasting Impulse Waves Generated by Subaerial Landslides. J Geophys Res (2005) 110(C12):C12025. doi:10.1029/2004jc002778
12. Watts P. Wavemaker Curves for Tsunamis Generated by Underwater Landslides. J Waterway, Port, Coastal, Ocean Eng (1998) 124(3):127–37. doi:10.1061/(asce)0733-950x(1998)124:3(127)
13. Liu J, Zhou C, Guo J, Liu J. Experimental Study of Landslide Surge Wave Overtopping an Earth Dam. Arab J Sci Eng (2020) 46(1):563–71. doi:10.1007/s13369-020-04933-5
14. Xu F-g., Yang X-g., Zhou J-w., Experimental Study of the Impact Factors of Natural Dam Failure Introduced by a Landslide Surge. Environ Earth Sci (2015) 74(5):4075–87. doi:10.1007/s12665-015-4451-2
15. Heinrich P. Nonlinear Water Waves Generated by Submarine and Aerial Landslides. J Waterway Port Coastal Ocean Eng (1992) 118(3):249–66. doi:10.1061/(ASCE)0733-950X(1992)118:3(249)
16. Ke C, Wang Y, Huo Z, Zhang Y, Liu J. Prediction Model of Initial Wave Amplitude for High-Steep Reservoir Bank Landslide. Saf Environ Eng (2021) 28(04):164–9. doi:10.13578/j.cnki.issn.1671-1556.20201037
17. Fritz HM, Hager WH, Minor H-E. Near Field Characteristics of Landslide Generated Impulse Waves. J Waterway, Port, Coastal, Ocean Eng (2004) 130(6):287–302. doi:10.1061/(asce)0733-950x(2004)130:6(287)
18. Lo H-Y, Liu PL-F, Liu F. On the Analytical Solutions for Water Waves Generated by a Prescribed Landslide. J Fluid Mech (2017) 821:85–116. doi:10.1017/jfm.2017.251
19. Fritz HM, Hager WH, Minor H-E. Landslide Generated Impulse Waves. Experiments in Fluids (2003) 35(6):505–19. doi:10.1007/s00348-003-0659-0
Keywords: landslide-induced surge waves, near-field, far-field, numerical simulation, propagation characteristics
Citation: Wang R, Ding M, Wang Y, Xu W and Yan L (2022) Field Characterization of Landslide-Induced Surge Waves Based on Computational Fluid Dynamics. Front. Phys. 9:813827. doi: 10.3389/fphy.2021.813827
Received: 12 November 2021; Accepted: 31 December 2021;
Published: 25 January 2022.
Edited by:
Wanqing Shen, Université de Lille, FranceCopyright © 2022 Wang, Ding, Wang, Xu and Yan. This is an open-access article distributed under the terms of the Creative Commons Attribution License (CC BY). The use, distribution or reproduction in other forums is permitted, provided the original author(s) and the copyright owner(s) are credited and that the original publication in this journal is cited, in accordance with accepted academic practice. No use, distribution or reproduction is permitted which does not comply with these terms.
*Correspondence: Rubin Wang, cmJ3YW5nX2hodUBmb3htYWlsLmNvbQ==
 Rubin Wang
 Miangang Ding
 Yunzi Wang
 Weiya Xu
 Long Yan


