 Jiaqi Song
 Xingqin Qi
- School of Mathematics and Statistics, Shandong University, Weihai, China
Inspired by lots of applications like viral marketing of products and transmitting information in a network, ranking the spreading ability of nodes in the network has been widely studied. At present, the above problem is mostly studied on unsigned networks which only contain positive relationships (e.g., friend or trust) between users. In real-world networks, there usually exist both positive relationships and negative relationships (e.g., foe or distrust) between users. Based on this, we aim to find the influential spreaders in a signed network which meet the requirement of real scene. Moreover, when the spreading only aims to affect a specific group of nodes instead of all nodes, such as promoting cigarette, a new problem called localized targets spreading problem was come up with. Localized targets spreading problem has been studied on unsigned networks, but it is still open for signed networks. Thus, in this paper, we propose a new method, called local influence matrix (LIM) method, which aims to find the seed nodes set with maximum positive influence on a specific group of targets but with minimum influence on the non-target nodes in signed social networks. Simulation results show that our method performs well on real networks.
1 Introduction
In recent years, a variety of attention has been paid to investigating the spreading ability of nodes in complex networks. Effectively identifying influential nodes is of great significance in reality, for instance, and helping to design appropriate marketing strategies. There are numerous studies having been done on this issue and a series of methods have been proposed, such as degree centrality (DC) [1], betweenness centrality (BC) [2] and k-shell decomposition (KS) [3] etc. In addition to these famous methods, many researchers proposed other novel methods [4, 5]. Recently Guilbeault and Centola derived a new measure called complex centrality (CC) [6] depending on a “complex” path instead of a “simple path.”
In previous research, people often concentrate on finding the most influential nodes for the entire network. However, in our daily life, there are some situations where we’d like to find the most influential nodes for localized targets, i.e. aiming to infect not all the nodes but only a small number of localized nodes. The problem of localized targets was firstly proposed by Sun et al. [7]. Actually, the target spreading problem has many real applications. For example, in advertising based on online social networks (e.g., Facebook and Twitter), cigarette advertisement should be promoted as much as possible among adults and but should avoid being promoted among teenagers. However, some traditional centrality methods can not meet this requirement. For example, when some information needs to be passed to the target nodes in the yellow circle in Figure 1, most degree-related methods are hard to achieve the goal. In Figure 1, the network’s maximum out-degree node is far away from the target nodes. So if the information is passed from the node with maximum out-degree to the targets, the seed node is very likely to lose its spreading ability during the propagation process. So the following problem comes up naturally: how to identify the most influential nodes in a network which can activate the given localized targets as often as possible while activating the non-target nodes as little as possible?
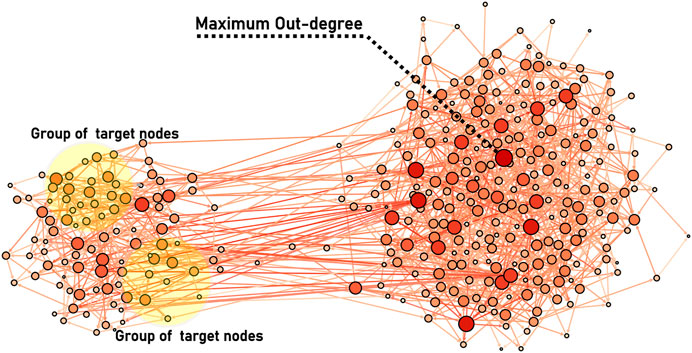
FIGURE 1. Illustration of the problem of spreading towards localized targets in complex networks. The network is an artificial network (350 nodes and 1,129 links) with two communities. The color (from dark red to white) of the nodes represents their respective degrees. Nodes in the yellow circle are the targets that need to be activated. The maximum out-degree node whose color is darkest is marked.
The pioneer method proposed by Sun et al. [7] is suitable for the unsigned networks, and their method only pays attention to the first objective (i.e., activate the given localized targets as often as possible), but ignores the second objective (i.e., avoid activating the non-target nodes). On the other hand, in some online social systems (e.g., Slashdot, Bitcoinalpha), users are allowed to mark positive signs or negative signs on the relationships with others. Compared with unsigned networks, the signed networks describe the real social systems more accurately and reasonably. There are also a few methods of identifying the influential nodes in a signed network. But to our best knowledge, there is still not any study attempting to identify the most influential nodes towards given target nodes in a signed network. In this paper, we thus propose a local influence matrix method (LIM) to solve this problem by computing the local paths from target nodes to other nodes. After applying this method on some generated networks and real networks, we test its efficiency. We also compare it with some traditional methods which are extended simply to deal with this particular case, and verify this new method’s better performance.
2 Modelling Signed Social Networks
In this paper, we model a signed social network as a directed, weighted, and signed graph G(V, E, P, R), where V is the set of nodes that correspond to users in the social network with |V| = N. Let E be the set of edges, and the attitude (positive, negative, or neutral) of each edge is stored at the matrix R with R(u, v) ∈ {1, 0, −1}. Let P be a non-negative diffusion probability matrix, where P(u, v) shows the diffusion probability from user u to user v. For example, if P(u, v) is equal to 0.2, it means that the probability that user u will successfully deliver message to user v is 0.2.
Here we use the example in Figure 2 to illustrate the signed social networks. Figure 2A shows an example of a signed social network which introduces the relationship between the three users (Jerry, Tuffy, and Tom). Figure 2B demonstrates the graph model of the signed social network of Figure 2A. Three nodes v, u, and w are corresponding to user Jerry, Tuffy, and Tom respectively. Note that the direction of edges in Figure 2A are opposite to those in Figure 2B. The reason is as follows. For instance, Jerry likes Tuffy in Figure 2B, so he’d like to be influenced by Tuffy, in other words, if Tuffy likes some products, Jerry is easily influenced by Tuffy and likes these products. In Figure 2, Jerry likes Tuffy, so R(u, v) = + 1; Jerry dislikes Tom, so R(u, v) = − 1; and there is no relationship between Tom and Tuffy, so R(u, v) = 0. Figure 2B only shows the signs on the edges but not the weights on the edges. In Figure 2B, 0.1 and 0.2 represent the weights of two edges. The probability of v being successfully affected by u or w is 0.1 or 0.2.

FIGURE 2. An example of modeling a signed social network. (A) A signed social network (B) A directed, weighted, and signed graph
The probability of information being accepted depends on the matrix P. If P(v, u) is equal to 0.2, it means that u will accept the information from v with the probability of 0.2. And the attitude of u towards information depends on matrix R. If u accepts v’s information and R(v, u) is equal to 1, u will support v’s information. On the contrary, if R(v, u) is equal to −1, u will oppose v’s information. As a result, we define a matrix A = R*P with its element A(u, v) = R(u, v) ⋅ P(u, v), to consider the extent of positive influence or negative influence. For example, in Figure 2B, A(w, v) is −0.2.
Matrix P can be generated by three methods, which will be discussed in Experiments Section.
3 The Local Influence Matrix Method
Usually the target nodes that need to be infected or activated are localized, which means they are within a certain distance from each other. To identify the most influential nodes in a signed network which can positively activate the given localized targets as often as possible while activating the non-target nodes as little as possible, we present the following Local Influence Matrix method (abbreviated as LIM). The basic idea is to compute all positive and negative paths within k steps from V \ T to the target nodes T, which shows the probability of a node in V \ T activating the node in T, and we will use them later to measure the infecting ability of the nodes in V \ T.
As mentioned above, let A be the N × N adjacency matrix of the input signed network, where ai,j ∈ [−1, 1] means the probability that node i infects j with the same (or different) status if ai,j > 0 (or ai,j < 0). Note that
and then set the main diagonal of Ak+1 to zero again and repeat the above process.
Then the infected probability matrix within k steps between any pair of nodes of V can be calculated as:
Note that if k > 3,
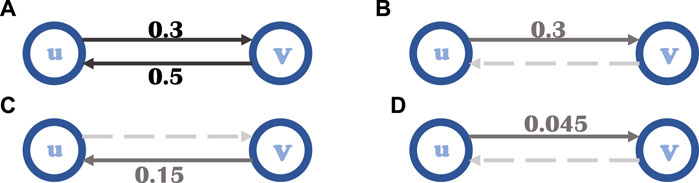
FIGURE 3. Special situation in spreading process. (A) There are two opposite sides between node u and v. The probability of u successfully spreading information to v is 0.3. And the probability from v to u is 0.5. (B) The probability from u to v is 0.3. (C) The probability from u to v to u is 0.15. (D) The probability of u to v passing through u-v-u-v is 0.045.
Then we divide the matrix S into the following two matrices SP and SN.
and
SP(u, v) (or SN(u, v)) measures the possibility that node u activates v positively (or negatively) if the original attitude/status of u is positive. Recall that our problem is to identify the most influential nodes in a signed network which can positively activate the given localized targets as often as possible while activating the non-target nodes as little as possible. At first, we would like to select nodes which could positively activate target nodes as often as possible and negatively activate target nodes as little as possible. Meanwhile, it is better to minimize the impact on other non-target nodes, whether it is positively influenced or negatively influenced. The positive influence from non-target nodes to target nodes can be expressed by SP ⋅ f, where f is a N × 1 vector in which the positions corresponding to target nodes are 1, and 0 otherwise. Likewise, SN ⋅ f shows the negative influence from non-target nodes to target nodes, which is also a positive vector. In addition, SP ⋅ f′ and SN ⋅ f′ respectively represent the positive and negative influence from non-target nodes to other non-target nodes where f′ is also a N × 1 vector indicating non-target nodes position. To adjust the preference of these three indicators, α, β and γ are introduced as the weights of these three indicators.
Based on the above requirements, we proposed a formula to measure the influence of nodes from V \ T to target set T as follows:
The LIM process is illustrated with a toy network in Figure 4, where α, β, and γ are set to be 1, 1, and 0 respectively. One can see that the most highly ranked node by LIM is different from the node with maximum out-degree.
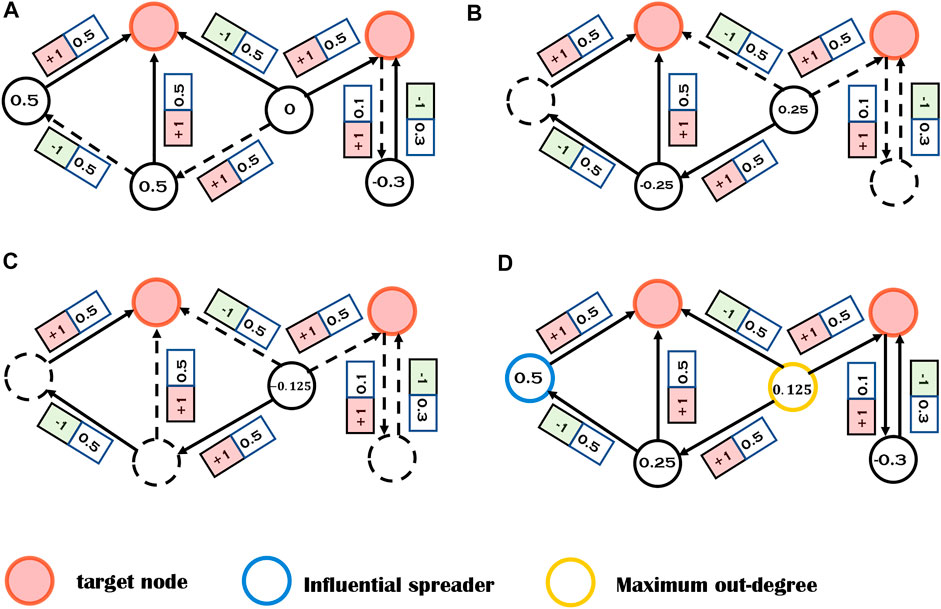
FIGURE 4. Illustrations of the local influence matrix (LIM) algorithm (α = 1, β = 1, γ = 0). The red nodes are target nodes and others are non-target nodes. (A) The nodes with numbers are directly connected with target nodes. All irrelevant nodes and edges are marked in dashed lines. The numbers on the nodes can be calculated by A ⋅ f. (B) The nodes with numbers can reach target nodes in exactly two steps. All possible paths with length two are considered and the numbers on nodes can be calculated by
4 Experiments
4.1 Experimental Setup
4.1.1 Datasets
To validate the LIM method, we will apply it to two real signed networks: Slashdot [8] and Bitcoinalpha [9, 10].
• Slashdot. This is a signed and directed network in which users can rate each other as a friend or a foe. We use its biggest subgraph with 10,966 users and 44,356 relationships.
• Bitcoinalpha. Bitcoinalpha used here is a directed, signed network with 3,783 nodes and 24,186 links. Original data has weight on each arc, but here we use its underlying graph only and generate the weights by the following three models.
4.1.2 Diffusion Probability Generation
If one unweighted signed network is given, researchers [8, 11, 12] usually use the following three models to generate the influence probabilities on arcs.
• Weighted Cascade (WC) model. In this model, P(u, v) for an edge (u, v) is 1/d−(v), where d−(v) is the in-degree of v.
• TRIVALENCY model. On each edge (u, v), this model randomly selects a value from 0.1, 0.01, and 0.001 as a diffusion probability.
• Uniformly (UN) model. The diffusion probability of all the edges are assigned the same value. We will test a relatively small value of 0.03 and a relatively large value of 0.5, respectively.
4.1.3 Localized Targets’ Selection
Note that a localized target node set T should be given beforehand when testing this new method LIM on a data set. We use the following strategy to generate T. We first randomly pick up a node v with a smaller coreness centrality [3], then add those nodes within two steps from v into the target set. Note that in this paper target nodes are not allowed as seed.
4.1.4 Independent Cascade With Sign Model
The standard Independent Cascade (IC) model [12] used for unsigned networks is extended to the signed case in the following, which is called IC-S Model. Each node v has three states s(v) in IC-S model, including active positive, active negative, and inactive. For a node u, active positive status means that u is active with positive attitude. A node u with inactive status means that u is not active yet.
At time t, each newly activated node u (i.e., the node which is activated at time t − 1) has only one chance to activate each of its currently inactive neighbors w. If node w is activated by u, its status s(w) is determined by the status of u and the relationship between them, i. e, s(w) = R(u, w) × s(u). If s(w) > 0, then the status of w is active positive, and active negative otherwise. If w is not activated successfully by u, w can also be activated by its other neighbors.
4.1.5 Comparison Methods
To show this new method’s performance, besides the random selection method baseline, we also use the following methods to compare with.
• Degree centrality. The degree of node i can be defined as k(i) = ∑j∈G(|aij| + |aji|) where aij is the entry of matrix A mentioned above.
• Out-Degree centrality. The out-degree of node i can be defined as o(i) = ∑j∈G|aij|, where aij is also the entry of matrix A. The out-degree of the node represents the number of the out neighbors of the node, which reflects the direct influence from this node to others.
• Positive Out-Degree centrality. The positive out-degree of the node i is defined as
• Local Degree 1. Mathematically, the first type local degree LD1 of node i is given by:
where Ω is the node set within the distance l = 3 from the target nodes.
• Local Degree 2. The second type local degree LD2 of node i is given by:
Note that the two type local degree methods are used to rank the node set Ω which are within the distance l = 3 from the target nodes. The difference between them is that LD1 counts the our-positive neighbor in the whole network while LD2 counts the out-positive neighbor only in Ω.
4.2 Experiment Results
In this section, we present our experiment results of the positive influence spreading performance of different methods on Slashdot and Bitcoinalpha. We also define the positive influence spreading performance as the proportion of the target nodes that are positively infected to the total infected nodes under the IC-S model.
Figure 5A,B shows the performance of four comparison methods (Random, Degree, Out-Degree, and Positive Out-Degree) under three types of propagation probabilities model (WC model, TRIVALENCY model, and UN model) on Slashdot data set (or Bitcoinalpha data set). The size of seed nodes k is set ranging from 50 to 300. For the UN model, we set the diffusion probability to 0.03. When constructing the target set T, we treat node 2,921 whose coreness is 2 as the center, and take the nodes within two steps from it as the target nodes. The top k nodes under the five ranking methods are selected to be the seeds, whose infecting ability are then tested by the IC-S model. After 2,000 iterations on the IC-S model, the average positive influence spreading performances can be obtained. As shown in both Figure 5A,B, the LIM method outperforms the other four methods as the size of the seed nodes changes with all three types of different propagation probability.

FIGURE 5. Result Comparisons between LIM method and some degree-based centrality methods when applying on (A) Slashdot network (B) Bitcoinalpha network. The experiments are conducted on (A) Slashdot network (B) Bitcoinalpha network. Three diffusion probability methods are considered, i.e. WC model, TRIVALENCY model, and UN model. For UN model, the probability value we set is 0.03. In each experiment, parameter k means that k seeds are selected to activate other nodes, and λ means the proportion of positively activated target nodes among all activated nodes. The targets we set are a center node with small coreness and nodes within two steps from it. (A) On the Slashdot network, node 2,921 is the center node. (B) On the Bitcoinalpha network, the center node we set in targets is node 7,062. Ranking methods include Degree (yellow triangles), Out-Degree (purple diamonds), Positive Out-Degree (pink triangles), Random (green circles), and LIM (red circle) methods. The results in each figure are obtained by averaging over 2,000 independent realizations.
The reason why the LIM method performs better at the beginning is that the λ we calculate is a proportion, not the number of nodes. Because of the difference of the size of seed nodes, the number of the target nodes that are positively activated and the number of the nodes finally activated are different. So even if λ1 is bigger than λ2, the number of the target nodes that are positively infected in experiment 1 may be smaller than that of experiment 2. Besides, the experiments on Bitcoinalpha under TRIVALENCY mode and UN model do not perform as well as in the WC model. This is mainly because that there is a lot of overlap between the nodes selected by LIM method and the nodes selected by other methods. For example, if we select 150 nodes to be seed nodes, more than 80 nodes are repeatedly selected by both the LIM method and Degree method under either of the two models.
We also compare the method LIM with the two local degree methods (LD1, LD2) on these two data sets under three types of propagation probabilities model, see Figure 6A,B This also shows that the LIM method performs well.
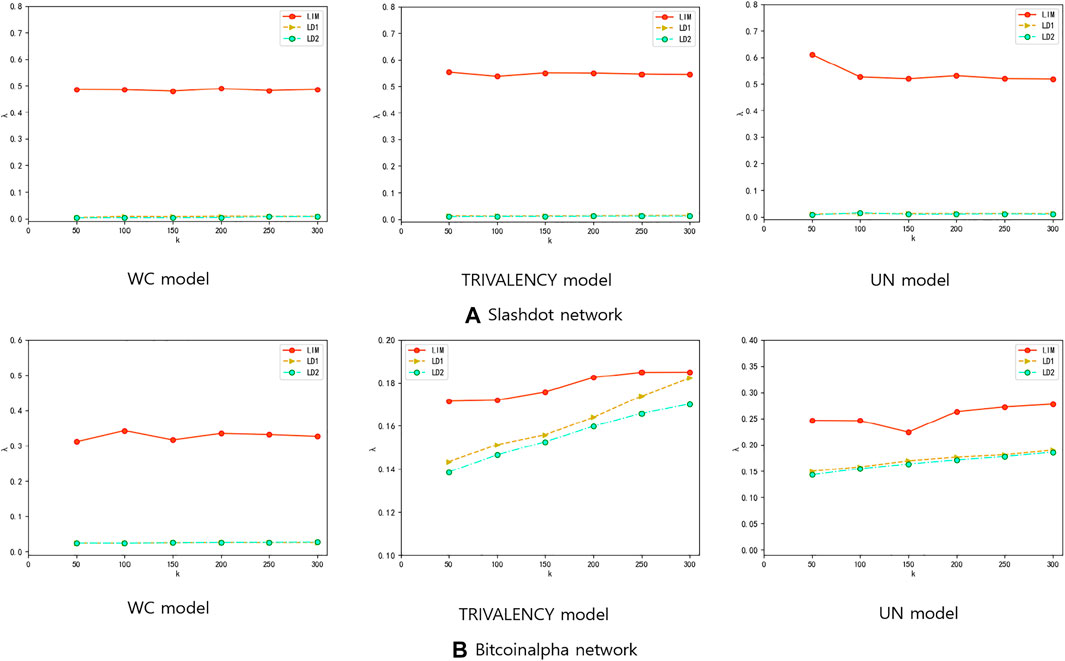
FIGURE 6. Result Comparisons between LIM and LD1 and LD2 when applying on (A) Slashdot data set (B) Bitcoinalpha data set. The experiments are conducted on (A) Slashdot network (B) Bitcoinalpha network. Three diffusion probability methods are considered, i.e., WC model, TRIVALENCY model, and UN model. For the UN model, the probability value we set is 0.03. In each experiment, parameter k means that k seeds are selected to activate other nodes. And λ means the proportion of positively activated target nodes among all activated nodes. Ranking methods include Local Degree 1 (yellow triangles), Local Degree 2 (green circles), and LIM (red circle) methods. The results in each figure are obtained by averaging over 2,000 independent realizations.
Furthermore, in order to validate the effects of the three parameters α, β, and γ, we change each of these three parameters separately and observe the changes in spreading ability. During all three experiments, the parameter that needs to be tested is changed while the other two parameters are kept as 1. Figure 7A shows the effect of α when applying on Slashdot under the WC model, here 30 seeds are selected. θ1 represents the proportion of positively activated target nodes among all activated nodes. We can see that as the value of α increases, θ1 increases significantly and then stabilizes. The significant increasing in θ1 shows that a bigger parameter α can help to select those nodes which can positively activate targets as seeds. Similarly, Figure 7B shows the effect of parameter β applying on Slashdot under the UN model with the diffusion probability of 0.5, and 100 seeds are selected. θ2 represents the proportion of negatively activated target nodes among all activated nodes. It can be seen that θ2 has a slight downward trend but is not more obvious, this is because in most real social networks, there are more positive edges than negative edges. The downward trend in Figure 7B sufficiently shows that the setting of a bigger parameter β effectively prevent negatively activating target nodes. Figure 7C shows the effect of parameter γ applying on Slashdot under WC model, and 30 seeds are selected. θ3 represents the proportion of positively and negative activated non-target nodes among all activated nodes. The value of θ3 decreases from 0.9 to nearly 0.2 as γ increases, which shows that the setting of a bigger parameter γ is also useful to prevent activating non-target nodes.
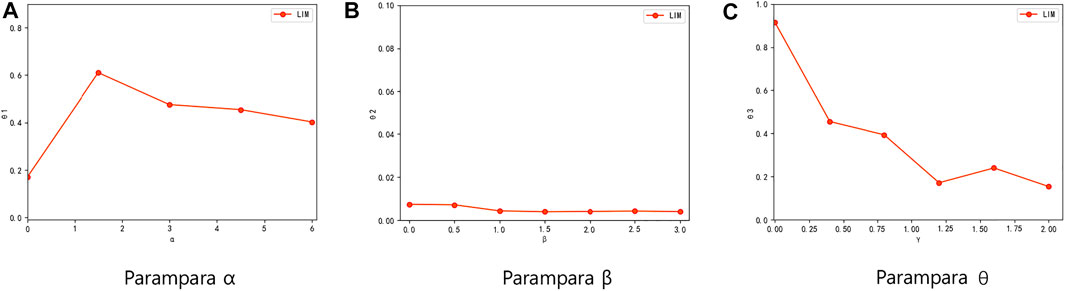
FIGURE 7. Results of parameter testing. The experiment is carried out on Slashdot. The first and third experiments use WC models and select 30 seeds, while the second one is done under the UN model which set the diffusion probability to 0.5 and selects 100 seeds. The center node of the target nodes is set to node 2,921. (A) Results of parameter α. θ1 means the proportion of positively activated target nodes among all activated nodes. Each point in this figure represents the θ1 value with a different α value. (B) Results of parameter β. θ2 means the proportion of negatively activated target nodes among all activated nodes. Each point in this figure represents the θ2 value with different β value. (C) Results of parameter γ. θ3 means the proportion of positively and negative activated non-target nodes among all activated nodes. Each point in this figure represents the θ3 value with different γ value.
5 Discussion
Identifying the influential spreaders is a very important problem both in theory and in practice. Though a number of methods have been proposed, most of them aim to infect most nodes across entire networks. However, in some real systems which intend to infect a small group of nodes, the traditional centrality methods are found to be not accurate enough to find the influential nodes to target. We extend this problem from unsigned networks to signed networks, and thus propose a local influence matrix method to rank the spreading ability of the nodes towards the targets. The simulation results indicate that our method outperforms the traditional centrality methods. Furthermore, by adjusting the parameters we set, the new method is found to be able to reduce the impact on non-target nodes.
Regarding the choice of the center node of the targets in the experiments, we would like to choose a node with smaller coreness. That is because the node with high coreness is more closely connected with other nodes, which easily causes too many targets to be selected. For example, there are 3,783 nodes on Bitcoinalpha and more than 2,000 nodes are selected as targets, if the node with highest coreness is chosen as center node. This is inconsistent with the scenario for local targets we set in advance. For example, if we choose node 1 of the Bitcoinalphain which has the highest coreness as the center of the targets, the results comparing the LIM method with the other 6 methods show that the LIM method still performs better but not much better than others, see Figure 8. This also shows that this new LIM method will work better when the target is localized.
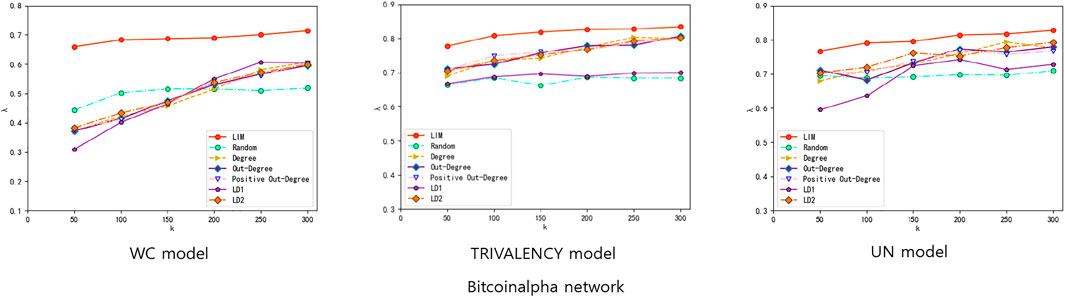
FIGURE 8. Results of targets set transformation. The experiment is done on Bitcoinalpha. The experiment selects 150 seeds under three models. And the center node of the targets is node 1 which has the highest coreness. Same as the above experiments, the LIM method compares with other 6 methods.
Data Availability Statement
The original contributions presented in the study are included in the article/Supplementary Material, further inquiries can be directed to the corresponding author.
Author Contributions
XQ proposed the idea. JS and XQ wrote the paper. ZF programmed.
Funding
This work is supported by the National Natural Science Foundation of China (CN) with No. 11971271; Natural Science Foundation of Shandong Province with No. ZR2019MA008.
Conflict of Interest
The authors declare that the research was conducted in the absence of any commercial or financial relationships that could be construed as a potential conflict of interest.
Publisher’s Note
All claims expressed in this article are solely those of the authors and do not necessarily represent those of their affiliated organizations, or those of the publisher, the editors and the reviewers. Any product that may be evaluated in this article, or claim that may be made by its manufacturer, is not guaranteed or endorsed by the publisher.
References
1. Bonacich P. Factoring and Weighting Approaches to Status Scores and Clique Identification. J Math Sociol (1972) 2:113–20. doi:10.1080/0022250x.1972.9989806
2. Freeman LC. A Set of Measures of Centrality Based on Betweenness. Sociometry (1977) 40:35–41. doi:10.2307/3033543
3. Kitsak M, Gallos LK, Havlin S, Liljeros F, Muchnik L, Stanley HE, et al. Identification of Influential Spreaders in Complex Networks. Nat Phys (2010) 6:888–93. doi:10.1038/nphys1746
4. Luan Y, Bao Z, Zhang H. Identifying Influential Spreaders in Complex Networks by Considering the Impact of the Number of Shortest Paths. J Syst Sci Complex (2021) 11:22194. doi:10.1007/s11424-021-0111-7
5. Ma L-l., Ma C, Zhang H-F, Wang B-H. Identifying Influential Spreaders in Complex Networks Based on Gravity Formula. Physica A: Stat Mech its Appl (2016) 451:205–12. doi:10.1016/j.physa.2015.12.162
6. Guilbeault D, Centola D. Topological Measures for Identifying and Predicting the Spread of Complex Contagions. Nat Commun (2021) 12:4430. doi:10.1038/s41467-021-24704-6
7. Sun Y, Ma L, Zeng A, Wang W-X. Spreading to Localized Targets in Complex Networks. Sci Rep (2016) 6:38865. doi:10.1038/srep38865
8. Li D, Xu Z-M, Chakraborty N, Gupta A, Sycara K, Li S, et al. Polarity Related Influence Maximization in Signed Social Networks. PLoS ONE (2014) 9:e102199. doi:10.1371/journal.pone.0102199
9. Kumar S, Spezzano F, Subrahmanian V, Faloutsos C. Edge Weight Prediction in Weighted Signed Networks. In: Proceedings of the data Mining (ICDM), 2016 IEEE 16th International Conference on (IEEE); December 2016; Barcelona, Spain. p. 221–30.
10. Kumar S, Hooi B, Makhija D, Kumar M, Faloutsos C, Subrahmanian V. Rev2: Fraudulent User Prediction in Rating Platforms. In: Proceedings of the Eleventh ACM International Conference on Web Search and Data Mining (ACM); February 2018; New York, NY, USA. p. 333–41.
11. Chen W, Wang C, Wang Y. Scalable Influence Maximization for Prevalent Viral Marketing in Large-Scale Social Networksryan. In: Proceedings of the 16th ACM SIGKDD Conference on Knowledge Discovery and Data Mining (KDD’2010); July 2010; Washington DC, U.S.A. p. 1029–38.
Keywords: influence diffusion, signed social networks, IC model, centrality, localized targets
Citation: Song J, Feng Z and Qi X (2022) Spreading to Localized Targets in Signed Social Networks. Front. Phys. 9:806259. doi: 10.3389/fphy.2021.806259
Received: 31 October 2021; Accepted: 29 November 2021;
Published: 18 January 2022.
Edited by:
Gaogao Dong, Jiangsu University, ChinaCopyright © 2022 Song, Feng and Qi. This is an open-access article distributed under the terms of the Creative Commons Attribution License (CC BY). The use, distribution or reproduction in other forums is permitted, provided the original author(s) and the copyright owner(s) are credited and that the original publication in this journal is cited, in accordance with accepted academic practice. No use, distribution or reproduction is permitted which does not comply with these terms.
*Correspondence: Xingqin Qi, cWl4aW5ncWluQHNkdS5lZHUuY24=