
94% of researchers rate our articles as excellent or good
Learn more about the work of our research integrity team to safeguard the quality of each article we publish.
Find out more
ORIGINAL RESEARCH article
Front. Phys., 21 January 2022
Sec. Social Physics
Volume 9 - 2021 | https://doi.org/10.3389/fphy.2021.805674
This article is part of the Research TopicNetwork Resilience and Robustness: Theory and ApplicationsView all 21 articles
Spread velocity, epidemic threshold, and infection density at steady state are three non-negligible features describing the spread of epidemics. Combining these three features together, a new network robustness metric with respect to epidemics was proposed in this paper. The real-time robustness of the network was defined and analyzed. By using the susceptible–infected (SI) and susceptible–infected–susceptible (SIS) epidemic models, the robustness of different networks was analyzed based on the proposed network robustness metric. The simulation results showed that homogeneous networks present stronger robustness than do heterogeneous networks at the early stage of the epidemic, and the robustness of the heterogeneous networks becomes stronger than that of the homogeneous ones with the progress of the epidemic. Moreover, the irregularity of the degree distribution decreases the network robustness in homogeneous networks. The network becomes more vulnerable as the average degree grows in both homogeneous and heterogeneous networks.
Nowadays, various dynamic phenomena exist in real networks, many of which are harmful and bring great damage to real life. Especially, the threat of infectious diseases is growing increasingly due to the increasing complexity of modern social networks in all facets of human endeavor [1–5]. For example, as reported by the WHO on October 29, 2021, there have been more than 245 million confirmed cases of coronavirus disease 2019 (COVID-19) globally, including almost 5 million deaths (https://covid19.who.int/). Also, other fields like economy, politics, and culture have suffered extensive damages during the outbreak of COVID-19. Since network structures show a great impact on the propagation dynamics [6–9, 11], it is crucial to assess the robustness of different network structures with respect to the spread.
Epidemic propagation models have been recently used to analyze network robustness against virus attacks, and the robustness of different networks has been studied [10–14]. By modeling and analyzing the epidemic propagation, the descriptive features of the propagation process are often used to measure network robustness against the epidemic spread. For example, the epidemic threshold and the final infection rate at the steady state have been used to measure the robustness of the network against virus attacks individually or jointly [13]. The results of network robustness with respect to epidemics can help in understanding and further improving network robustness against epidemics.
Although the existing measurements have been proven to be effective for network robustness when it comes to the spread of epidemics, some inherent challenges have been overlooked. Firstly, the existing measurements have mainly focused on the robustness of the network at the steady state. To our knowledge, the real-time robustness of complex networks with respect to epidemics has not been widely studied, i.e., the changes in the network robustness over time in different network structures have not been explored. Secondly, it is not accurate to measure network robustness without considering the spread velocity, which is an important factor in measuring the spread of epidemics. Therefore, the robustness of the network against epidemics can be comprehensively and accurately measured by considering the spread velocity. Furthermore, the spread velocity describes the changes in the propagation over time, which is very suitable for measuring the real-time network robustness with respect to epidemics [17].
In this paper, combining spread velocity, infection density at steady state, and the epidemic threshold, a novel metric was proposed to measure real-time robustness with respect to epidemics in complex networks. Network robustness with respect to the spread of the susceptible–infected (SI) [15] and susceptible–infected–susceptible (SIS) models [16] was analyzed based on the new metric, and some interesting results are presented in our paper. Firstly, the results confirmed that the irregularity of the degree distribution strengthens the network’s vulnerability with respect to the epidemic in homogeneous networks. However, the simulation results on the real-time robustness of the different networks showed that the robustness of the Barabási–Albert (BA) scale-free network [19] is not always stronger than that of the Watts–Strogatz (WS) network [20] at any time, which was different from the results of existing studies. At the early stage of the epidemic, the BA network is more fragile than the WS network. As the infection rate worsens, the BA network becomes more robust than the WS network. Moreover, the simulation results showed that the network becomes more vulnerable to the epidemic as the average degree grows in both homogeneous and heterogeneous networks.
The rest of this paper is organized as follows. Related Work presents the literature review and related works. In Network Robustness With Respect to Epidemic Models, we analyze the necessity of proposing the new metric to measure the network robustness against diseases. In The Novel Metric to Quantify Network Robustness, the novel metric to quantify the network robustness with respect to the SI/SIS epidemic spread is proposed. The simulation results in different networks are presented and analyzed in Results, and the main conclusions and the direction for future studies are summarized in Discussion.
Epidemics in social networks can be theoretically described using biological epidemic models, through which the spread mechanism of viruses can be described and analyzed. For example, the SI and SIS epidemic models are often used to model the spread of epidemics [13–17]. In the SI model, the S-state nodes can pass to the infected state through contagion by the infected ones, and the rate of an S-state node being infected by a single infected neighbor is
In the complex network theory, three important features describing the epidemic spread were introduced into the epidemic models. Firstly, the epidemic threshold
Therefore, the epidemic threshold, spread velocity, and the final infection rate at the steady state can comprehensively describe the propagation mechanism and can also be used as a measure of network robustness with respect to epidemics. As one of the most prominent features, the epidemic threshold is the first and commonly used measure of network robustness with respect to the epidemic spread [22, 23]. The larger the threshold, the more difficult it is to spread the virus, i.e., the more robust a network is against the virus attack [13]. Studies have found that the threshold cannot fully measure network robustness. For example, the Erdős–Rényi (ER) network [18] and the BA network [19] have two opposing features—the epidemic threshold and the steady-state infection rate—to measure their robustness. In [13], a new measure incorporating the fraction of infected nodes at the steady state and the epidemic threshold to assess the robustness of the complex networks with respect to the spread of epidemic has been proposed and proven to be effective in modeling epidemics with different final infection densities.
In existing studies, the epidemic threshold and the steady-state infection rate have been bound together to measure network robustness against epidemics since it has been proven that the results are inaccurate when only one feature is considered. Besides the epidemic threshold and the steady-state infection rate, the spread velocity is another widely discussed variable that should not be ignored in the study of network robustness. For example, Figure 1 shows the infection rate at the nodes at time t due to the SIS epidemic spreading process in the WS and BA networks, where the average degree of the two networks is the same. We can differentiate between the propagation processes in the two networks from the curve in Figure 1. Firstly, the final infection density in the BA network (IBA) is smaller than that in the WS network (IWS), i.e.,
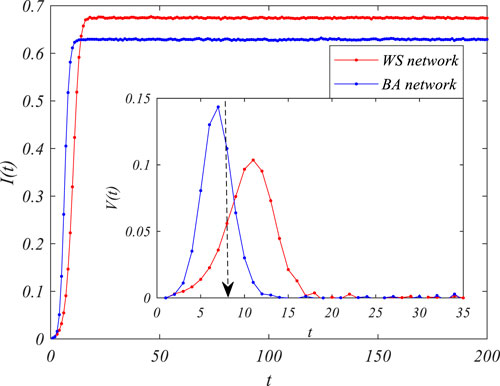
FIGURE 1. The susceptible–infected–susceptible (SIS) epidemic spreading process in different networks,
However, the performance of spread velocity is more interesting than that of the final propagation scale. In our simulation, we first described the spread velocity as the growth of the infection rate, i.e.,
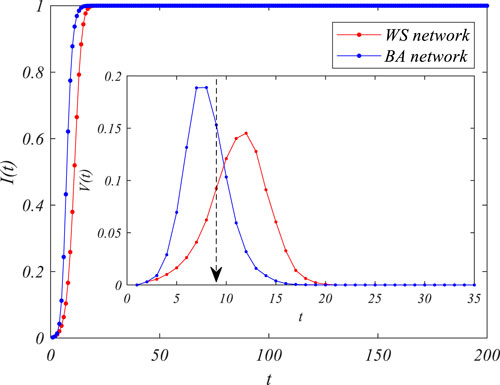
FIGURE 2. The susceptible–infected (SI) epidemic spreading process in different networks,
Moreover, we also measured the moment at which the steady state of the infection first arrives [T(i_max)] under different infection rates
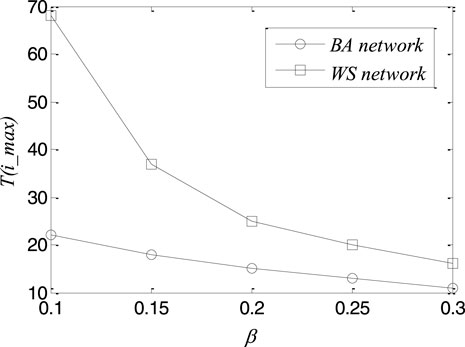
FIGURE 3. The time of reaching the steady states of the epidemic spread under different infection rates in the Barabási–Albert (BA) and Watts–Strogatz (WS) networks.
We proposed a multi-indicator-based measurement to quantify network robustness against the epidemic by combining the epidemic threshold, the infection density at steady state, and the spread velocity. Suppose that, in the SIS epidemic model, the rate of a susceptible node being infected by a single infected neighbor is
The network robustness with respect to the epidemic spread can be written as
Equation 2 shows that the greater the value of
The real-time robustness of network G can be written as
Especially, when
where Ts represents the moment when the infection reaches a steady state for the first time. Then, the network robustness can be written as
which is the viral conductance proposed in Eq. 13.
Based on the SI and SIS epidemic models, we can further write the robustness of the network with respect to the spread of the SI and SIS epidemic models.
The robustness of homogeneous networks with respect to the spread of the SI model is shown. The state of each node in the SI model is either infected or healthy, and the change in infected individuals over time can be described as
By separating the variables, Eq. 6 can be written as
Integrating both sides of Eq. 7, we can obtain
The density of the infected nodes at time t can be written as
The final infection density of the SI model is equal to 1, i.e.,
The robustness of homogeneous networks with respect to the spread of the SIS model is calculated. Ignoring the degree of correlations in the nodes of the homogeneous networks, the density of the infected nodes at time t in the SIS epidemic model, i.e., i(t), satisfies
Integrating both sides of Eq. 12,
Then, Eq. 13 can be rewritten as
We can obtain
After a simple combination, Eq. 15 can be rewritten as
The density of the infected nodes at time t can be written as
Let Eq. 12 be equal to 0. We can obtain
Based on Eqs. 5 and 17, the robustness of the homogeneous network G with respect to the spread of the SIS epidemic can be written as
Using simple operational processes,
Based on the new network robustness measurement we proposed, Monte Carlo simulations were performed to further explore the robustness of the different networks with respect to the spread of the epidemic. It is generally known that most of the real-world networks are characterized by a high clustering effect, a short average path length, and power law node degree distribution, i.e., small-world phenomenon and scale-free property. Therefore, WS small-world networks, BA scale-free networks, and several real-world networks were used in our simulations. All the simulation results were averaged over 500 runs.
Firstly, the BA and WS networks, with the same average degree,
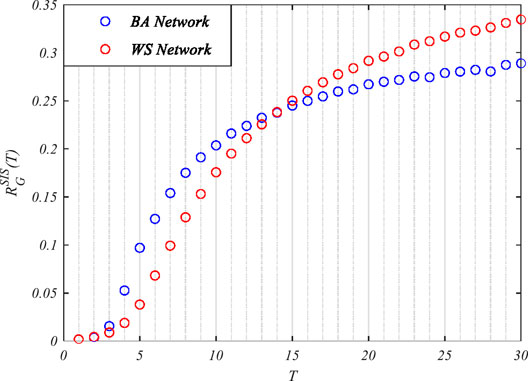
FIGURE 4. The robustness of the Watts–Strogatz (WS) and Barabási–Albert (BA) networks with respect to the susceptible–infected–susceptible (SIS) epidemic model.
Moreover, the simulations were carried out in a group of WS small-world networks, where the irregularity/randomness of the networks increases as the value of the rewiring rate p grows following the generation algorithm of the WS network. Especially, when p = 0, the network is a regular graph; when p = 1, the network is completely random. Figure 5 shows that, as p grows,
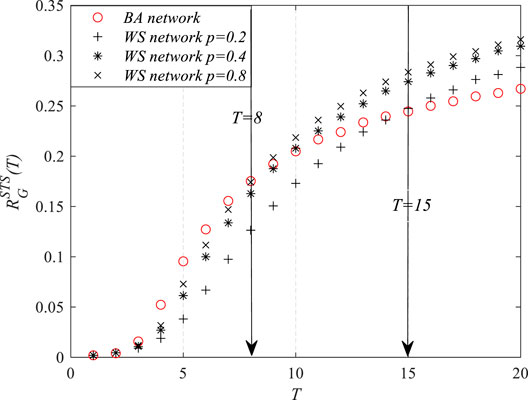
FIGURE 5. The robustness of homogeneous networks at time T with respect to the susceptible–infected–susceptible (SIS) epidemic spread.
The above simulation results indicated that it is not adequate to simply conclude which network is more robust with respect to the epidemic. The robustness of the network changes with time, and the network does not always show a strong/weak robustness at all stages of the epidemic. During the early stage of the epidemic spread, the robustness of homogeneous networks was stronger than that of the heterogeneous networks. After the propagation reached the steady state, heterogeneous networks showed better robustness than the homogeneous networks.
To analyze the impact of the degree distribution on network robustness with respect to the epidemic, simulations were also carried out in the WS and BA networks with different average degrees,

TABLE 1. The robustness of the Watts–Strogatz (WS) and Barabási–Albert (BA) networks with different <k> values at the steady state (T = 30)
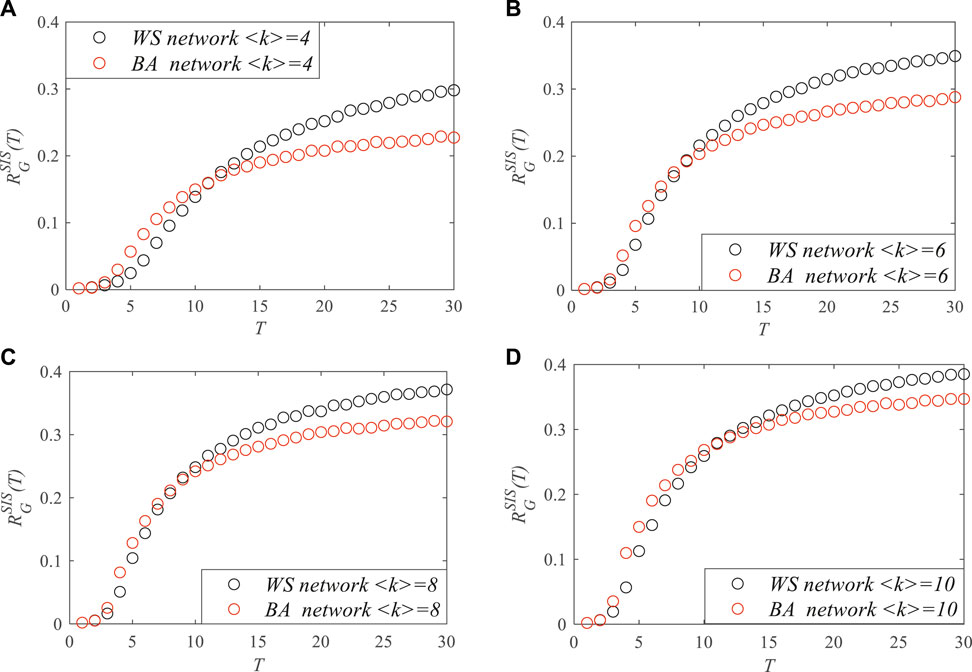
FIGURE 6. The robustness of the Watts–Strogatz (WS) and Barabási–Albert (BA) networks with different <k> values at time T with respect to the susceptible–infected–susceptible (SIS) epidemic spread. (A) <k> = 4. (B) <k> = 6. (C) <k> = 8. (D) <k> = 10.
Figure 6 shows the changes of network robustness as time T increased in the WS and BA networks with different average degrees,
We also applied the proposed metric to real-world networks where the dynamics processes can be described by epidemic models [24–27]. For example, the virus spread in e-mail networks, the information transfer in neural networks, and rumor diffusion in online social networks. In this paper, three real-world networks were used to validate our results on network models [28]: 1) e-mail network—the network of e-mail interchanges between members of the University Rovira i Virgili (Tarragona); 2) neural network—the network representing the neural network of Caenorhabditis elegans, which was compiled by D. Watts and S. Strogatz; and 3) Facebook network—the complete Facebook network data (from a single-time snapshot in September 2005) of Caltech. Only intra-college links were included. The basic topological properties of these three networks are shown in Table 2. In order to study the impact of degree distribution on the robustness of real-world networks, new network models were created by rewiring the links in the real-world networks. After rewiring, the heterogeneity of the degree distribution of nodes was reduced, while the numbers of nodes and links remained unchanged, and the new created networks were connected graphs.
Figure 7 shows the impact of degree distribution on the robustness of real-world networks with respect to the spread of the SIS epidemic. We can see that, at the early stage of the epidemics, the robustness of the real-world networks (red circles) was worse than that of the new created network models (black circles). That is to say, the heterogeneity of the degree distributions of nodes can reduce the network robustness at the early stage of the epidemic. After the propagation reached a steady state, the robustness of the real-world networks (red circles) became stronger than that of the new created network models (black circles). The simulation results confirmed that homogeneous networks present stronger robustness than do heterogeneous networks at the early age of the epidemic, and the robustness of the heterogeneous networks becomes stronger than that of the homogeneous ones with the progress of the epidemic. In addition, we can see from Figure 7 that the time point when the robustness of the real networks was stronger than that of the homogeneous networks was becoming earlier with the increase of the average degree (as shown in Table 2, the average degree was becoming larger from the e-mail network to the Facebook network, i.e., from Figures 7A–C).

FIGURE 7. The robustness of real-world networks at time T with respect to the susceptible–infected–susceptible (SIS) epidemic spread. (A) E-mail network. (B) Neural network. (C) Facebook network.
In summary, the simulation showed different results from previous studies based on the new measures of network robustness with respect to the spread of epidemic proposed in this paper. Firstly, the robustness of the heterogeneous networks was not always better than that of the homogeneous networks. During the initial stage of propagation, the homogeneous networks showed better robustness than did the heterogeneous networks, and at the steady state, the heterogeneous networks became more robust than the homogenous networks. Furthermore, in both homogeneous and heterogeneous networks, the networks became more vulnerable as the average degree increased. In homogeneous networks, the robustness of the networks with respect to the spread of the virus decreased as p increased, i.e., the irregularity in the networks increased the vulnerability of the networks. The simulation results provided us with some ideas to enhance the network robustness with respect to the dynamic propagation processes. For example, at the beginning of the epidemic, mass gathering was harmful to improve network robustness, and after the epidemic entered a relatively stable period, avoiding small-scale clustering would help enhance the network robustness against epidemic spread.
Considering the spread velocity, epidemic threshold, and the infection density at steady state, a novel metric to quantify network robustness with respect to epidemics was proposed in this paper. The real-time network robustness and the robustness of different networks were discussed. The simulation results showed some interesting conclusions of the impact of network structure on network robustness. The robustness of heterogeneous networks was not always stronger than that of the homogeneous networks. At the early stage of the epidemic, the homogeneous networks showed stronger robustness than did the heterogeneous networks, and at the steady state, the robustness of the heterogeneous networks was stronger than that of the homogeneous networks. In addition, the increase of irregularity and the average degree can enhance the network robustness with respect to epidemics. Our future work will explicitly focus on proposing a heuristic for computing the robustness metric for general networks. In addition, the metric proposed in our paper can be applied to network optimization to maximize network robustness with respect to different kinds of dynamic propagation processes.
The original contributions presented in the study are included in the article/Supplementary Material. Further inquiries can be directed to the corresponding author.
BS was responsible for all aspects of the work. G-PJ provided the ideas for the analysis of the robustness of the real-time networks. YS and YG contributed to the analysis of the robustness of the real-time networks. JY contributed to the simulations in Results. XW contributed to the analysis of simulations in Results.
This work was supported by the Natural Science Foundation of Jiangsu Provence (grant no. SJ220036), the Natural Science Foundation of the Jiangsu Higher Education Institutions of China (grant no. TJ220032), the Scientific research start-up fund of NJUPT (grant no. NY219169), and the National Natural Science Foundation of China (grant no. 61802155). This research was partially supported by School of Modern Posts at Nanjing University of Posts and Telecommunications.
The authors declare that the research was conducted in the absence of any commercial or financial relationships that could be construed as a potential conflict of interest.
All claims expressed in this article are solely those of the authors and do not necessarily represent those of their affiliated organizations, or those of the publisher, the editors, and the reviewers. Any product that may be evaluated in this article, or claim that may be made by its manufacturer, is not guaranteed or endorsed by the publisher.
The authors would like to thank the participating colleges for the helpful discussion.
1. Pastor-Satorras R, Vespignani A. Epidemic Dynamics and Endemic States in Complex Networks [J]. Phys Rev E Stat Nonlin Soft Matter Phys (2001) 63(2):066117. doi:10.1103/PhysRevE.63.066117
2. Boguñá M, Pastor-Satorras R. Epidemic Spreading in Correlated Complex Networks [J]. Phys Rev E Stat Nonlinear Soft Matter Phys (2002) 66(4 Pt 2):047104.
3. Mata AS. An Overview of Epidemic Models with Phase Transitions to Absorbing States Running on Top of Complex Networks [J]. Chaos (2021) 31(1):012101. doi:10.1063/5.0033130
4. Zhu J, Jiang Y, Li T, Li H, Liu Q. Trend Analysis of COVID-19 Based on Network Topology Description [J]. Front Phys (2020) 8:517. doi:10.3389/fphy.2020.564061
5. Muoz NG, Thomson MC, Stewart-Ibarra AM, Vecchi GA, Chourio X, Nájera P, et al. Could the Recent Zika Epidemic Have Been predicted? [J]. Front Microbiol (2017) 8:1291. doi:10.3389/fmicb.2017.01291
6. Battiston F, Cencetti G, Iacopini I, Latora I, Lucas M, Patania A, et al. Networks bxeyond Pairwise Interactions: Structure and Dynamics [J]. Phys Rep (2020) 874:1–92. doi:10.1016/j.physrep.2020.05.004
7. Shang Y. Subgraph Robustness of Complex Networks under Attacks [J]. IEEE Trans Syst Man Cybern, Syst (2019) 49(4):821–32. doi:10.1109/tsmc.2017.2733545
8. Martin C, Niemeyer P. Influence of Measurement Errors on Networks: Estimating the Robustness of Centrality Measures [J]. Net Sci (2019) 7(2):180–95. doi:10.1017/nws.2019.12
9. Hay JA, Kennedy-Shaffer L, Kanjilal S, Lennon NJ, Gabriel SB, Lipsitch M, et al. Estimating Epidemiologic Dynamics from Single Cross-Sectional Viral Load Distributions [J]. medRxiv: preprint server Health Sci (2020) doi:10.1126/science.abh0635
10. Wagner CE, Saad-Roy CM, Morris SE, Baker RE, Mina MJ, Farrar J, et al. Vaccine Nationalism and the Dynamics and Control of SARS-CoV-2 [J]. Science (2021) 373(6562):eabj7364. doi:10.1126/science.abj7364
11. Chen J, Huang Y, Zhang R, Zhu Q. Optimal Quarantining Strategy for Interdependent Epidemics Spreading over Complex networks [J], Online: arXiv:2011.14262v2 (2021).
12. Socievole A, De Rango F, Scoglio C, Van Mieghem P. Assessing Network Robustness under SIS Epidemics: The Relationship between Epidemic Threshold and Viral Conductance [J]. Computer Networks (2016) 103(jul.5):196–206. doi:10.1016/j.comnet.2016.04.016
13. Youssef M, Kooij R, Scoglio C. Viral Conductance: Quantifying the Robustness of Networks with Respect to Spread of Epidemics [J]. J Comput Sci (2011) 2(3):286–98. doi:10.1016/j.jocs.2011.03.001
14. Song B, Wang X, Ni W, Song Y, Liu RP, Jiang G-P, et al. Reliability Analysis of Large-Scale Adaptive Weighted Networks [J]. IEEE Trans.Inform.Forensic Secur. (2020) 15:651–65. doi:10.1109/tifs.2019.2926193
15. Lorenzi T, Pugliese A, Sensi M, Zardini A, Evolutionary Dynamics in an SI Epidemic Model with Phenotype-Structured Susceptible Compartment [J] J. Mathematical Biol. (2021) 83(72).
16. Cai CR, Wu ZX, Holme P. Multistage Onset of Epidemics in Heterogeneous Networks. Phys Rev E (2021) 103(3):032313. doi:10.1103/PhysRevE.103.032313
17. Fineberg HV, Wilson ME. Epidemic Science in Real Time [J]. Science (2009) 324(5930):987. doi:10.1126/science.1176297
18. Callaway DS, Newman MEJ, Strogatz SH, Watts DJ. Network Robustness and Fragility: Percolation on Random Graphs [J]. Phys Rev Lett (2000) 85(25):5468–71. doi:10.1103/physrevlett.85.5468
19. Barabasi AL, Albert R. Emergence of Scaling in Random Networks [J]. Science (1999) 286(5439):509–12. doi:10.1126/science.286.5439.509
20. Watts DJ, Strogatz SH. Collective Dynamics of 'small-World' Networks [J]. Nature (1998) 393:440–2. doi:10.1038/30918
21. Laura VC, James MS, Charles O, Asiedu-Bekoe F, Kuffour Afreh O, Fernandez K, et al. Reactive Vaccination as a Control Strategy for Pneumococcal Meningitis Outbreaks in the African Meningitis belt: Analysis of Outbreak Data from Ghana [J]. Vaccine (2019) 37(37):5657–63.
22. Jamakovic A, Kooij RE, Mieghem PV, van Dam ER, Robustness of Networks against Viruses: the Role of the Spectral Radius. ‘In Symposium on Communications & Vehicular Technology [C]//”. IEEE (2006). doi:10.1109/SCVT.2006.334367
24. Kumar S, Saini M, Goel M, Aggarwal N, Modeling Information Diffusion in Online Social Networks Using SEI Epidemic Model [J]. Proced Computer Sci (2020) 171:672–8. doi:10.1016/j.procs.2020.04.073
25. Nakarmi U, Rahnamay-Naeini M, Khamfroush H. Critical Component Analysis in Cascading Failures for Power Grids Using Community Structures in Interaction Graphs [J]. IEEE Trans Netw Sci Eng (2019) 1. doi:10.1109/TNSE.2019.2904008
26. Yang L-X, Yang X. A New Epidemic Model of Computer Viruses [J]. Commun Nonlinear Sci Numer Simulation (2014) 19(6):1935–44. doi:10.1016/j.cnsns.2013.09.038
27. Liu J, Pare PE, Nedich A, Tang CY, Beck CL, Başar T. Analysis and Control of a Continuous-Time Bi-virus Model [J]. IEEE Trans Automatic Control (2019) 64(12):4891–4906. doi:10.1109/TAC.2019.2898515
Keywords: real-time robustness, epidemic spread, spread velocity, complex network, robustness metrics
Citation: Song B, Jiang G-P, Song Y, Yang J, Wang X and Guo YJ (2022) A Novel Metric to Quantify the Real-Time Robustness of Complex Networks With Respect to Epidemic Models. Front. Phys. 9:805674. doi: 10.3389/fphy.2021.805674
Received: 30 October 2021; Accepted: 07 December 2021;
Published: 21 January 2022.
Edited by:
Gaogao Dong, Jiangsu University, ChinaReviewed by:
Haiyan Wang, Arizona State University, United StatesCopyright © 2022 Song, Jiang, Song, Yang, Wang and Guo. This is an open-access article distributed under the terms of the Creative Commons Attribution License (CC BY). The use, distribution or reproduction in other forums is permitted, provided the original author(s) and the copyright owner(s) are credited and that the original publication in this journal is cited, in accordance with accepted academic practice. No use, distribution or reproduction is permitted which does not comply with these terms.
*Correspondence: Yurong Song, c29uZ3lyQG5qdXB0LmVkdS5jbg==
Disclaimer: All claims expressed in this article are solely those of the authors and do not necessarily represent those of their affiliated organizations, or those of the publisher, the editors and the reviewers. Any product that may be evaluated in this article or claim that may be made by its manufacturer is not guaranteed or endorsed by the publisher.
Research integrity at Frontiers

Learn more about the work of our research integrity team to safeguard the quality of each article we publish.