- 1Clinical Cooperation Unit Translational Radiation Oncology, German Cancer Consortium (DKTK) Core-Center Heidelberg, National Center for Tumor Diseases (NCT), Heidelberg University Hospital (UKHD) and German Cancer Research Center (DKFZ), Heidelberg, Germany
- 2Division of Molecular and Translational Radiation Oncology, Heidelberg Faculty of Medicine (MFHD) and Heidelberg University Hospital (UKHD), Heidelberg Ion-Beam Therapy Center (HIT), Heidelberg, Germany
- 3Heidelberg Faculty of Medicine (MFHD), Heidelberg Institute of Radiation Oncology (HIRO), National Center for Radiation Oncology (NCRO), Heidelberg University Hospital (UKHD), Heidelberg Ion-Beam Therapy Center (HIT), and German Cancer Research Center (DKFZ), Heidelberg, Germany
- 4Department of Physics and Astronomy, Heidelberg University, Heidelberg, Germany
- 5Heidelberg Ion-Beam Therapy Center (HIT), Department of Radiation Oncology, Heidelberg University Hospital (UKHD), Heidelberg, Germany
- 6National Centre of Oncological Hadrontherapy (CNAO), Medical Physics, Pavia, Italy
To start clinical trials with the first clinical treatment planning system supporting raster-scanned helium ion therapy, a comprehensive database of beam characteristics and parameters was required for treatment room-specific beam physics modeling at the Heidelberg Ion-Beam Therapy Center (HIT). At six different positions in the air gap along the beam axis, lateral beam profiles were systematically measured for 14 initial beam energies covering the full range of available energies at HIT. The 2D-array of liquid-filled ionization chambers OCTAVIUS from PTW was irradiated by a pencil beam focused at the central axis. With a full geometric representation of HIT’s monitoring chambers and beamline elements in FLUKA, our Monte Carlo beam model matches the measured lateral beam profiles. A second set of measurements with the detector placed in a water tank was used to validate the adjustments of the initial beam parameters assumed in the FLUKA simulation. With a deviation between simulated and measured profiles below ±0.8 mm for all investigated beam energies, the simulated profiles build part of the database for the first clinical treatment planning system for helium ions. The evolution of beamwidth was also compared to similar simulations of the clinically available proton and carbon beam. This allows a choice of treatment modality based on quantitative estimates of the physical beam properties. Finally, we investigated the influence of beamwidth variation on patient treatment plans in order to estimate the relevance and necessary precision limits for lateral beam width models.
1 Introduction
Lyman and Howard measured the first helium Bragg peaks to use in radiotherapy in the 1970s [1]. Between 1975 and 1992, over 2000 patients received helium ion radiotherapy at the Lawrence Berkeley National Laboratory (LBNL) [2–6]. However, the treatment with helium ions was discontinued in the early 1990s, when the Bevatron and 184-inch-synchrocyclotron were dismantled.
At the Heidelberg Ion-Beam Therapy Center (HIT), protons, helium, carbon, and oxygen ions are accelerated and delivered with active beam scanning [7] for radiotherapeutic and research purposes since 2009. To this day, only protons and carbon ions are in regular clinical use. However, with the work presented in this study the first clinical application of helium ion beams was possible this year.
The treatment planning system (TPS) previously used (syngo® PT Treatment, Siemens AG, Erlangen, Germany) had only been commissioned for carbon ion and proton treatment. Therefore, we supported the beam physics modeling within the first commercial TPS (RayStation, RaySearch Laboratories, Stockholm, Sweden [8]) supporting helium ion irradiation through the creation of a database comprising beam-specific parameters and characteristics based on measurements or simulations.
A general attempt at gathering facility-specific helium beam properties at HIT had been made by Tessonnier et al. [9–12] by establishing a Monte Carlo (MC) framework for recalculating irradiation plans with FLUKA [13, 14]. However, the agreement between measurement and simulations showed limitations for fields with high initial beam energies [10], calling for a more precise estimation of secondary particle production in medium. Since then, new charge- and mass-changing cross-sections in the energy region between 70–220 MeV/u have been determined experimentally [15] and updated in FLUKA. At HIT, attempts of measuring the secondary particles produced by helium ions have been made [16]. Additional characterization of the double differential nuclear reaction cross-section for helium in the therapeutically relevant energy range could further improve dose estimation in beam entrance and fragmentation tail [17]. The implementation of this newly available data calls for revalidation of the beam properties in our MC framework.
Helium ions exhibit physical and biological properties that are moderate between protons and carbon ions. In contrast, carbon ions feature a very sharp lateral penumbra, a sharp peak in the depth dose distribution, and a high linear energy transfer (LET) compared to helium ions and protons. However, their produced secondary particles result in a more significant fragmentation tail. Proton Bragg peaks, on the other hand, exhibit a smaller peak-to-plateau ratio than helium ions. Both, carbon ions and protons, have distinct strengths and weaknesses in the context of clinical practice, as nicely summarized in review papers [18, 19]. Thus, helium ions can bridge the gap in achievable dose conformality and LET between proton and carbon ion beams.
Similar to the HIT carbon ion commissioning [20–23], the set of data gathered for beam physics modeling in the RayStation TPS included laterally integrated depth dose curves (iDDDs), calibration of absolute dose per particle, and particle spectra [24]. However, while the collection of depth dose curves and absolute calibrations of helium ion dose was updated with respect to previous publications, lateral profiles in the air gap between the last beamline element and phantom had never been thoroughly investigated for raster-scanned helium ion beams.
Schardt et al. reported in [25] how beamline materials and the airgap affect the beam widths of proton and carbon ions. On the one hand, carbon ions are relatively heavy, and the beam broadening in air is primarily independent of the initial beam energy. The broadening of proton beams, on the other hand, is much more considerable than for carbon of any energy, and it depends heavily on the initial beam energy. The same multiple scattering processes apply to helium ions. While the resulting broadening of beamwidth could be estimated analytically via the Highland approximation [26, 27], this approach would neglect large angle scattering and the dose contribution of secondary hadron production in the beamline. Analytical calculations of beam broadening by multiple scattering via Molière-theory [28–30] would be quite time-intensive and would still neglect the beam shape specific to the HIT beamline. Moreover, no knowledge of the actual beam shape in air could be gained. Würl et al. [31] showed for protons that the beam shape in air impacts the dose distribution in the patient as well.
Therefore, precise knowledge of the profiles in the air between the vacuum exit and the patient should improve the prediction of the beam shape at the surface entrance point of a phantom or patient. As the lateral dose distribution in this airgap has not been investigated for actively scanned helium beams before, this work quantifies the evolution of the beamwidth and its impact on treatment planning.
Measured beam profiles in air provide the starting beam parameters in vacuum for our MC physical beam model. The MC model then provides particle spectra and lateral dose distributions as base data to the clinical TPS in addition to measured iDDDs. The TPS then parameterizes the beam profile at the surface entrance point of the patient and propagates the dose based on analytical dose models. Apart from clinical use of the TPS, the MC beam model with all validated beam parameters can support further experimental studies at HIT.
This work reports on the creation of the database of lateral dose profiles specific to the HIT beamline for the first commercial TPS for helium ions. The lateral profiles of single-spot pencil beams are measured in the air gap between the last element of the beamline and patient, as well as inside a water tank. As not all profiles of the 255 available beam energies can be measured, an MC beam model is created, and a database of the lateral beam profiles is simulated in FLUKA.
Furthermore, the beam profiles of helium are compared to those of carbon and proton beams. Lastly, the impact of deviations in the beam profile on dose distributions in patients is studied, and possible applications of the gained knowledge are discussed.
2 Materials and Method
2.1 Helium Ions at Heidelberg Ion Beam Therapy-Center
The HIT is a synchrotron-based particle therapy center with two horizontal treatment rooms and a gantry. Three ion sources enable the acceleration of protons (1H), helium (4He), carbon (12C), and oxygen (16O) ions. Since 2009, patients have been treated daily with proton and carbon ion beams. The synchrotron accelerates helium ions to 255 discrete energies between 50.57 MeV/u and 220.51 MeV/u, corresponding to ranges of approximately 2.1 and 30.8 cm in water without any beam modifiers. Bunches of primary ions are extracted from the synchrotron by the so-called beam scraper using slow knockout extraction [32, 33] and sent to the individual treatment rooms. Scanning magnets bend the beam across the treated volume, which results in a virtual source-axis-distance of approximately 7 m in the horizontal rooms and about 43 m in the gantry.
Before entering each patient treatment room, the beam passes through a monitoring system (BAMS) consisting of three ionization chambers and two multi-wire proportional chambers, as described by Tessonnier et al. [9]. Behind the BAMS chambers, additional beam modifiers can be inserted into the beamline at positions indicated in Figure 1. A 3 mm ripple filter (RiFi3mm) [34] spreads out the individual Bragg peaks to about 2–3 mm and reduces the range by the same length. The insertion of the ripple filter allows a tumor volume to be irradiated faster, as homogeneity in depths can be achieved using only every third available beam energy. A PMMA range shifter of approximately 2 cm water equivalent thickness allows the irradiation of very superficial tumors. It can be placed anywhere between the beamline exit and the room’s isocenter.
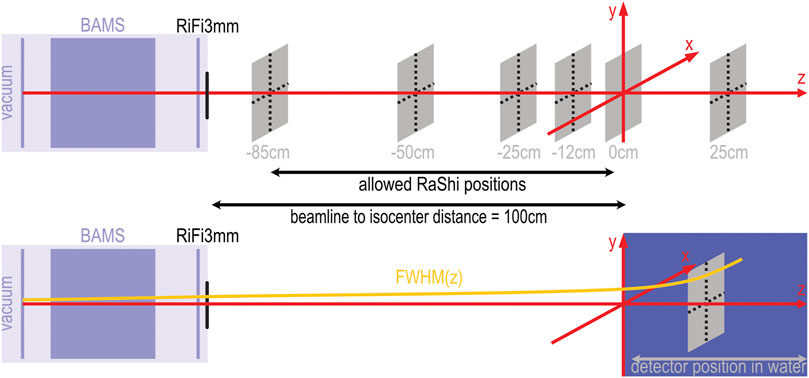
FIGURE 1. Experimental setup schematic for measurements and simulation. The upper half shows the beamline with monitor system (BAMS) and ripple filter (RiFi3mm) and the positions at which measurements were performed with the OCTAVIUS phantom in air. The lower half of the sketch shows the position of the water tank relative to the isocenter marked by the red coordinate system. A yellow curve sketches the assumed evolution of the beamwidth. The beamline to isocenter distance is 100 cm in the horizontal treatment rooms. At the gantry, this distance is reduced to 80 cm. The allowed positions for the range shifter (RaShi) are continuous between −85 and −2 cm for the horizontal treatment room and between −38.5 and −2 cm for the gantry.
Each irradiation requires a control file including desired beam energies, beam positions, discrete nominal beamwidths and particle intensity chosen from the accelerator library (LIBC). This so-called irradiation plan also includes the gantry angle and detector or patient table position.
While the beam position (spot) can theoretically be any continuous position in the x,y-plane at the room’s isocenter, in practice at HIT, spots are placed on a cartesian or hexagonal grid with fixed spacing to compensate for variations in beamwidth caused by the synchrotron and beamline. The nominal beamwidth is defined as the full width at half maximum (FWHM) in the treatment room’s isocenter without any beam modifiers placed in the room. The methodology of creating the accelerator library has been described before [12]. The LIBC contains four discrete nominal beamwidths for each beam energy. Within each discrete configuration, the total beamwidth decreases with increasing beam energy. For treatment planning, a relatively stable spot size over the whole energy range is desired to achieve a homogeneous dose with a fixed spot spacing. Following the results of Parodi et al. [20], beamwidths at least three times larger than the spot spacing still assure homogeneity of the treatment fields. This assumption was made during the first trials for raster scanning ion beams [7, 35]. Thus, for a proposed spot spacing of approximately 2 mm, the beamwidth must be at least 6 mm to achieve a robust homogeneity against beamwidth variation. As the smallest available nominal beamwidth is smaller than this threshold for energies larger than 167 MeV/u, the second nominal beamwidth setting is used for higher energies.
2.2 Measurements with Octavius Phantom
To measure the lateral profiles in air, we positioned a 2D-ionization chamber array (OCTAVIUS 1000 SRS, SN000308, PTW Freiburg) perpendicular to the central beam axis at six positions along the beam axis. Relative to the treatment room’s isocenter, the reference point of the detector was positioned at −85, −50, −25, −12, 0 and 12 cm, where “-” denotes any upstream positions. In Figure 1, the measurement positions relative to the isocenter are depicted by grey squares.
The OCTAVIUS 1000 SRS consists of 977 liquid-filled ionization chambers with a sensitive volume of 3 mm³ in a cartesian grid of 2.5 mm spacing in a central area of (5.5 × 5.5) cm2. At the outer edges the ionization chambers are spaced twice as far apart.
With a dynamic measurement range from 0.2 to 36 Gy/min, the OCTAVIUS chamber array allowed a 0.1 mGy resolution in absolute dose measurement, with a relative uncertainty of
For each measurement position and tabulated beamwidth, we obtained the lateral dose distributions for 14 initial beam energies distributed over the entire available energy range by irradiating the detector with approximately 10⁹ helium ions on the central beam axis. The particle intensity was adjusted for each energy to ensure dose deposition rates within the measurement range.
At the isocenter, we irradiated the same spots without the ripple filter inserted into the beam, allowing for comparison to the accelerator specifications.
Following the same protocol, we measured lateral dose distributions in the gantry at a 90° rotation angle.
2.3 Monte Carlo Simulation
Our simulation of the lateral profiles was based on the MC code FLUKA [13, 14] with the implementation of BAMS and RiFi3mm reported in previous works [9, 10, 21]. All physical interactions were simulated in FLUKA with the HADROTHERAPY defaults. We assumed that delta electrons are not transported by switching off delta ray production. Additionally, we reduced the step size for charged hadrons and muons to 0.02 of the kinetic energy. The evaporation model for heavy fragments and coalescence mechanism was activated as well. All simulations ran with the physics models of the currently available FLUKA version.
The beam was assumed to be non-divergent before leaving the vacuum window of the beamline. For each discrete beam setting of the accelerator, the simulation required three beam parameters: initial beam energy in vacuum, initial Gaussian momentum dispersion, and the Gaussian width of the beam’s initial lateral fluence profile. The initial beam energy was assumed to be identical to the nominal beam energy. Following previous works [9], we manually modified the initial momentum spread until simulated depth dose curves matched the commissioning measurements in shape and peak width. With the ripple filter removed from the simulated beamline, we iteratively optimized the initial Gaussian fluence profile to reproduce the nominal beamwidth at the isocenter. Some fine-tuning of the initial parameters regarding those used in previous works [11] was necessary for the updated FLUKA version (2021.1).
Once we found the optimal initial beamwidth, the profiles at all six detector positions were simulated with the ripple filter in place as follows: The simulated geometry included a detailed representation of BAMS and additional beam modifiers. For the profiles in air, a thin disk of water (
2.4 Evaluation and Comparison of Profiles
From the 2D dose array of the OCTAVIUS, we extracted the central x- and y-profiles and diagonal profiles. These four profiles were fitted with a Gaussian to determine the beam center and normalization. If necessary, a shift and normalization to the maximal dose were applied to overcome lateral positioning uncertainties.
Previous simulations for protons and carbon ions assumed the lateral beamwidth
At the isocenter (
The shape of measurable horizontal profiles is influenced by the slow knockout-extraction from the synchrotron [32]. Thus, only the beam width from the vertical y-profiles measured without ripple filter at the isocenter was considered in calculating the scaling factor.
After scaling the profiles measured with ripple filter by
2.5 Impact of Beam Width Variation on Patient Treatment
We investigated the effect of the beamwidth at the surface entry point on a treatment plan optimized with RayStation 10 A. A clinical-like treatment plan for helium therapy was generated using multi-field optimization on a patient data set representative for meningioma treatment. For simplicity, we chose beam angles of 0° and 270° and placed the isocenter in the center of the treatment volume. The biological dose optimization was based on the modified microdosimetric-kinetic model (mMKM) with an α/β-ratio of 2 Gy [24].
Then, we varied the beamwidth of the individual pencil beams in air close to the patient entrance point by approximately
From the recalculated plans, we extracted lateral profiles of biological and physical dose in the entrance channel of each beam and diagonally through the clinical target volume (CTV). The profiles extracted from the patient plan were compared and analyzed for differences in the penumbra (lateral distance between 20% and 80% of maximum dose) among the three scenarios. Additionally, we analyzed the dose-volume histograms (DVH) of the target volume (CTV around meningioma) and three neighboring organs at risk (OAR), namely the left parotid gland, right optical nerve and the brain stem.
3 Results
3.1 Beam Profiles
The beamwidth at FWHM at the isocenter is reproduced by the simulations as shown in Figure 2 and Table 1. The nominal accelerator beamwidth is reproduced within 4% when the ripple filter is removed from the beamline. The beam widening by the ripple filter is also reproduced in the simulations, as the dark blue line in Figure 2 shows. The scaled measurements agree well with the beamwidth extracted from simulated profiles for the beam with the ripple filter in place. The standard deviation of the scaled measured FWHM extracted from the four measured lateral profiles (horizontal, vertical and diagonal) is approximately 0.2 mm or 2% for each position and energy.

FIGURE 2. The lateral beam width (FWHM) at the isocenter of the horizontal treatment room. Comparison between measurement (triangles) and simulation (solid lines) with and without ripple filter. For clinical application, the ripple filter is inserted into the beamline. The measurements were scaled to reproduce the nominal accelerator settings when the ripple filter is not used. Between the measured energies, the beam width is interpolated linearly. At nominal beam energy of 167 MeV/u, the beam width jumps to the next higher tabulated focus to fulfill the >6 mm requirement. The measured FWHM has a standard deviation of approximately 0.2 mm at the isocenter.

TABLE 1. Lateral Widths (FWHM) of the lateral dose profile of a helium beam at the isocenter (z = 0 cm) without ripple filter as extracted from the simulated profiles in FLUKA and scaled profiles measured with the OCTAVIUS detector. Range (R80) and initial beam energy (E) of the unmodified beam and nominal width are also provided in addition to the absolute and relative deviation (ΔFWHM) between measured and simulated profiles.
Figure 3 shows the shape of lateral profiles at all measured positions for the helium beam with an initial energy of 107.93 MeV/u (158.08 MeV/u). This energy corresponds to a range of approximately 8.8 cm (17.3 cm) in water after passing the beamline and ripple filter. Triangles depict the measured profile. The simulated profiles are scaled to their maximum and shown as a blue line. While the nominal beamwidth without ripple filter is 8.9 mm (6.3 mm) at the isocenter, the measurement yields an average width of 8.8 mm (6.3 mm). The simulation produces a width of 9.2 mm (6.5 mm). With the ripple filter, the average measured beam width is 10.3 mm (7.2 mm) after scaling, and the simulated profile has a beamwidth of 10.5 mm (7.4 mm) at the isocenter. So, the ripple filter broadens the beam of this specific energy by approximately 1.4 mm (0.9 mm). For other investigated beam energies, the extracted profiles with ripple filter are provided in Table 2.
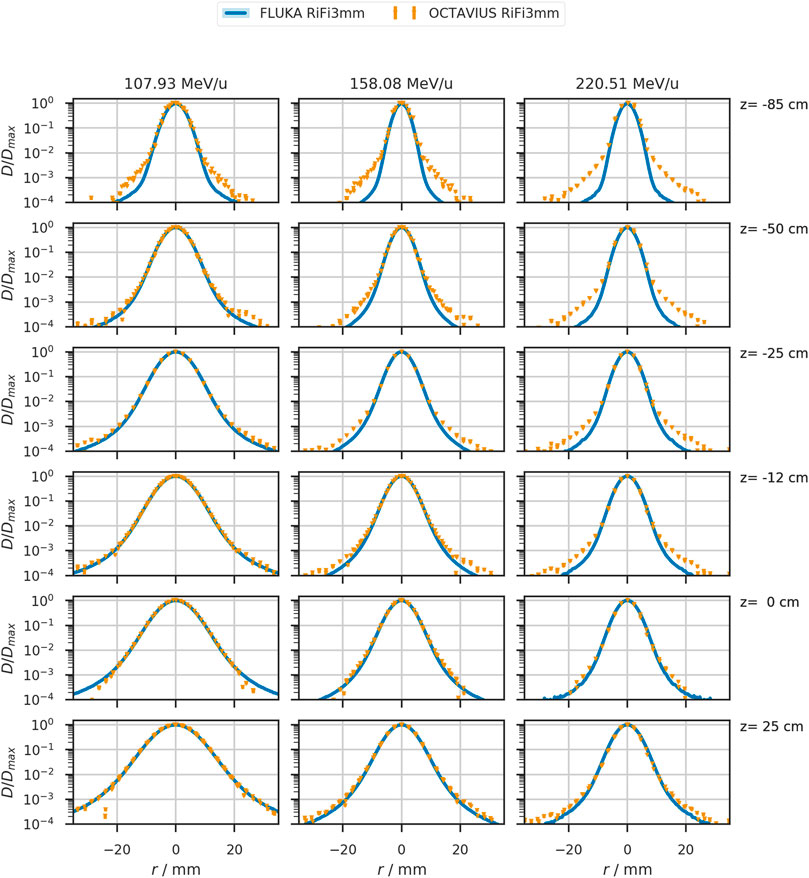
FIGURE 3. Lateral beam profiles in air of the 107.93 MeV/u, 158.08MeV/u, and 220.51 MeV/u helium beam as simulated in FLUKA (solid blue line) and measured (orange triangles). The detector position relative to the treatment room’s isocenter is indicated on the right of each row. Measured data contains datapoints from the four prominent profiles with an estimated uncertainty of at least 0.5% or 1 mGy for the local dose deposition. This uncertainty corresponds to four orders of magnitude lower than the local dose maximum in each profile.
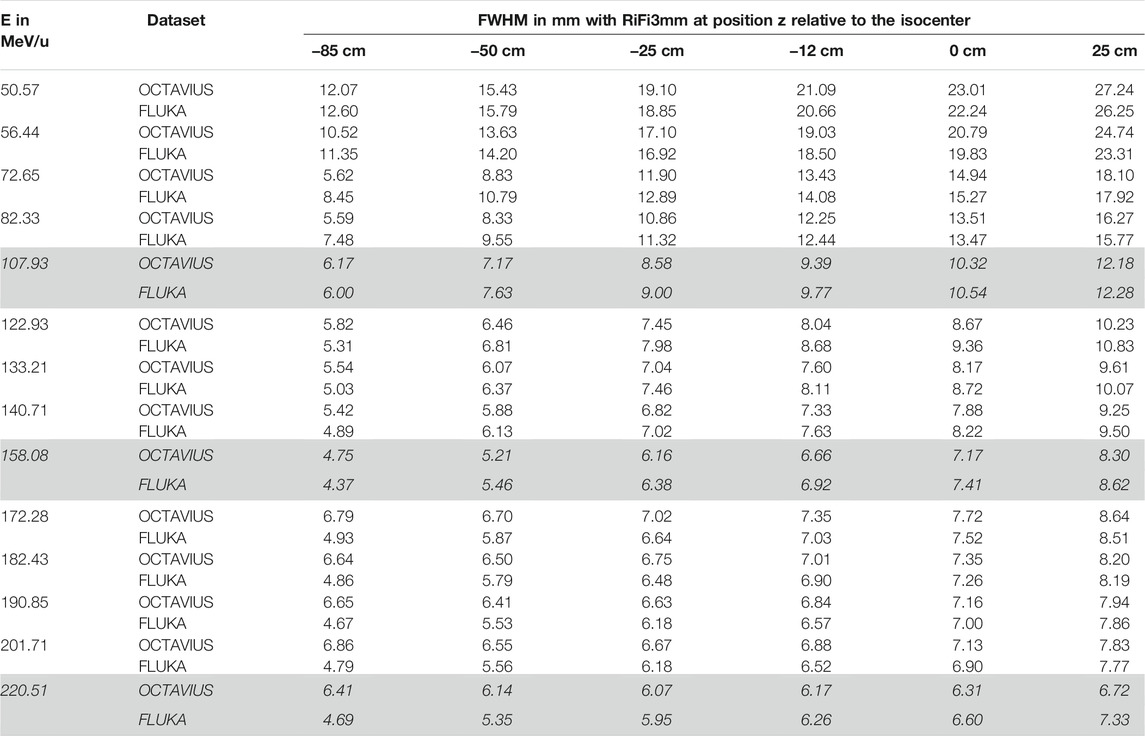
TABLE 2. Lateral beamwidth (FWHM) of the helium beam with ripple filter (RiFi3mm) at measured positions z in the airgap behind the last beamline component. Dose profiles were either measured with the OCTAVIUS phantom and scaled by the daily deviation of the unmodified beam from nominal beam width or simulated with FLUKA as the dose to water in a thin slice at the corresponding position in the treatment room. The standard deviation of measured lateral beamwidth for each position is approximately 0.2 mm for each position and energy. The profiles corresponding to the initial beam energies E, highlighted in italics, are plotted in Figure 3.
3.2 Effect of Beam Width Variation on Patient Treatment
In Figure 4, we show the effects of beamwidth variation on the dose distribution produced by a patient treatment plan. In the top panel (A), a selected slice of the patient CT with overlaid dose distribution is depicted for the original case, reduced and increased beam width from left to right. Dose profiles were extracted at the entrance of each of the two treatment fields, indicated by the purple (superior field) and orange (left field) line in panel (A). These dose profiles show a variation in the penumbra (distance between 20% and 80% of local dose maximum) between
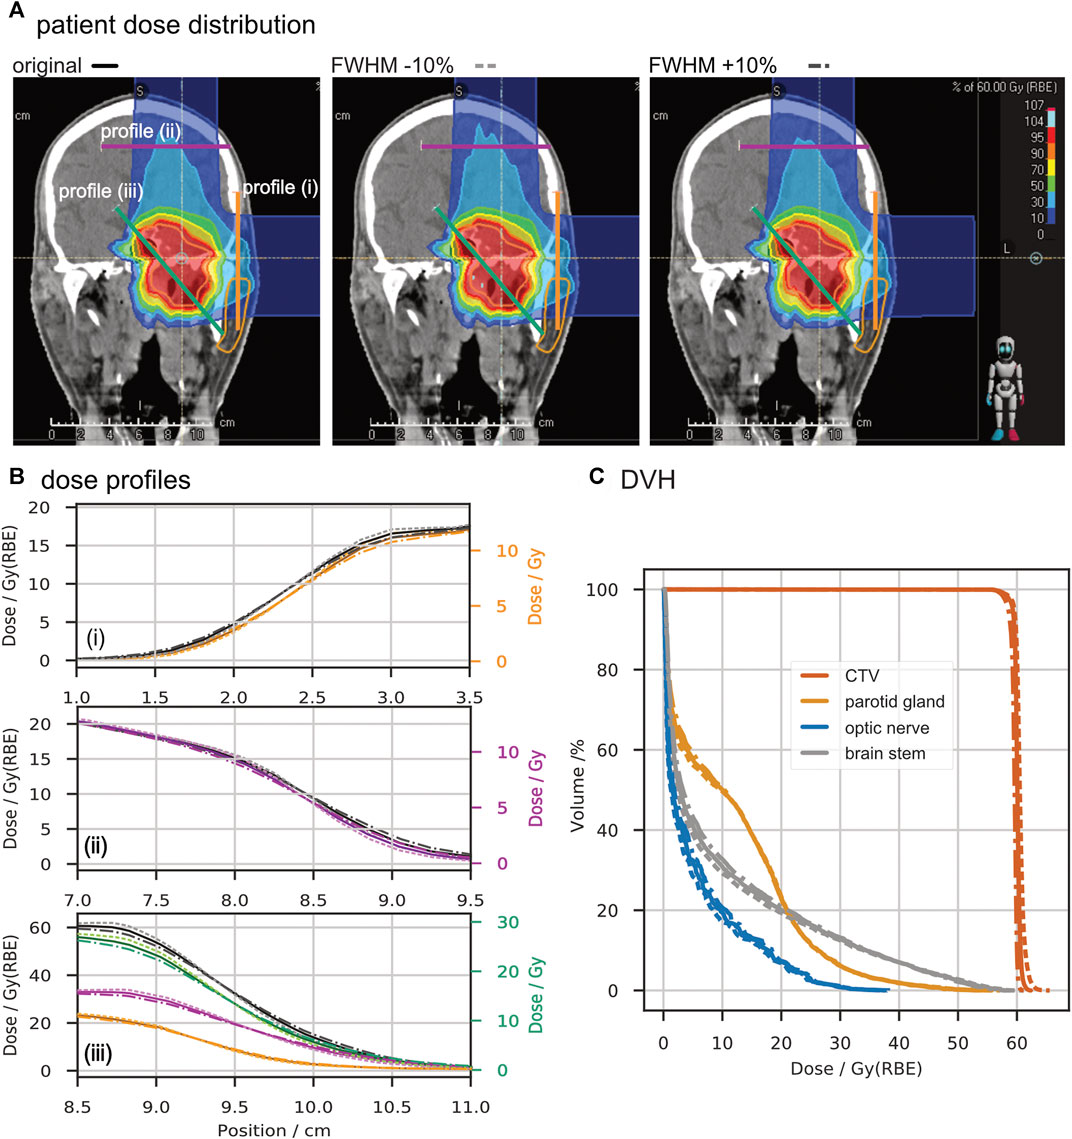
FIGURE 4. Comparison of a patient treatment plan with a change of ∓10% in beamwidth. Panel (A) shows screenshots of the dose distribution in the TPS with lines marked for profile extraction. Panel (B) depicts the extracted profiles in units of biologically equivalent dose (Gy (RBE)) and absorbed dose (Gy). From top to bottom, the entrance profile of the superior treatment field (i), the entrance profile of the lateral treatment field (ii), and a profile through the target volume (iii) are drawn. Panel (C) shows the dose-volume histograms for the clinical target volume (CTV) and critical organs (parotid gland, optic nerve, and brain stem) obtained from the three scenarios. In panels (B) and (C), solid lines represent data of the original plan, dotted lines depict the data with reduced beamwidth, and dash-dotted lines represent the increased beamwidth.
4. Discussion
4.1 Beamwidth in Air
The measured lateral profiles without ripple filter showed deviations from the nominal beam width (i.e., FWHM) at the isocenter of about 5%, which agrees with the standard deviation of the four averaged profiles.
Scaling the measured profiles with the daily deviation factor to nominal settings resulted in an agreement within ±0.8 mm between simulation and measurement in air.
For positions close to the beamline, the deviation between measured and simulated profiles was the largest. Scaling the measured data with the nominal beam width at the isocenter, as described in Section 2.4, improved the match between simulation and measurement for all positions.
As a variation of the beamwidth at the isocentre between ±15% is occasionally observed in daily quality assurance measurements, the reproduction of nominal settings and measured beam widths by the simulation is very well achieved. Thus, the simulated profiles are validated to become a critical component of the base data for the clinical TPS.
The enlarged deviation close to the beamline could originate from secondaries produced by high Z components in the beamline, as interaction cross-sections for these might not be known accurately enough in FLUKA for these materials [17]. Another contribution could originate from beam optics that were not considered in the FLUKA simulation. Further investigations have been made regarding deviations in shape.
4.2 Beam Shape
A systematic deviation in the order of
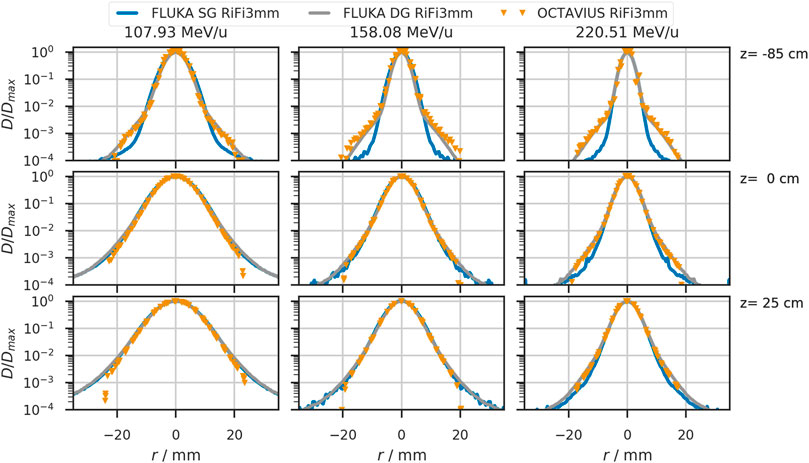
FIGURE 5. Lateral beam profiles in air for helium beams with initial beam energies of 107.93 MeV/u, 158.08 MeV/u, and 220.51 MeV/u. The solid blue line shows the simulated profiles with a single Gaussian (SG) in vacuum. Orange triangles depict profiles obtained from the OCTAVIUS chamber array at indicated depth z. The grey line shows the profiles obtained from simulation with a double Gaussian (DG) beam profile in vacuum. Positions at which the detector was placed relative to the treatment room’s isocenter are indicated on the right of each row.
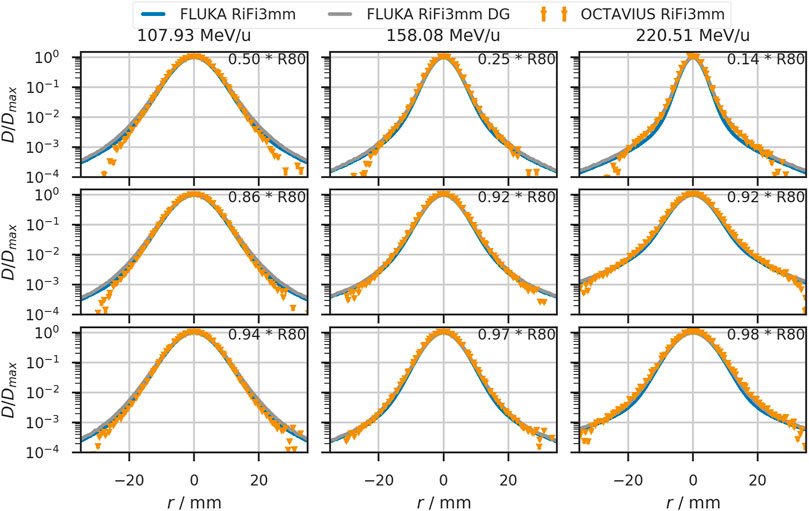
FIGURE 6. Lateral beam profiles in water for helium beams with initial beam energies of 107.93 MeV/u, 158.08 MeV/u, and 220.51 MeV/u. The solid blue line shows the simulated profiles with a single Gaussian (SG) in vacuum. Orange triangles depict profiles obtained from the OCTAVIUS chamber array at indicated depth z. The grey line shows the profiles obtained from simulation with a double Gaussian (DG) beam profile in vacuum. Detector positions are given relative to the distal 80% range of the depicted beam.
4.3 Comparison to Other Ions
To compare the width evolution of the three available ions, the beamwidth is plotted against the detector positions for three beam energies of comparables ranges (approx. 8.8 cm in water) in Figure 7. The beam is simulated as a single Gaussian profile in vacuum, with the FWHM being 5.55 mm (6.17 mm, 4.95 mm) for helium (protons and carbon ions), corresponding to the smallest clinical beamwidth.

FIGURE 7. Depth dependency of the beam width (FWHM) in air for three therapeutically available ions. The initial beamwidth in vacuum was chosen to reproduce the nominal accelerator settings at z = 0 cm when the RiFi is not inserted.
While the carbon beam shows minor widening in the air gap (39% increase from −85 cm to +25 cm), the proton width increases by 228%. The helium beamwidth increases by 204% in the same air distance. Between vacuum and isocenter, the beamwidth increases by 29% for carbon ions, 90% for helium ions, and 144% for protons.
4.4 Patient Case
With the variation of the beamwidth by ∓10% FWHM, the differences in field profiles and DVH are minor, as depicted in Figure 4. This observation is in line with the clinical intervention limits of +25% and −15% deviation from tabulated widths. Thus, we have shown for this specific case that variations up to approximately 10% in the beamwidths do not critically impact dose conformity and lateral organs at risk.
To further exploit the fact that the beamwidth is much smaller with reduced air gap and the lateral profiles’ implementation into the TPS, we performed a second patient plan investigation positioning the patient much closer to the beam exit and reducing the air gap. At MedAustron in Wiener Neustadt, Austria, a similar approach of non-isocentric treatment planning has already been commissioned for protons [36, 37].
This approach enables a dose reduction – in the organs at risk lateral to the treatment field – by decreasing the beamwidth at the patient entrance point. Figure 8 shows the differences in dose distribution for the same slice as Figure 4. In the right (contralateral) optic nerve, a reduction of
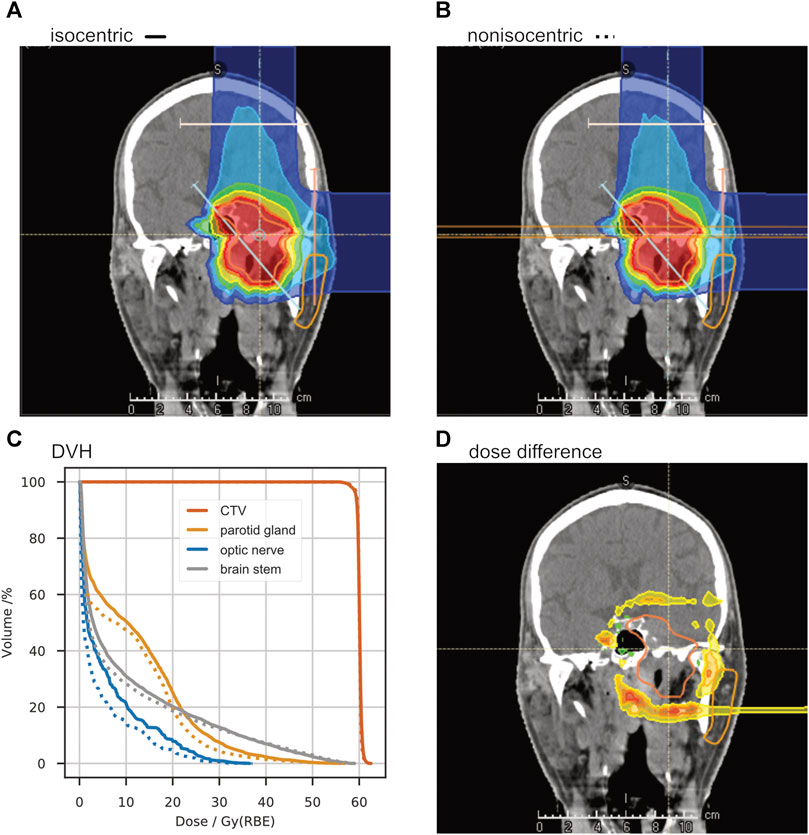
FIGURE 8. A study of non-isocentric treatment planning. Panel (A) shows the dose distribution of a “standard” treatment plan with the room’s isocenter in the target volume. With the same beam angles, another treatment plan was optimized with the patient placed as close as possible to the treatment nozzle, reducing the air gap to about 20 cm (B). The dose-volume-histogram in panel (C) shows a significant dose reduction in the organs at risk (ipsilateral parotid gland, contralateral optic nerve, and brainstem). The absolute dose difference is shown in panel (D).
5 Conclusion and Outlook
In summary, our accurate simulation and measurement of beam profiles in air along the beam path led to a more precise TPS beam model which has been applied for the first patient irradiation with helium ions at HIT.
While other groups have investigated the effect of airgaps in a phantom [16], we can now provide a precise representation of the beam characteristics between beamline exit and entering any patient or phantom. The commercial TPS and any experimental investigations rely on energy and setting-specific MC beam model to calculate dose and particle distributions in phantoms placed downstream of the beamline exit.
In principle, the gained knowledge affords greater freedom in patient positioning along the beam axis. Since the helium beam broadens in air, not as much as protons but significantly more than the carbon beam, a reduced air gap would be favorable if critical organs are in lateral proximity to the beam axis. However, routine non-isocentric treatment planning would require a patient positioning and alignment system that is as precise close to the beam exit as it is in the treatment room’s isocenter.
As expected, the broadening of the helium ion beam is intermediate between that of protons and carbon ions. With a complete representation of all available beam energies in the FLUKA simulation framework, we were able to quantify the broadening and directly compare available beamwidths for specific ranges and positions along the beam axis.
Regarding the good results while looking at the scenario of beamwidth variation in Section 3.2, the clinical approach to ensure a good field homogeneity with a spot spacing smaller than 1/3 width of the unmodified beam seems sufficient for helium ions and agrees with previous studies for protons and carbon ions [20].
For even better accuracy of the TPS, non-Gaussian beam shapes in vacuum could be investigated further. Then, the asymmetric shapes created by the particle extraction from the accelerator could be accounted for. With the observed agreements between measurement and simulation in the setup at HIT, airgaps smaller than about 50 cm would most likely benefit from such a further investigation.
The beamwidth of the helium ion beam would reduce further if the ripple filter had been removed from the beamline. This would, however, require the measurement and simulation of an entire additional database with depth dose curves, lateral profiles, absolute dosimetry, and secondary particle spectra. The treatment time for each patient field would also increase.
Together with measured depth dose curves, the lateral dose distributions reported in this paper add another milestone in the development of the physical beam model for raster-scanned helium ions. With the MC model verified against measurements and particle spectra for biological equivalent dose calculation [24] simulated, the first clinical TPS for helium ions is finished. So, after the first clinical trials with helium ion beams at the LBNL observed positive outcomes, especially for patients with small tumors, such as uveal melanoma [2], we now have the means to restart helium ion therapy with raster scanning beam technology.
Data Availability Statement
The raw data supporting the conclusions of this article will be made available by the authors, without undue reservation.
Author Contributions
TT gave substantial scientific advice and created the patient treatment plans. AM contributed to the conception and design of the study and pre-optimized the initial beamwidths for helium. SM pre-optimized the initial beamwidths for carbon. BK pre-optimized the lateral profiles for the proton beam. JB performed the analysis and most measurements, simulated the last version of the helium base data, recalculated the proton and carbon profiles, and wrote the manuscript. All authors contributed to manuscript revision, read, and approved the submitted version.
Funding
JB’s position is funded via grant NCT3.0-2015.22 BioDose.
Conflict of Interest
The authors declare that the research was conducted in the absence of any commercial or financial relationships that could be construed as a potential conflict of interest.
Publisher’s Note
All claims expressed in this article are solely those of the authors and do not necessarily represent those of their affiliated organizations, or those of the publisher, the editors and the reviewers. Any product that may be evaluated in this article, or claim that may be made by its manufacturer, is not guaranteed or endorsed by the publisher.
Acknowledgments
Thanks to Stephan Brons from the HIT medical physics team for performing additional measurements with all available beam foci of the helium beam; Amir Abdollahi for providing the research position in his group and Jürgen Debus for being the principal scientific advisor to the Ph.D. project of JB.
References
1. Lyman JT, Howard J. Dosimetry and Instrumentation for Helium and Heavy Ions. Int J Radiat Oncol Biol Phys (1977) 3:81–5. doi:10.1016/0360-3016(77)90231-0
2. Castro JR, Char DH, Petti PL, Daftari IK, Quivey JM, Singh RP, et al. 15 Years Experience with Helium Ion Radiotherapy for Uveal Melanoma. Int J Radiat Oncol Biol Phys (1997) 39(5):989–96. doi:10.1016/s0360-3016(97)00494-x
3. Castro JR. Results of Heavy Ion Radiotherapy. Radiat Environ Biophys (1995) 34:45–8. doi:10.1007/BF01210545
4. Jermann M. Particle Therapy Statistics in 2014. Int J Part Ther (2015) 2(1):50–4. doi:10.14338/ijpt-15-00013
5. Saunders W, Castro JR, Chen GTY, Collier JM, Zink SR, Pitluck S, et al. Helium-Ion Radiation Therapy at the Lawrence Berkeley Laboratory: Recent Results of a Northern California Oncology Group Clinical Trial. Radiat Res (1985) 104:S227–34. doi:10.2307/3576652
6. Saunders WM, Char DH, Quivey JM, Castro JR, Chen GT, Collier JM, et al. Precision, High Dose Radiotherapy: Helium Ion Treatment of Uveal Melanoma. Int J Radiat Oncol Biol Phys (1985) 11(2):227–33. doi:10.1016/0360-3016(85)90143-9
7. Haberer T, Becher W, Schardt D, Kraft G. Magnetic Scanning System for Heavy Ion Therapy. Nucl Instr Methods Phys Res Section A: Acc Spectrometers, Detectors Associated Equipment (1993) 330(1-2):296–305. doi:10.1016/0168-9002(93)91335-k
8.Germany’s Heidelberg University Hospital will become the world’s first cancer center to use RayStation for helium ion therapy planning (2021). URL: https://www.raysearchlabs.com/media/press-releases/2020/germanys-heidelberg-university-hospital-will-become-the-worlds-first-cancer-center-to-use-raystation-for-helium-ion-therapy-planning/. (Accessed December 2, 2021).
9. Tessonnier T, Böhlen TT, Ceruti F, Ferrari A, Sala P, Brons S, et al. Dosimetric Verification in Water of a Monte Carlo Treatment Planning Tool for Proton, Helium, Carbon and Oxygen Ion Beams at the Heidelberg Ion Beam Therapy center. Phys Med Biol (2017) 62:6579–94. doi:10.1088/1361-6560/aa7be4
10. Tessonnier T, Mairani A, Brons S, Sala P, Cerutti F, Ferrari A, et al. Helium Ions at the Heidelberg Ion Beam Therapy center: Comparisons between FLUKA Monte Carlo Code Predictions and Dosimetric Measurements. Phys Med Biol (2017) 62:6784–803. doi:10.1088/1361-6560/aa7b12
11. Tessonnier T, Mairani A, Brons S, Haberer T, Debus J, Parodi K. Experimental Dosimetric Comparison of 1H, 4H, 12C and 16O Scanned Ion Beams. Phys Med Biol (2017) 62:3958–82. doi:10.1088/1361-6560/aa6516
12. Parodi K, Mairani A, Brons S, Hasch BG, Sommerer F, Naumann J, et al. Monte Carlo Simulations to Support Start-Up and Treatment Planning of Scanned Proton and Carbon Ion Therapy at a Synchrotron-Based Facility. Phys Med Biol (2012) 57:3759–84. doi:10.1088/0031-9155/57/12/3759
13. Böhlen TT, Cerutti F, Chin MPW, Fassò A, Ferrari A, Ortega PG, et al. The FLUKA Code: Developments and Challenges for High Energy and Medical Applications. Nucl Data Sheets (2014) 120:211–4. doi:10.1016/j.nds.2014.07.049
14. Ferrari A, Sala PR, Fassó A, Ranft J. FLUKA: a Multi-Particle Transport Code (2005). Available From: http://www.slac.stanford.edu/pubs/slacreports/reports16/slac-r-773.pdf. doi:10.2172/877507
15. Horst F, Aricò G, Brinkmann K-T, Brons S, Ferrari A, Haberer T, et al. Measurement of He4 Charge- and Mass-Changing Cross Sections on H, C, O, and Si Targets in the Energy Range 70-220 MeV/u for Radiation Transport Calculations in Ion-Beam Therapy. Phys Rev C (2019) 99:1. doi:10.1103/physrevc.99.014603
16. Gallas RR, Arico G, Burigo LN, Gehrke T, Jakůbek J, Granja C, et al. A Novel Method for Assessment of Fragmentation and Beam-Material Interactions in Helium Ion Radiotherapy with a Miniaturized Setup. Physica Med (2017) 42:116–26. doi:10.1016/j.ejmp.2017.09.126
17. Norbury JW, Battistoni G, Besuglow J, Bocchini L, Boscolo D, Botvina A, et al. Are Further Cross Section Measurements Necessary for Space Radiation Protection or Ion Therapy Applications? Helium Projectiles. Front Phys (2020) 8:409. doi:10.3389/fphy.2020.565954
18. Weber U, Kraft G. Comparison of Carbon Ions versus Protons. Cancer J (2009) 15(4):325–32. doi:10.1097/ppo.0b013e3181b01935
19. Uhl M, Herfarth K, Debus J. Comparing the Use of Protons and Carbon Ions for Treatment. Cancer J (2014) 20(6):433–9. doi:10.1097/ppo.0000000000000078
20. Parodi K, Mairani A, Brons S, Naumann J, Krämer M, Sommerer F, et al. The Influence of Lateral Beam Profile Modifications in Scanned Proton and Carbon Ion Therapy: a Monte Carlo Study. Phys Med Biol (2010) 55:5169–87. doi:10.1088/0031-9155/55/17/018
21. Parodi K, Mairani A, Sommerer F. Monte Carlo-Based Parametrization of the Lateral Dose Spread for Clinical Treatment Planning of Scanned Proton and Carbon Ion Beams. J Radiat Res (2013) 54(suppl_1):i91–i96. doi:10.1093/jrr/rrt051
22. Schwaab J, Brons S, Fieres J, Parodi K. Experimental Characterization of Lateral Profiles of Scanned Proton and Carbon Ion Pencil Beams for Improved Beam Models in Ion Therapy Treatment Planning. Phys Med Biol (2011) 56:7813–27. doi:10.1088/0031-9155/56/24/009
23. Krämer M, Jäkel O, Haberer T, Kraft G, Schardt D, Weber U. Treatment Planning for Heavy-Ion Radiotherapy: Physical Beam Model and Dose Optimization. Phys Med Biol (2000) 45:3299–317. doi:10.1088/0031-9155/45/11/313
24. Kopp B, Mein S, Tessonnier T, Besuglow J, Harrabi S, Heim E, et al. Rapid Effective Dose Calculation for Raster-Scanning 4He Ion Therapy with the Modified Microdosimetric Kinetic Model (mMKM). Physica Med (2021) 81:273–84. doi:10.1016/j.ejmp.2020.11.028
25. Schardt D, Elsässer T, Schulz-Ertner D. Heavy-ion Tumor Therapy: Physical and Radiobiological Benefits. Rev Mod Phys (2010) 82(1):383–425. doi:10.1103/revmodphys.82.383
26. Highland VL. Some Practical Remarks on Multiple Scattering. Nucl Instr Methods (1975) 129(2):497–9. doi:10.1016/0029-554x(75)90743-0
27. Highland VL. Erratum: Some Practical Remarks on Multiple Scattering. Nucl Instr Methods (1979) 161(1):171. doi:10.1016/0029-554x(79)90379-3
28. Scott WT. The Theory of Small-Angle Multiple Scattering of Fast Charged Particles. Rev Mod Phys (1963) 35(2):231–313. doi:10.1103/RevModPhys.35.231
29. Molière G. Theorie der Streuung schneller geladener Teilchen. III Die Vielfachstreuung von Bahnspuren unter Berücksichtigung der statistischen Kopplung. Z für Naturforschung A (1955) 10(3):177–211. doi:10.1515/zna-1955-0301
30. Hollmark M, Gudowska I, Belkić D, Brahme A, Sobolevsky N. An Analytical Model for Light Ion Pencil Beam Dose Distributions: Multiple Scattering of Primary and Secondary Ions. Phys Med Biol (2008) 53:3477–91. doi:10.1088/0031-9155/53/13/005
31. Würl M, Englbrecht F, Parodi K, Hillbrand M. Dosimetric Impact of the Low-Dose Envelope of Scanned Proton Beams at a ProBeam Facility: Comparison of Measurements with TPS and MC Calculations. Phys Med Biol (2016) 61:958–973. doi:10.1088/0031-9155/61/2/958
32. Ondreka D, Weinrich U. The Heidelberg Ion Therapy (HIT) Accelerator Coming into Operation. Conf Proc C (2008):0806233. Available from: https://accelconf.web.cern.ch/e08/papers/tuocg01.pdf (Accessed December 2, 2021).
33. Schoemers C, Feldmeier E, Naumann J, Panse R, Peters A, Haberer T. The Intensity Feedback System at Heidelberg Ion-Beam Therapy Centre. Nucl Instr Methods Phys Res Section A: Acc Spectrometers, Detectors Associated Equipment (2015) 795:92–9. doi:10.1016/j.nima.2015.05.054
34. Weber U, Kraft G. Design and Construction of a Ripple Filter for a Smoothed Depth Dose Distribution in Conformal Particle Therapy. Phys Med Biol (1999) 44 (11):2765–75. doi:10.1088/0031-9155/44/11/306
35. Krämer M, Scholz M. Treatment Planning for Heavy-Ion Radiotherapy: Calculation and Optimization of Biologically Effective Dose. Phys Med Biol (2000) 45 (11):3319–30. doi:10.1088/0031-9155/45/11/314
36. Elia A, Resch AF, Carlino A, Böhlen TT, Fuchs H, Palmans H, et al. A GATE/Geant4 Beam Model for the MedAustron Non-isocentric Proton Treatment Plans Quality Assurance. Physica Med (2020) 71:115–23. doi:10.1016/j.ejmp.2020.02.006
37. Carlino A, Böhlen T, Vatnitsky S, Grevillot L, Osorio J, Dreindl R, et al. Commissioning of Pencil Beam and Monte Carlo Dose Engines for Non-isocentric Treatments in Scanned Proton Beam Therapy. Phys Med Biol (2019) 64:17NT01. doi:10.1088/1361-6560/ab3557
Nomenclature
BAMS active beam monitoring system consisting of three transmission ionization chambers and two multi-wire proportional chambers in the beamline downstream of the vacuum pipe
CTV clinical target volume
contralateral on the opposite side of a person’s body
DVH dose volume histogram
FLUKA an MC code to simulate particle propagation through material
FWHM full width half maximum
iDDD laterally integrated depth dose distribution, typically integrated over radii matching the sensitive region of the used detector, or infinity.
ipsilateral on the same side of a person’s body
irradiation or treatment plan a set of beam angles and energy-specific particle intensity maps necessary to achieve the desired dose distribution in a patient or phantom
LIBC accelerator library containing nominal beam energies, beamwidths and intensity settings
MC Monte Carlo
mMKM modified microdosimetric-kinetic model
noRiFi no ripple filter in the beamline
OAR organ at risk
patient entrance point the point of the patient that is closest to the beamline at a given patient position
penumbra lateral fall-off in the dose distribution accumulated by all irradiated spots of an irradiated field, typically defined as the distance between 80 and 20% isodose line perpendicular to the beam direction.
PMMA Polymethylmethacrylate
PTB Physikalisch Technische Bundesanstalt
range (R80) distal point along the depth dose curve at which 80% of the maximal dose is reached
RaShi range shifter
RiFi3mm ripple filter
spot one point in the plane perpendicular to the beam axis aimed at by a single pencil beam of the raster scanning system
slice a slice in a CT scan refers to a two-dimensional plane extracted from a three-dimensional image volume
TPS treatment planning system
width FHWM of the lateral beam profile at any given point along the beam
Keywords: particle therapy, Monte Carlo simulation, Helium, treatment planning system, ion beam, lateral profiles, dosimetry
Citation: Besuglow J, Tessonnier T, Kopp B, Mein S and Mairani A (2022) The Evolution of Lateral Dose Distributions of Helium Ion Beams in Air: From Measurement and Modeling to Their Impact on Treatment Planning. Front. Phys. 9:797354. doi: 10.3389/fphy.2021.797354
Received: 18 October 2021; Accepted: 24 November 2021;
Published: 07 January 2022.
Edited by:
Miguel Antonio Cortés-Giraldo, Sevilla University, SpainReviewed by:
Alejandro Bertolet, Massachusetts General Hospital and Harvard Medical School, United StatesMauro Valente, CCT CONICET Córdoba, Argentina
Copyright © 2022 Besuglow, Tessonnier, Kopp, Mein and Mairani. This is an open-access article distributed under the terms of the Creative Commons Attribution License (CC BY). The use, distribution or reproduction in other forums is permitted, provided the original author(s) and the copyright owner(s) are credited and that the original publication in this journal is cited, in accordance with accepted academic practice. No use, distribution or reproduction is permitted which does not comply with these terms.
*Correspondence: Andrea Mairani, YW5kcmVhLm1haXJhbmlAbWVkLnVuaS1oZWlkZWxiZXJnLmRl
 Judith Besuglow
 Thomas Tessonnier
 Benedikt Kopp1,2,3
 Andrea Mairani