 Qi Wang1
 Fu-Hu Liu
 Khusniddin K. Olimov
- 1State Key Laboratory of Quantum Optics and Quantum Optics Devices and Collaborative Innovation Center of Extreme Optics, Institute of Theoretical Physics, Shanxi University, Taiyuan, China
- 2Laboratory of High Energy Physics, Physical-Technical Institute of Uzbekistan Academy of Sciences, Tashkent, Uzbekistan
The squared momentum transfer spectra of light mesons, π0, π+, η, and ρ0, produced in high-energy virtual photon-proton (γ*p) → meson + nucleon process in electron-proton (ep) collisions measured by the CLAS Collaboration are analyzed by the Monte Carlo calculations, where the transfer undergoes from the incident γ* to emitted meson or equivalently from the target proton to emitted nucleon. In the calculations, the Erlang distribution from a multi-source thermal model is used to describe the transverse momentum spectra of emitted particles. Our results show that the average transverse momentum (⟨pT⟩) and the initial-state temperature (Ti) increase from lower squared photon virtuality (Q2) and Bjorken variable (xB) to higher one. This renders that the excitation degree of emission source, which is described by ⟨pT⟩ and Ti, increases with increasing of Q2 and xB.
1 Introduction
In the evolution process of high-energy nucleus-nucleus (heavy-ion) collisions, the reaction system undergoes several main stages which are separately the incoming of nuclei, beginning of collisions, strongly-coupled quark-gluon plasma (sQGP) phase or hot-dense matter phase, mixed phase, and hadron gas. In the stage of the incoming of nuclei, two nuclei move toward each other in vacuum tunnel at nearly the speed of light and change the shape to pancake with the Lorentz contraction. The sQGP phase is extremely hot-dense matter and the system can be regarded as a fireball. Considering the effect of pressure gradient, the system begins to inflate and cool down. Then, the hadron matter appears until the system is hadronic. To understand the mechanism of nuclear reaction and the property of system evolution, it is necessary to investigate the characteristics of each stage of collision process. The excitation and equilibrium degrees of the system are among very important characteristics [1–10].
To describe the excitation degree of the system, various temperatures of the system and the average transverse momentum (⟨pT⟩) of particles are used [11–18]. The various temperatures include, but are not limited to, 1) the initial-state temperature (Ti) which reflects the temperature in the beginning of collisions of two nuclei, 2) the chemical freeze-out temperature (Tch) which reflects the temperature at chemical freeze-out when inelastic collisions disappear, 3) the kinetic freeze-out or final-state temperature (Tkin or T0) which reflects the temperature at kinetic freeze-out when elastic collisions disappear, and 4) the effective temperature (Teff) which is not a “real” temperature, in which the influence of flow effect is not excluded compared with Tkin or T0. Different kinds of temperatures can be “measured” by different “thermometers” (methods).
As the earliest temperature in collisions, Ti is used to explore the secret of high-energy collisions [11–15]. As we know, Ti is the temperature of emission source or interacting system when the system undergoes the initial-stage of collisions [19]. It is interesting for us to describe the excitation degree of the system by using Ti. Generally, from the transverse momentum (pT) spectra or fitting the pT spectra with different distributions or functions, we may obtain Ti. The Erlang distribution [20–22], Tsallis distribution [23, 24], Hagedorn function [25] are usually used, but in this paper, we only choose the Erlang distribution due to its origin of multiple sources in the multi-source thermal model [20–22]. In the special case, such as absent pT spectra, the squared momentum transfer spectra are alternatively used. Obviously, Ti can not be obtained from the squared momentum transfer spectra directly unless the pT spectra are transformed to them. From the fit to pT spectra, ⟨pT⟩ can be naturally abstracted.
In the transformation of pT spectra to squared momentum transfer spectra [26], the Monte Carlo method is used. First of all, concrete pT, satisfying the Erlang distribution [20–22], are produced. Then, the squared momentum transfers are calculated according to the relation between squared momentum transfers and pT by using the Monte Carlo method. At last, the distribution of squared momentum transfer spectra are obtained and used to fit the experimental data for extracting ⟨pT⟩ and Ti.
To describe the equilibrium degree of the system, one can use the Tsallis distribution [23, 24] or Hagedorn function [25] to fit pT spectra directly. In the fitting process, the entropy index q can be extracted. The closer to 1 the entropy index q is, the higher the degree of equilibrium of the source or system is. The relation between the two distributions is that the former one covers the later one in which the mass is neglected. Because the universality, similarity, or common characteristics exist in high-energy collisions [27–36], some distributions used in large collision system can be also used in small collision system. Although the equilibrium degree is also important, it is not discussed in this work due to other topics being concerned. We think that the equilibrium degree is enough to use the concept of temperature.
Meson consists of a quark and anti-quark
Compared with large systems of high-energy nucleus-nucleus collisions, small systems such as high-energy electron-proton, proton-proton, proton-nucleus collisions also produce abundant results. In particular, in electron-proton collisions, the scattered electron exchanges virtual photon (γ*) with the target proton. Then, one may study high-energy γ* induced proton collisions, that is γ*p collisions, experimentally, theoretically as well as phenomenologically.
In this paper, the squared momentum transfer spectra of light mesons, π0, π+, η, and ρ0, produced in high-energy γ*p collisions measured by the CLAS Collaboration [37–40] are fitted by the results originating from the Erlang pT distribution with the Monte Carlo method. The CLAS experimental data are measured at different squared photon virtuality Q2 and Bjorken variable xB, where Q2 and xB will be discussed later in the Subsection 2.3.
2 Formalism and Method
2.1 The Erlang Distribution
The Erlang distribution is a direct result of the multi-source thermal model [20–22]. One or two-component Erlang distribution can describe the narrow or wide pT spectra of particles, where the narrow (wide) pT spectra refers to range less than a few GeV/c (more than 10 GeV/c) [22]. The multi-source thermal model assumes that multiple sources are formed in high-energy collisions. These sources can be nucleons or partons if we study the formation of nucleon clusters (nuclear fragments) or particles.
In this work, we assume that a few (ns) partons (partons-like) contribute to pT of a given particle [22]. The contribution of the jth parton is assumed to be an exponential function with variable ptj which depends on j, and average value ⟨pt⟩ which is independent of j. We have the normalized exponential function
Here, ⟨pt⟩ represents the average contribution of participant partons to ⟨pT⟩ of the considered particles.
The contribution sum
Here N is the number of particles, and the form of (1/N)dN/dpT results in the normalization of f(pT) to 1. In fact, the normalization of the Erlang distribution is naturally 1.
We would like to emphasize here the difference between “ns”, the number of partons and “N”, the number of particles. In γ*p collisions, if three quarks in the proton contributed to pT, we have ns = 3. If another
2.2 Average Transverse Momentum and Initial-State Temperature
As we know, both the average transverse momentum ⟨pT⟩ and initial-state temperature Ti [11–15] describe the excitation degree of the system. In particular, in the Erlang distribution, ⟨pT⟩ can be easily obtained by
where f (pT) is normalized to 1. Similarly, ⟨pt⟩ reflects the excitation degree of participant partons.
According to Refs. [43–45], with a color string percolation method [46], Ti can be regarded as
where
due to f (pT) is normalized to 1 and
In the process of using color string method to obtain Ti in this work, only one string is used, i.e., F(ξ) = 1, in the formation of particle. Although there are probability to have any other strings, they do not affect noticeably Ti. If we consider other strings, according to Ref. [46], one has the minimum F(ξ) ≈ 0.6. This will cause the maximum increase of 29.1% in Ti. Considering the fraction of one string is very large, that of two strings is relative small, and that of multiple strings is very small, the increase in Ti will be much smaller than 29.1%.
2.3 The Squared Momentum Transfer
In the center-of-mass reference frame, in two-body process 2 + 1 → 4 + 3 or two-body-like process of high-energy collisions, there are three Mandelstam variables defined based on the four-momenta of these particles. They have the forms to be
where P1, P2, P3, and P4 are four-momenta of particles 1 (target proton), 2 (incident γ*), 3 (emitted nucleon), and 4 (emitted meson), respectively. Here, we assume that particle 1 is incident along the Oz direction and particle 2 is incident along the opposite direction. After collisions, particle 3 is emitted with angle θ relative to the Oz direction and particle 4 is emitted along the opposite direction.
The three Mandelstam variables have different physical meaning. For instance,
where E1 and E3,
In this paper, the squared momentum transfer spectra of light meson at different squared photon virtuality Q2 and Bjorken variable xB are fitted by calculated results with the Monte Carlo method. Here, Q2 is a reflection of hard scale of reaction [47–54]. The harder the reaction is, the higher the excitation degree is. In fact, Q2 is the absolute value of the squared mass of γ* (particle 2) that is exchanged between the scattered electron and the target proton (particle 1), and it effectively represents the transverse size of the probe [38]. In addition, −Q2 is also the squared momentum transfer to the target proton (particle 1) by the scattered electron [37].
As for the Bjorken variable xB, it represents contrarily the momentum of particle 1. The lower the xB is, the higher the momentum of particle 1 is. Generally,
2.4 The Process of Monte Carlo Calculations
In the calculations of squared momentum transfer, the analytical expression of pT distribution is difficult to be transformed to that of squared momentum transfer distribution directly by using Eq. 9. Alternatively, we may use the Monte Carlo method to transform pT to squared momentum transfer. Let R1,2 and
Generally, we may solve the equation
where δpT is a small shift relative to pT. Conveniently, there is a simpler expression due to Eqs 1, 2. In fact, solving the equation
we have
The simpler expression is
The distribution of θ satisfies with the half-sine function
which is obtained under the assumption of isotropic emission in the source’s rest frame. Solving the equation
we have
which is needed in the calculations.
We have check the consistency and correctness of the above expressions in the Monte Carlo method in terms of illustration which is not presented here. After obtaining concrete values of p3T and θ, and using E1, m1, and m3, the value of |t| can be obtained from Eq. 9. Through repeating the calculations many times, the distribution of |t| is obtained statistically. Based on the method of least squares, the parameter ⟨pt⟩ and ns are extracted naturally. Meanwhile, Ti can be obtained from Eq. 4 and
It should be noted that the above Monte Carlo calculation is only performed in the transformation from transverse momentum to |t|, in which the physics process such as the radiative corrections for reactions induced by electrons has been taken into account naturally. In fact, the effects of the mentioned process and all other processes are included in the Erlang distribution which is a result of multi-factor interactions. In other words, the Monte Carlo calculation used here is not a simulation for the system evolution from initial to final stages, but the numerical transformation in the final stage.
3 Results and Discussion
3.1 Comparison With Data
Figure 1 shows the differential cross-section, dσ/d|t|, in squared momentum transfer |t| of γ*p → π0p process produced in 5.75 GeV electron beam induced collisions in a 2.5 cm long liquid-hydrogen target (ep collisions at beam energy of 5.75 GeV) in different ranges of squared photon virtuality, 1.0 < Q2 < 1.5, 1.5 < Q2 < 2.0, 2.0 < Q2 < 2.5, 2.5 < Q2 < 3.0, 3.0 < Q2 < 3.5, 3.5 < Q2 < 4.0, and 4.0 < Q2 < 4.6 GeV2, from bottom to up sub-panels, as well as in different ranges of Bjorken variable, 0.10 < xB < 0.15, 0.15 < xB < 0.20, 0.20 < xB < 0.25, 0.25 < xB < 0.30, 0.30 < xB < 0.38, 0.38 < xB < 0.48, and 0.48
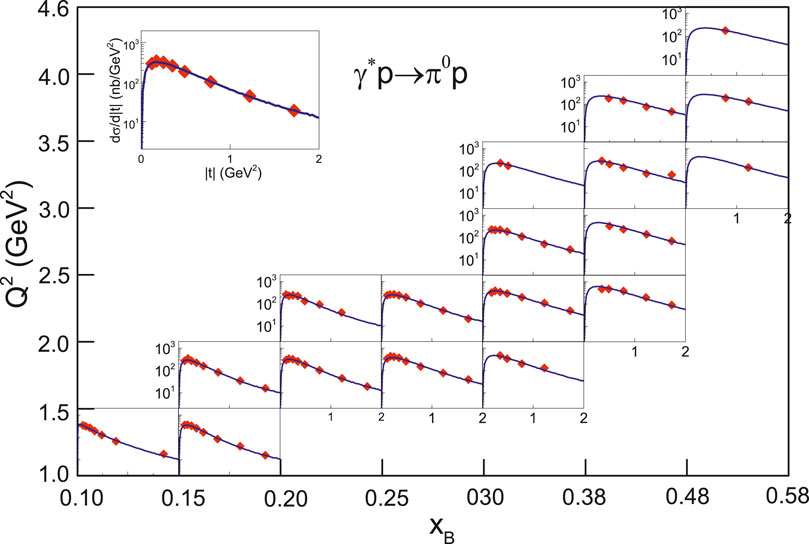
FIGURE 1. The differential cross-section dσ/d|t| in |t| of γ*p → π0p process produced in ep collisions at beam energy of 5.75 GeV in different ranges of Q2 and xB shown in the panels. The sample at the top-left sub-panel shows repeatedly the result in 1.5 < Q2 < 2.0 GeV2 and 0.20 < xB < 0.25 as an example. The symbols represent the experimental data measured by the CLAS Collaboration [37] and the curves are the statistical results of |t| (Eq. 9) in which p3T satisfies the Erlang distribution (Eq. 2) and can be obtained with the Monte Carlo method (Eq. 13).
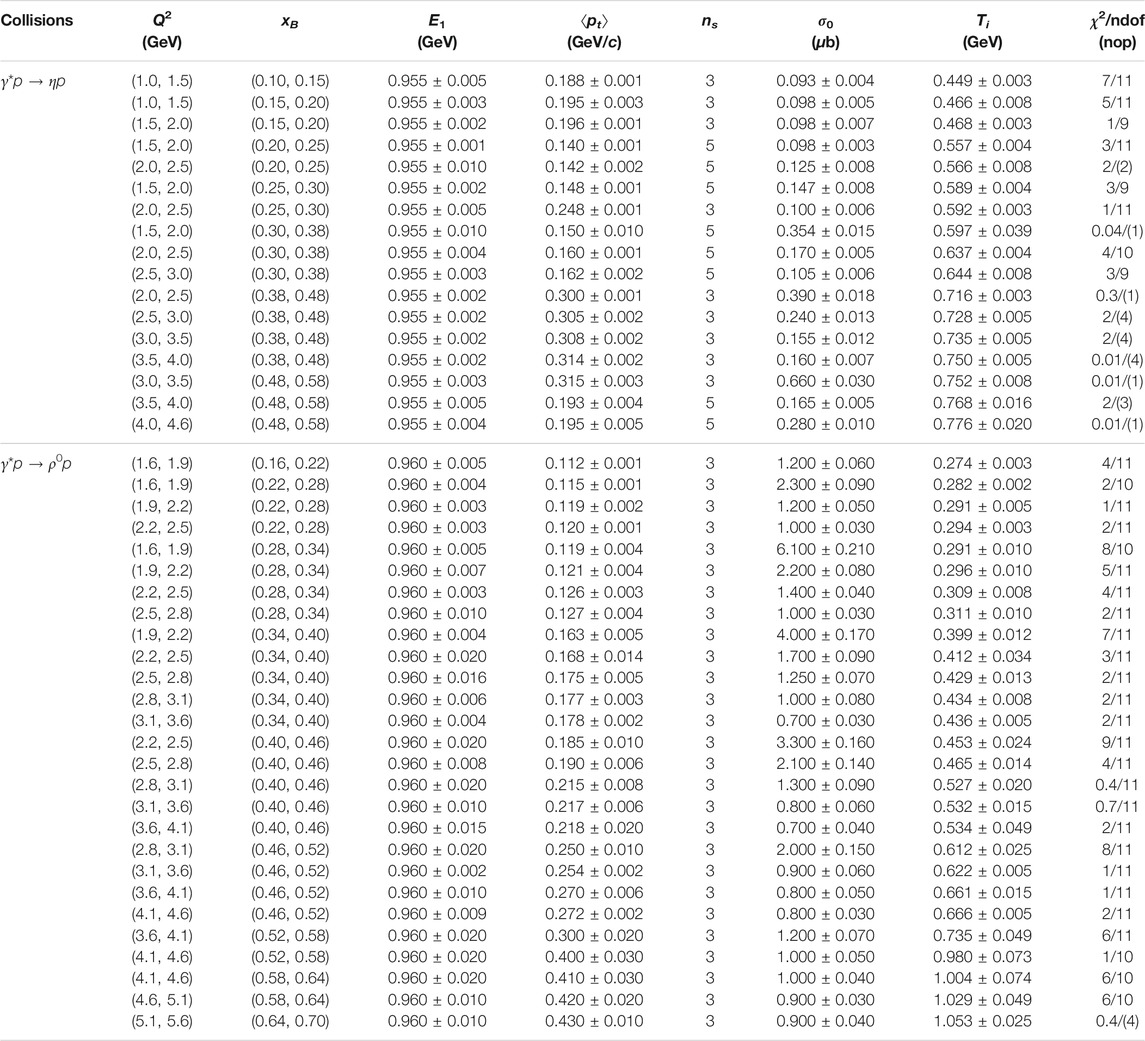
In Eq. 9, p3T satisfies the Erlang distribution (Eq. 2) and we obtain it by the Monte Carlo method (Eq. 13). Then, the squared momentum transfer |t| is obtained statistically. In the fitting process, two main parameters, i.e., the average transverse momentum ⟨pt⟩ contributed by each participant parton and the number ns of participant partons are extracted naturally. To obtain a better fit result, E1 is extracted as an insensitive parameter. In addition, a non-free parameter is the normalization constant σ0. The values of parameters with selection condition (Q2 and xB), χ2, and the number of degree of freedom (ndof) are listed in Table 1, where the number of parameters is always 4 which includes E1, ⟨pt⟩, ns, and σ0. In the case of ndof being less than or equal to the number of parameters, we obtain the curve from a “prediction” or extrapolation based on other reasonable fits in which the tendency of parameters is available. Meanwhile, in these cases, the number of points (nop) is given in a bracket to replace ndof in the table. One can see that the values of χ2 are small in most cases, though the (necessary) dense log scale is not easy to judge. The model results are in agreement with the experimental data. From the values of parameters, the average transverse momentum ⟨pT⟩ and initial temperature Ti are obtained naturally.
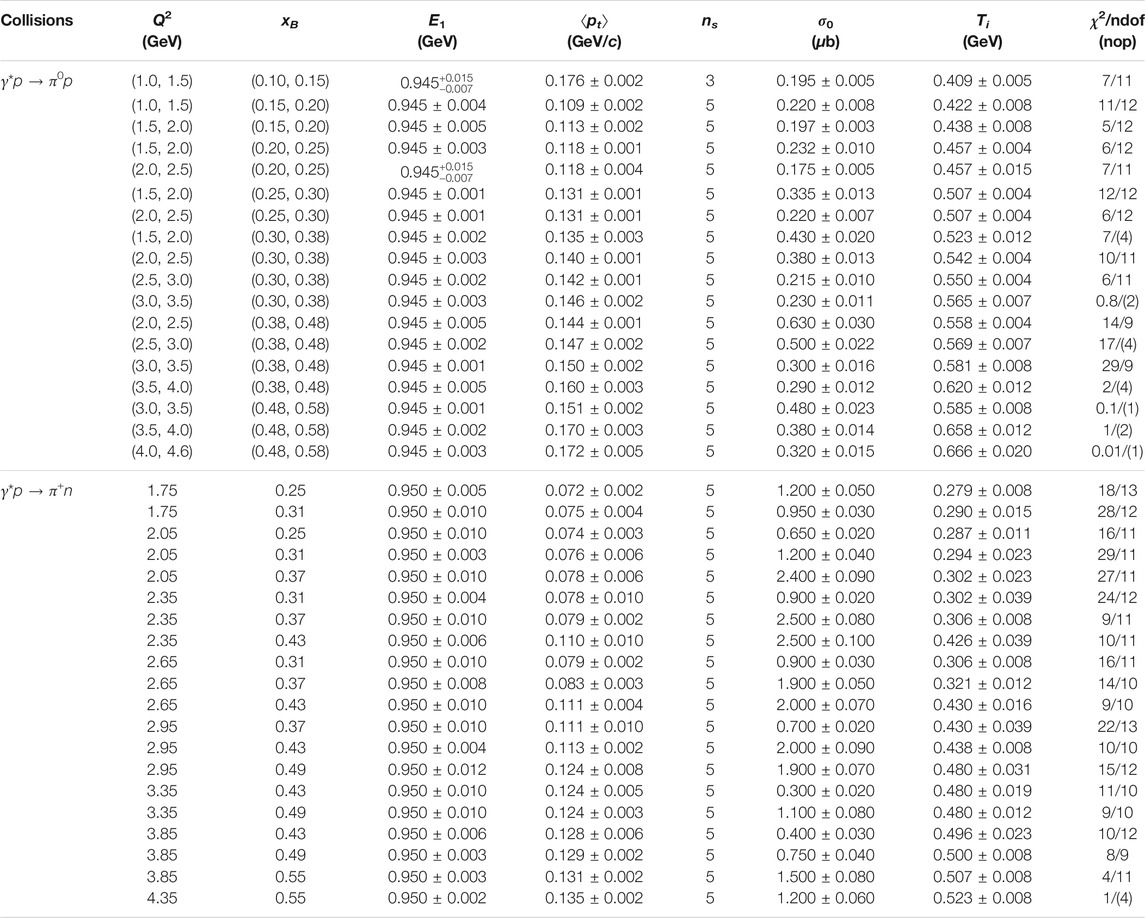
TABLE 1. Values of E1, ⟨pt⟩, ns, σ0, Ti, and χ2/ndof corresponding to the curves in Figures 1, 2, where ns is constrained to be integer with uncertainty of 0 which is not listed in the table. The number of parameters is always 4 which includes E1, ⟨pt⟩, ns, and σ0. In the case of ndof being less than or equal to the number of parameters, we obtain the curve from a “prediction” or extrapolation based on other reasonable fits, and show the corresponding nop in a bracket to replace ndof. The value of χ2 is rounded to an integer, or one significant digit if the integer is 0.
Figure 2 presents the differential cross-section, dσ/d|t|, in |t| of γ∗p → π+n process produced in ep collisions at beam energy of 6 GeV at different squared photon virtuality, Q2 = 1.75, 2.05, 2.35, 2.65, 2.95, 3.35, 3.85, and 4.35 GeV2, as well as at different Bjorken variable, xB = 0.25, 0.31, 0.37, 0.43, 0.49, and 0.55. The symbols represent the experimental data measured by the CLAS Collaboration [38]. As those in Figure 1, the curves in Figure 2 are also the statistical results of |t| in which p3T satisfies the Erlang distribution and is obtained by the Monte Carlo method. The values of parameters with selection condition (Q2 and xB), χ2, and ndof are listed in Table 1. One can see that the model results are in agreement with the experimental data.
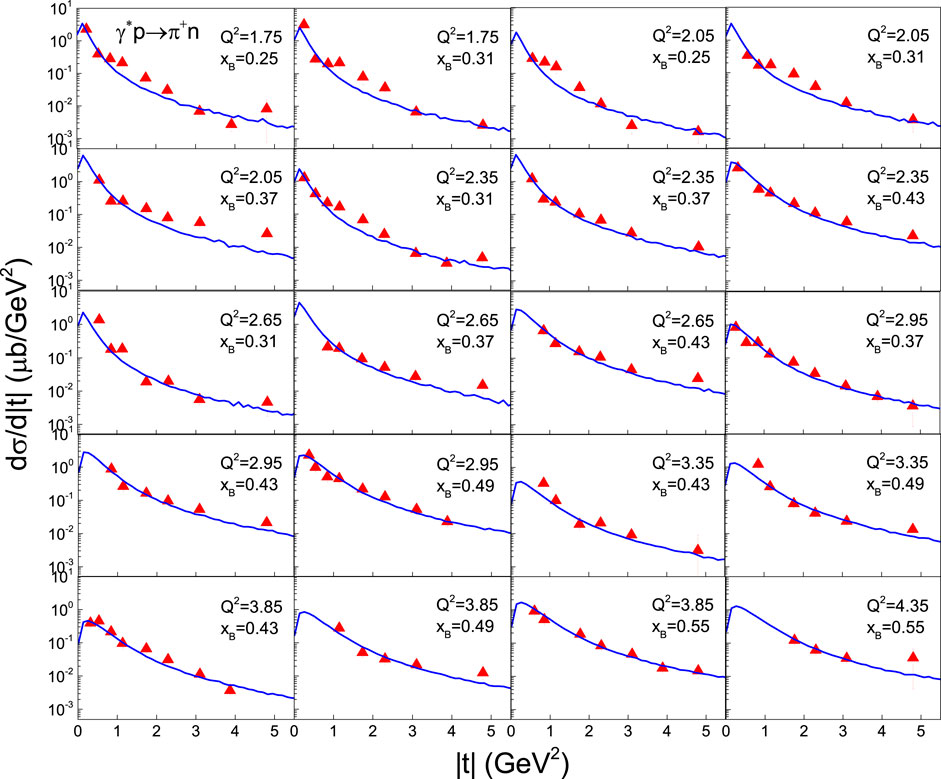
FIGURE 2. The differential cross-section dσ/d|t| in |t| of γ*p → π+n process produced in ep collisions at beam energy of 6 GeV at different Q2 and xB shown in the panels. The symbols represent the experimental data measured by the CLAS Collaboration [38] and the curves are the statistical results obtained as those in Figure 1.
Figure 3 displays the differential cross-section, dσ/d|t|, in |t| of γ∗p → ηp process produced in ep collisions at beam energy of 5.75 GeV in different Q2 and xB ranges shown in the panel. As an example, the sample at the top-left sub-panel shows repeatedly the result in 1.5 < Q2 < 2.0 GeV2 and 0.20 < xB < 0.25. The symbols represent the experimental data measured by the CLAS Collaboration [39]. The curves are the statistical results of |t| in which p3T satisfies the Erlang distribution and is obtained by the Monte Carlo method. The values of parameters with selection condition (Q2 and xB), χ2, and ndof are listed in Table 2. One can see that the model results are in agreement with the experimental data.
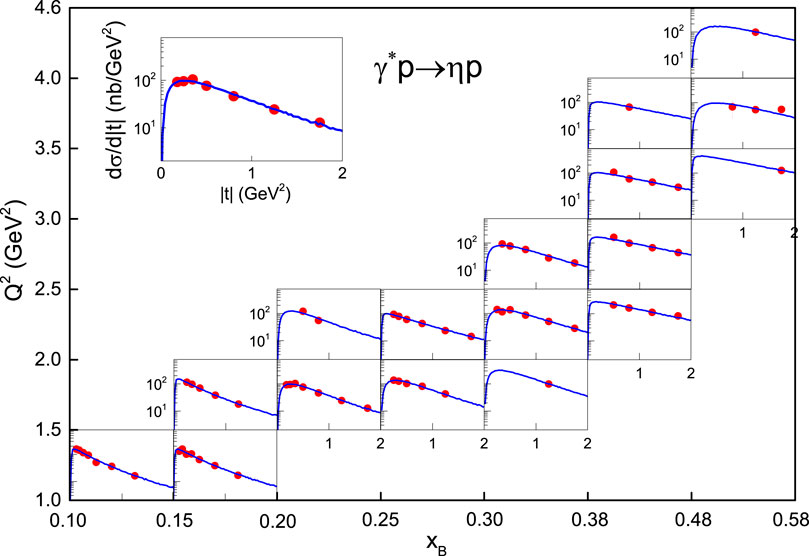
FIGURE 3. The differential cross-section dσ/d|t| in |t| of γ*p → ηp process produced in ep collisions at beam energy of 5.75 GeV in different Q2 and xB ranges shown in the panels. As an example, the sample at the top-left sub-panel shows repeatedly the result in 1.5 < Q2 < 2.0 GeV2 and 0.20 < xB < 0.25. The symbols represent the experimental data measured by the CLAS Collaboration [39] and the curves are the statistical results obtained as those in Figure 1.
Similar to Figures 1–3, Figure 4 presents the differential cross-section, dσ/d|t|, in |t| of γ∗p → ρ0p process produced in ep collisions at beam energy of 5.754 GeV in different Q2 and xB ranges shown in the panel. As an example, the sample at the top-left sub-panel shows repeatedly the result in 2.8 < Q2 < 3.1 GeV2 and 0.40 < xB < 0.46 range. The symbols represent the experimental data measured by the CLAS Collaboration [40]. The curves are the statistical results of |t| in which p3T satisfies the Erlang distribution and is obtained by the Monte Carlo method. The values of parameters with selection condition (Q2 and xB), χ2, and ndof are listed in Table 2. One can see that the model results are in agreement with the experimental data.
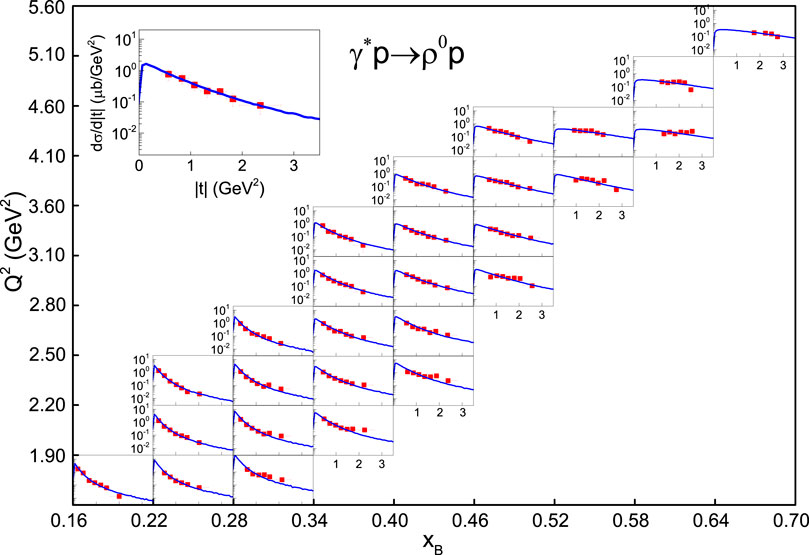
FIGURE 4. The differential cross-section dσ/d|t| in |t| of γ*p → ρ0p process produced in ep collisions at beam energy of 5.754 GeV in different Q2 and xB ranges shown in the panels. As an example, the sample at the top-left sub-panel shows repeatedly the result in 2.8 < Q2 < 3.1 GeV2 and 0.40 < xB < 0.46. The symbols represent the experimental data measured by the CLAS Collaboration [40] and the curves are the statistical results obtained as those in Figure 1.
3.2. Parameter Tendency and Discussion
In Figures 1–4, the cross-sections for π0p, π+n, ηp, and ρ0p are fitted to show some differences in concrete values and parameters, and some common features among them in the tendency of curves also appear. This is caused by the fact that different channels have different fraction ratios, and all of them are from the same ep collisions, though the collision energies are slightly different.
The dependences of ⟨pT⟩ (A, C, E, G) and Ti (B, D, F, H) on Q2 in γ*p collisions with different emitted channels [π0p (A, B), π+n (C, D), ηp (E, F), and ρ0p (G, H)] are shown in Figure 5, where ⟨pT⟩ = ns⟨pt⟩ due to Tables 1, 2 and the values of Ti are from Tables 1, 2. Different symbols represent the results for different xB. One can see that ⟨pT⟩ and Ti increase generally with an increase in Q2. Because Q2 represents the hard scale (violent degree) of collisions and a harder scale results in a higher excitation degree, it is natural that larger ⟨pT⟩ and Ti appear at higher Q2.
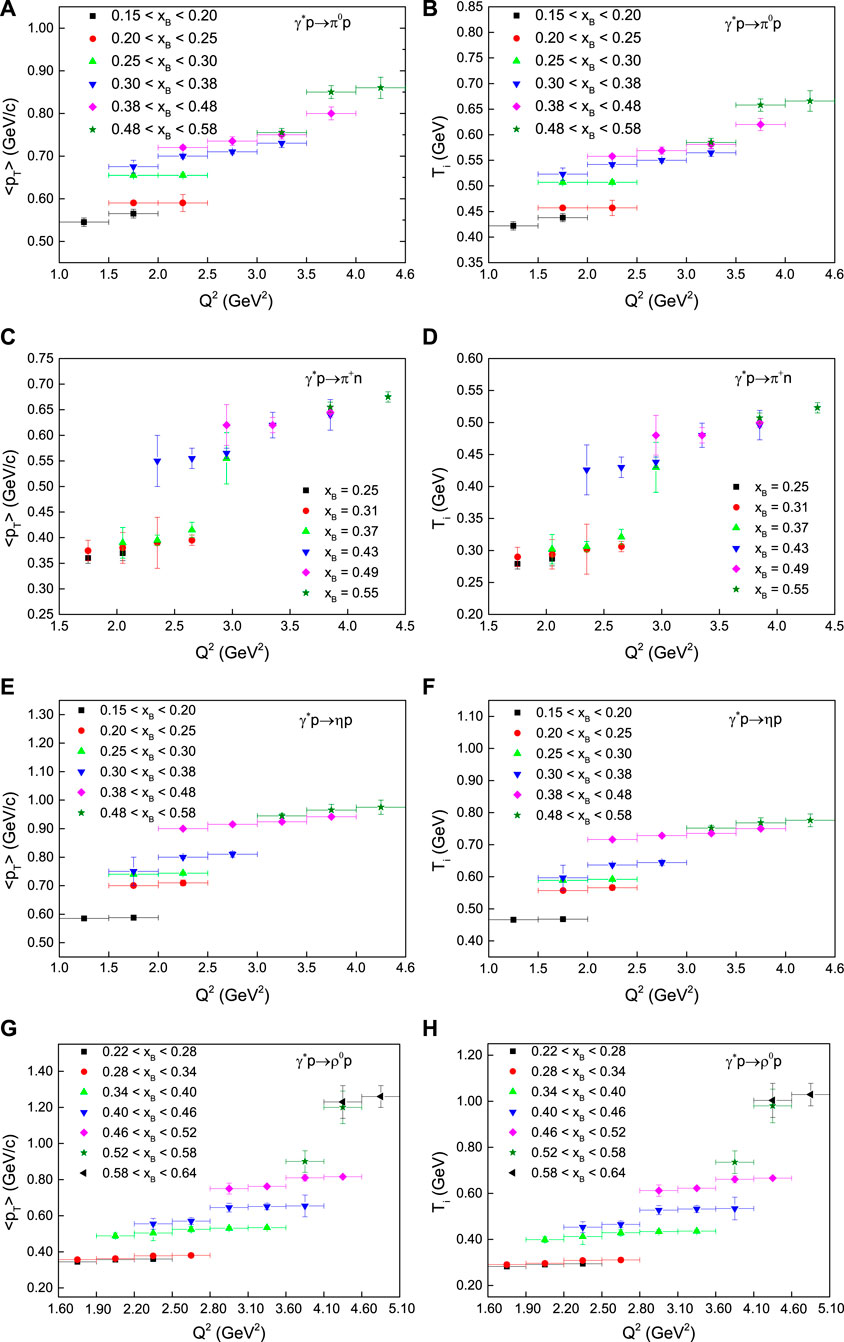
FIGURE 5. The dependences of 〈pT〉 (A,C,E,G) and Ti (B,D,F,H) on Q2 in γ*p collisions with emitted channels π0p (A,B), π+n (C,D), ηp (E,F), and ρ0p (G,H). Different symbols represent the results for different xB.
Figure 6 is similar to Figure 5, but it shows the dependences of ⟨pT⟩ (A, C, E, G) and Ti (B, D, F, H) on xB in γ*p collisions with emitted channels π0p (A, B), π+n (C, D), ηp (E, F), and ρ0p (G, H). Different symbols represent the results for different Q2. One can see that ⟨pT⟩ and Ti increase generally with an increase in xB. Because xB ∝ Q, we may think that xB also represents the hard scale of collisions and a harder scale results in a higher excitation degree. It is understandable that larger ⟨pT⟩ and Ti appear at higher xB.
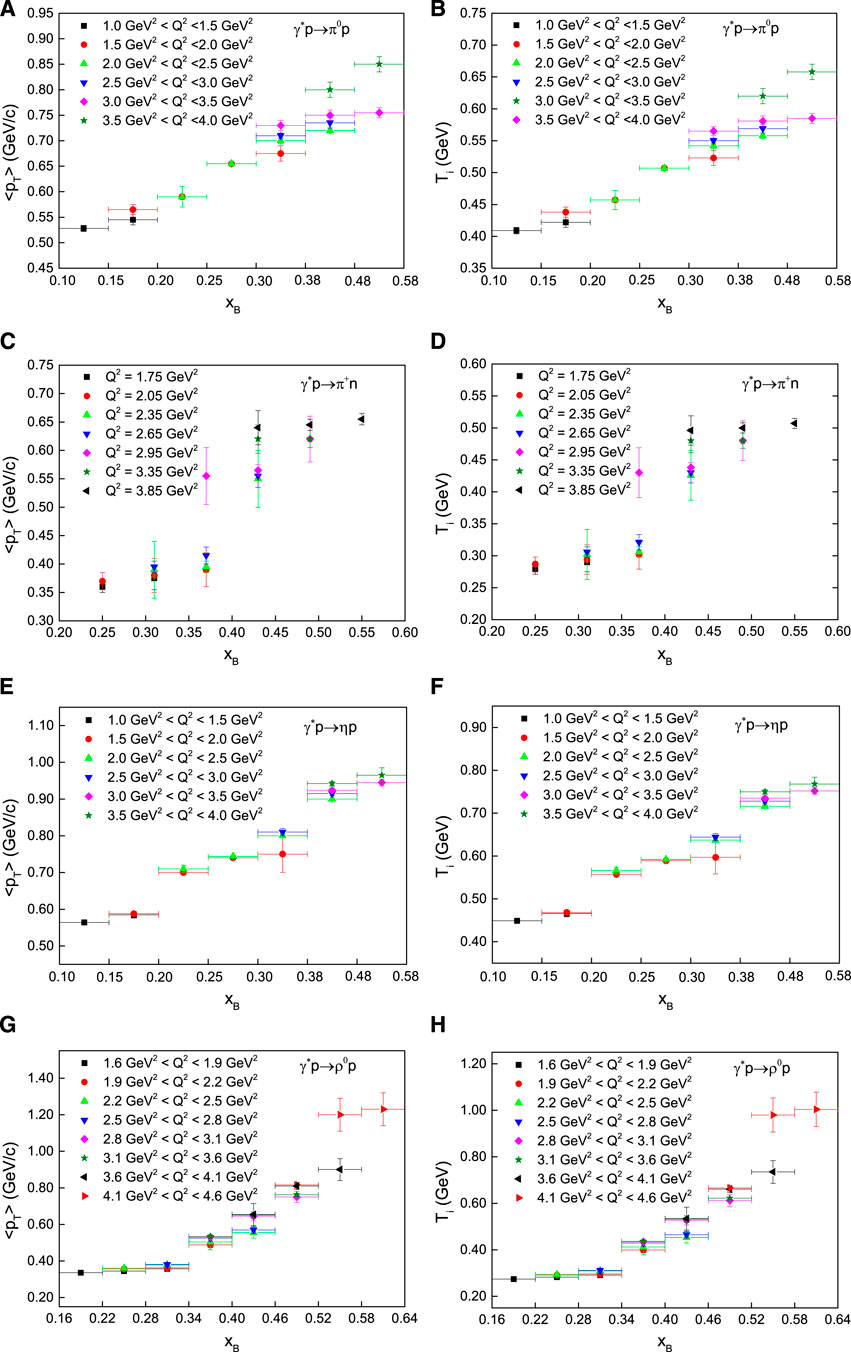
FIGURE 6. The dependences of ⟨pT⟩ (A,C,E,G) and Ti (B,D,F,H) on xB in γ*p collisions with emitted channels π0p (A,B), π+n (C,D), ηp (E,F), and ρ0p (G,H). Different symbols represent the results for different Q2.
In addition, xB also represents the longitudinal momentum fraction transferred to the struck parton. In the considered γ*p → meson + nucleon process in ep collisions at given energy, the larger xB means the larger longitudinal momentum transfer to the struck parton or the system, and hence the more energy deposited to the system. The system naturally stays at higher excitation degree. As a result, larger ⟨pT⟩ and Ti are observed.
Generally, ⟨pT⟩ > Ti ≥ Tch ≥ T0. If the evolution time of the system is 0, that is if the initial-state, chemical freeze-out, and kinetic freeze-out happen simultaneously, we have Ti = Tch = T0. If the evolution time is not negligible, we have Ti > Tch > T0. The difference between ⟨pT⟩ and temperature is explained as the contribution of flow effect. According to Ref. [55], in the final-state, the expected real T0 ≈ ⟨pT⟩/3.07. Then, we have the contribution of flow effect to be ⟨pT⟩ −T0 ≈ 2.07⟨pT⟩/3.07. One can see that the flow effect contributes largely to ⟨pT⟩. It is expected that the contribution of flow effect increases with the increase of evolution time, if ⟨pT⟩ is fixed from the initial- to final-states.
From Tables 1, 2, we note that the values of ns are 3–5 for different channels. As the number of participant partons, ns is constrained to be integer with uncertainty of 0. For a given channel, ns is independent of Q2 and xB in most cases. The channel independent ns renders that the number of participant partons is not too small or big. The number of struck parton(s) is usually regarded as 1 or 2, which is very small. The struck parton(s) and the partons around the struck parton(s) are participant partons. The partons far away from the struck parton(s) are remainder or spectator partons.
Before summary and conclusion, we would like to point out that the discussion about the temperature and flow in this paper is applicable. Although the multiplicity in ep collisions at a few GeV is very limited and the final particles are in a state far from thermal equilibrium, we may use the grand canonical ensemble for lots of events in which the number of total particles is very large and the whole system is in a homogeneous and equilibrium state. Therefore, the temperature used in this paper is comparable to the freeze-out temperatures used in nucleus-nucleus collisions. Of course, we may also regarded the temperature used here as a fitting parameter if necessary.
The initial-temperature Ti is extracted from the root-mean-square of pT, which is independent of model, though the relation between Ti and
It should be emphasized that the parameter Ti reflects the violent degree of collisions. To our knowledge, other groups and other studies where Ti is extracted for hadronic collisions is not available at present, though Ti for nucleus-nucleus collisions is available. In terms of Ti, Erlang distribution, and Monte Carlo calculation, the present work has proposed an alternative method to describe light meson electroproduction data obtained with the JLab-CLAS facility. Typically those data are interpreted in terms of handbag diagram within the formalism of generalized parton distributions, whereas here statistical methods, that were developed for high-energy nucleus-nucleus collisions, are applied. At least, the present work has significance in the application of statistical methods.
4 Summary and Conclusion
In summary, the squared momentum transfer spectra of π0, π+, η, and ρ0 produced in γ*p → meson + nucleon process have been fitted by the calculated results with the Erlang distribution which is obtained from the multi-source thermal model and used to describe the transverse momentum spectra of emitted particles. The squared momentum transfer undergoes from the incident γ* to emitted meson, and also equivalently from the target proton to emitted nucleon. The model results are in agreement with the experimental data measured by the CLAS Collaboration. The values of the related parameters are extracted in the fitting process. The squared photon virtuality Q2 and Bjorken variable xB dependent parameters are obtained.
With increasing of Q2, the quantities ⟨pT⟩ and Ti increase generally. Q2 is defined as absolute value of the squared mass of the virtual photon that is exchanged between the electron and the target proton, and it effectively represents the transverse size of the probe. Q2 also reflects the hard scale of collisions. A harder scale results in a higher excitation degree of the system, and a larger ⟨pT⟩ and Ti. At harder scale (larger Q2), the degree of equilibrium decreases because of more disturbance to the equilibrated residual partons in target particle, though the system is at the state of high degree of excitation.
Similar to the tendency of Q2, with an increase of xB, the quantities ⟨pT⟩ and Ti increase. In the considered γ*p → meson + nucleon process, xB represents the longitudinal momentum fraction transferred to the struck parton. The larger xB means the larger longitudinal momentum transfer to the system. It is natural that ⟨pT⟩ and Ti are larger at larger xB. In addition, because xB ∝ Q, one may argue that xB also represents the hard scale of collisions. Indeed, it is understandable that larger ⟨pT⟩ and Ti appear at higher xB.
Data Availability Statement
The original contributions presented in the study are included in the article, further inquiries can be directed to the corresponding authors.
Author Contributions
All authors listed have made a substantial, direct, and intellectual contribution to the work and approved it for publication.
Funding
The work of QW and F-HL was supported by the National Natural Science Foundation of China under Grant Nos 12047571, 11575103, and 11947418, the Scientific and Technological Innovation Programs of Higher Education Institutions in Shanxi (STIP) under Grant No. 201802017, the Shanxi Provincial Natural Science Foundation under Grant No. 201901D111043, and the Fund for Shanxi “1331 Project” Key Subjects Construction. The work of KKO was supported by the Ministry of Innovative Development of the Republic of Uzbekistan within the fundamental project No. F3-20200929146 on analysis of open data on heavy-ion collisions at RHIC and LHC.
Conflict of Interest
The authors declare that the research was conducted in the absence of any commercial or financial relationships that could be construed as a potential conflict of interest.
Publisher’s Note
All claims expressed in this article are solely those of the authors and do not necessarily represent those of their affiliated organizations, or those of the publisher, the editors and the reviewers. Any product that may be evaluated in this article, or claim that may be made by its manufacturer, is not guaranteed or endorsed by the publisher.
References
1. Wang H, Chen J-H, Ma Y-G, Zhang S. Charm Hadron Azimuthal Angular Correlations in Au + Au Collisions at
2. Yan T-Z, Li S, Wang Y-N, Xie F, Yan T-F. Yield Ratios and Directed Flows of Light Particles from Proton-Rich Nuclei-Induced Collisions. Nucl Sci Tech (2019) 30:15. doi:10.1007/s41365-018-0534-6
3. Fisli M, Mebarki N. Top Quark Pair-Production in Noncommutative Standard Model. Adv High Energ Phys (2020) 2020:7279627. doi:10.1155/2020/7279627
4. He X-W, Wu F-M, Wei H-R, Hong B-H. Energy-Dependent Chemical Potentials of Light Hadrons and Quarks Based on Transverse Momentum Spectra and Yield Ratios of Negative to Positive Particles. Adv High Energ Phys (2020) 2020:1265090. doi:10.1155/2020/1265090
5. Waqas M, Li B-C. Kinetic Freeze-Out Temperature and Transverse Flow Velocity in Au-Au Collisions at RHIC-BES Energies. Adv High Energ Phys (2020) 2020:1787183. doi:10.1155/2020/1787183
6. Tang Z-B, Zha W-M, Zhang Y-F. An Experimental Review of Open Heavy Flavor and Quarkonium Production at RHIC. Nucl Sci Tech (2020) 31:81. doi:10.1007/s41365-020-00785-8
7. Shen C, Yan L. Recent Development of Hydrodynamic Modeling in Heavy-Ion Collisions. Nucl Sci Tech (2020) 31:122. doi:10.1007/s41365-020-00829-z
8. Yu H, Fang D-Q, Ma Y-G. Investigation of the Symmetry Energy of Nuclear Matter Using Isospin-dependent Quantum Molecular Dynamics. Nucl Sci Tech (2020) 31:61. doi:10.1007/s41365-020-00766-x
9. Bhaduri S, Bhaduri A, Ghosh D. Study of Di-muon Production Process in pp Collision in CMS Data from Symmetry Scaling Perspective. Adv High Energ Phys (2020) 2020:4510897. doi:10.1155/2020/4510897
10. Tawfik AN. Out-of-equilibrium Transverse Momentum Spectra of Pions at LHC Energies. Adv High Energ Phys (2019) 2019:4604608. doi:10.1155/2019/4604608
11. Nayak JK, Alam J-E., Sarkar S, Sinha B. Measuring Initial Temperature through a Photon to Dilepton Ratio in Heavy-Ion Collisions. J Phys G: Nucl Part Phys (2008) 35:104161. doi:10.1088/0954-3899/35/10/104161
12. Adare A, Afanasiev S, Aidala C, Ajitanand NN, Akiba Y, Al-Bataineh H, et al. Enhanced Production of Direct Photons in Au + Au Collisions at
13. Csanád M, Májer I. Initial Temperature and EoS of Quark Matter via Direct Photons. Phys Part Nuclei Lett (2011) 8:1013–5. doi:10.1134/S1547477111090147
14. Csanád M, Májer I. Equation of State and Initial Temperature of Quark Gluon Plasma at RHIC. Cent Eur J Phys (2012) 10:850. doi:10.2478/s11534-012-0060-9
15. Soltz RA, Garishvili I, Cheng M, Abelev B, Glenn A, Newby J, et al. Constraining the Initial Temperature and Shear Viscosity in a Hybrid Hydrodynamic Model of
16. Waqas M, Liu F-H. Initial, Effective, and Kinetic Freeze-Out Temperatures from Transverse Momentum Spectra in High-Energy Proton(Deuteron)-Nucleus and Nucleus-Nucleus Collisions. Eur Phys J Plus (2020) 135:147. doi:10.1140/epjp/s13360-020-00213-1
17. Cleymans J, Paradza MW. Tsallis Statistics in High Energy Physics: Chemical and thermal Freeze-Outs. Physics (2020) 2:654–64. doi:10.3390/physics2040038
18. Li L-L, Liu F-H. Kinetic Freeze-Out Properties from Transverse Momentum Spectra of Pions in High Energy Proton-Proton Collisions. Physics (2020) 2:277–308. doi:10.3390/physics2020015
19. Wang Q, Liu F-H, Olimov KK. Initial- and Final-State Temperatures of Emission Source from Differential Cross-Section in Squared Momentum Transfer in High-Energy Collisions. Adv High Energ Phys (2021) 2021:6677885. doi:10.1155/2021/6677885
20. Liu F-H, Li J-S. Isotopic Production Cross Section of Fragments in 56Fe+p and 136Xe(124Xe)+Pb reactions over an Energy Range from 300A to 1500A MeV. Phys Rev C (2008) 78:044602. doi:10.1103/PhysRevC.78.044602
21. Liu F-H. Unified Description of Multiplicity Distributions of Final-State Particles Produced in Collisions at High Energies. Nucl Phys A (2008) 810:159–72. doi:10.1016/j.nuclphysa.2008.06.014
22. Liu F-H, Gao Y-Q, Tian T, Li B-C. Unified Description of Transverse Momentum Spectrums Contributed by Soft and Hard Processes in High-Energy Nuclear Collisions. Eur Phys J A (2014) 50:94. doi:10.1140/epja/i2014-14094-9
23. Tsallis C. Possible Generalization of Boltzmann-Gibbs Statistics. J Stat Phys (1988) 52:479–87. doi:10.1007/BF01016429
24. Abelev BI, Adams J, Aggarwal MM, Ahammed Z, Amonett J, Anderson BD, et al. Strange Particle Production in p + p Collisions at
25. Hagedorn R. Multiplicities, pT Distributions and the Expected Hadron → Quark-Gluon Phase Transition. Riv Nuovo Cim (1983) 6(10):1–50. doi:10.1007/BF02740917
27. Sarkisyan EKG, Sakharov AS. Multihadron Production Features in Different Reactions. AIP Conf Proc (2006) 828:35. doi:10.1063/1.2197392
28. Sarkisyan EKG, Sakharov AS. Relating Multihadron Production in Hadronic and Nuclear Collisions. Eur Phys J C (2010) 70:533–41. doi:10.1140/epjc/s10052-010-1493-1
29. Mishra AN, Sahoo R, Sarkisyan EKG, Sakharov AS. Effective-Energy Budget in Multiparticle Production in Nuclear Collisions. Eur Phys J C (2014) 74:3147. doi:10.1140/epjc/s10052-014-3147-1
30. Sarkisyan EKG, Mishra AN, Sahoo R, Sakharov AS. Multihadron Production Dynamics Exploring the Energy Balance in Hadronic and Nuclear Collisions. Phys Rev D (2016) 93:054046. doi:10.1103/PhysRevD.93.054046
31. Sarkisyan EKG, Mishra AN, Sahoo R, Sakharov AS. Centrality Dependence of Midrapidity Density from GeV to TeV Heavy-Ion Collisions in the Effective-Energy Universality Picture of Hadroproduction. Phys Rev D (2016) 94:011501. doi:10.1103/PhysRevD.94.011501
32. Sarkisyan-Grinbaum EK, Nath Mishra A, Sahoo R, Sakharov AS. Effective-Energy Universality Approach Describing Total Multiplicity Centrality Dependence in Heavy-Ion Collisions. EPL (2019) 127:62001. doi:10.1209/0295-5075/127/62001
33. Mishra AN, Ortiz A, Paić G. Intriguing Similarities of High-pT Particle Production between pp and A−A Collisions. Phys Rev C (2019) 99:034911. doi:10.1103/PhysRevC.99.034911
34. Castorina P, Plumari S, Satz H. Universal Strangeness Production in Hadronic and Nuclear Collisions. Int J Mod Phys E (2016) 25:1650058. doi:10.1142/S0218301316500580
35. Castorina P, Iorio A, Lanteri D, Satz H, Spousta M. Universality in High Energy Collisions of Small and Large Systems. In: Proceedings of the 40th International Conference on High Energy Physics – ICHEP2020; July 28 – August 6, 2020; Prague, Czech Republic, 390 (2021). p. 537. virtual meeting. doi:10.22323/1.390.0537
36. Castorina P, Iorio A, Lanteri D, Satz H, Spousta M. Universality in Hadronic and Nuclear Collisions at High Energy. Phys Rev C (2020) 101:054902. doi:10.1103/PhysRevC.101.054902
37. Bedlinskiy I, Kubarovsky V, Niccolai S, Stoler P, Adhikari KP, Anderson MD, et al. CLAS Collaboration. Exclusive π0 Electroproduction at W > 2 GeV with CLAS. Phys Rev C (2014) 90:025205. doi:10.1103/PhysRevC.90.025205
38. Park K, Guidal M, Gothe RW, Laget JM, Garçon M, Adhikari KP, et al. CLAS Collaboration. Deep Exclusive π+ Electroproduction off the Proton at CLAS. Eur Phys J A (2013) 49:1. doi:10.1140/epja/i2013-13016-9
39. Bedlinskiy I, Kubarovsky V, Stoler P, Adhikari KP, Akbar Z, Pereira SA, et al. Exclusive η Electroproduction at W > 2 GeV with CLAS and Transversity Generalized Parton Distributions. Phys Rev C (2017) 95:035202. doi:10.1103/PhysRevC.95.035202
40. Morrow SA, Guidal M, Garçon M, Laget JM, Smith ES, Adams G, et al. Exclusive ρ0 Electroproduction on the Proton at CLAS. Eur Phys J A (2009) 39:5. doi:10.1140/epja/i2008-10683-5
41. An CS, Saghai B. Sea-Quark Flavor Content of Octet Baryons and Intrinsic Five-Quark Fock States. Phys Rev C (2012) 85:055203. doi:10.1103/PhysRevC.85.055203
42. An CS, Saghai B. Strangeness Magnetic Form Factor of the Proton in the Extended Chiral Quark Model. Phys Rev C (2013) 88:025206. doi:10.1103/PhysRevC.88.025206
43. Gutay LJ, Hirsch AS, Scharenberg RP, Srivastava BK, Pajares C. De-Confinement in Small Systems: Clustering of Color Sources in High Multiplicity
44. Scharenberg RP, Srivastava BK, Pajares C. Exploring the Initial Stage of High Multiplicity Proton-Proton Collisions by Determining the Initial Temperature of the Quark-Gluon Plasma. Phys Rev D (2019) 100:114040. doi:10.1103/PhysRevD.100.114040
45. Sahoo P, De S, Tiwari SK, Sahoo R. Energy and Centrality Dependent Study of Deconfinement Phase Transition in a Color String Percolation Approach at RHIC Energies. Eur Phys J A (2018) 54:136. doi:10.1140/epja/i2018-12571-9
46. Wang Q, Liu F-H. Excitation Function of Initial Temperature of Heavy Flavor Quarkonium Emission Source in High Energy Collisions. Adv High Energ Phys (2020) 2020:5031494. doi:10.1155/2020/5031494
47. Aaron FD, Martin MA, Alexa C, Andreev V, Antunovic B, Asmone A, et al. Diffractive Electroproduction of ρ and ϕ Mesons at HERA. J High Energ Phys (2010) 2010(05):32. doi:10.1007/JHEP05(2010)032
48. Aktas A, Andreev V, Anthonis T, Antunovic B, Aplin S, Asmone A, et al. Elastic J/ψ Production at HERA. Eur Phys J C (2006) 46:585–603. doi:10.1140/epjc/s2006-02519-5
49. Chekanov S, Derrick M, Magill S, Musgrave B, Nicholass D, Repond J, et al. Exclusive ρ0 Production in Deep Inelastic Scattering at HERA. PMC Phys A (2007) 1:6. doi:10.1186/1754-0410-1-6
50. Derrick M, Krakauer D, Magill S, Mikunas D, Musgrave B, Okrasiński JR, et al. Measurement of Elastic ω Photoproduction at HERA ZEUS Collaboration. Z Phys C (1997) 73:73. doi:10.1007/s00288005029710.1007/s002880050314
51. Chekanov S, Derrick M, Magill S, Miglioranzi S, Musgrave B, Repond J, et al. Exclusive Electroproduction of ϕ Mesons at HERA. Nucl Phys B (2005) 718:3. doi:10.1016/j.nuclphysb.2005.04.009
52. Chekanov S, Derrick M, Loizides JH, Magill S, Miglioranzi S, Musgrave B, et al. Exclusive Electroproduction of J/ψ Mesons at HERA. Nucl Phys B (2004) 695:3–37. doi:10.1016/j.nuclphysb.2004.06.034
53. Barberis D, Binon FG, Close FE, Danielsen KM, Donskov SV, Earl BC, et al. A Coupled Channel Analysis of the Centrally Produced K+ K− and π+π− Final States in pp Interactions at 450 GeV/c. Phys Lett B (1999) 462:462–70. doi:10.1016/S0370-2693(99)00909-0
54. Barberis D, Beusch W, Binon FG, Blick AM, Close FE, Danielsen KM, et al. A Measurement of the Branching Fractions of the f1(1285) and f1(1420) Produced in central pp Interactions at 450 GeV/c. Phys Lett B (1998) 440:225–32. doi:10.1016/S0370-2693(98)01264-7
Keywords: initial-state temperature, average transverse momentum, squared momentum transfer, Erlang distribution, multi-source thermal model
Citation: Wang Q, Liu F-H and Olimov KK (2021) Initial-State Temperature of Light Meson Emission Source From Squared Momentum Transfer Spectra in High-Energy Collisions. Front. Phys. 9:792039. doi: 10.3389/fphy.2021.792039
Received: 09 October 2021; Accepted: 08 November 2021;
Published: 17 December 2021.
Edited by:
Giuseppe Mandaglio, University of Messina, ItalyReviewed by:
Egle Tomasi, CEA Saclay, FranceRishi Sharma, Tata Institute of Fundamental Research, India
Copyright © 2021 Wang, Liu and Olimov. This is an open-access article distributed under the terms of the Creative Commons Attribution License (CC BY). The use, distribution or reproduction in other forums is permitted, provided the original author(s) and the copyright owner(s) are credited and that the original publication in this journal is cited, in accordance with accepted academic practice. No use, distribution or reproduction is permitted which does not comply with these terms.
*Correspondence: Fu-Hu Liu, ZnVodWxpdUAxNjMuY29t, ZnVodWxpdUBzeHUuZWR1LmNu; Khusniddin K. Olimov, a2hrb2xpbW92QGdtYWlsLmNvbQ==, a2gub2xpbW92QHV6c2NpLm5ldA==