 Longzhang Fang
 Dongguo Shao
94% of researchers rate our articles as excellent or good
Learn more about the work of our research integrity team to safeguard the quality of each article we publish.
Find out more
ORIGINAL RESEARCH article
Front. Phys., 26 January 2022
Sec. Interdisciplinary Physics
Volume 9 - 2021 | https://doi.org/10.3389/fphy.2021.790687
This article is part of the Research TopicMicroscopic Structure Effect on the Macroscopic Property of GeomaterialsView all 63 articles
In actual engineering fields, the bearing capacity of a rock is closely related to the pore water pressure in the rock. Studies have shown that the pore water in the rock has a great relationship with the change in runoff. Thus, it has crucial meaning to accurately evaluate and quantitate the property of the rainfall–runoff, and many traditional classic models are proposed to study the characteristic of rainfall–runoff. While considering the high uncertainty and randomness of the rainfall–runoff property, more and more artificial neural networks (ANN) are used for the rainfall–runoff modeling as well as other fields. Among them, the long short-term memory (LSTM), which can be trained for sequence generation by processing real data sequences one step at a time and has good prediction results in other engineering fields, is adopted in this study to investigate the changes of rainfall–runoff values and make a prediction. In order to ensure the accuracy of the trained model, the cross-validation method is used in this study. The training data set is divided into 12 parts. The monthly forecast results from 2014 to 2015 show that the model can well reflect the peaks and troughs. In a recent study, the relationship between the rainfall–runoff and discharge are commonly based on the current measured data, while the prediction results are adopted to analyze the relation of these parameters, and considering that the existing methods have fuzzy relationship between runoff and discharge, which leads to a high risk of forecasting and dispatching. A method of modeling analysis and parameter estimation of hydrological runoff and discharge relationship based on machine learning is designed. From the experimental results, the average risk of this method is 61.23%, which is 15.104% and 13.397% less than that of the other two existing methods, respectively. It proves that the method of hydrological runoff relationship modeling and parameter estimation integrated with machine learning has better practical application effect.
Climate condition is the driving factor of the hydrological process and the primary determinant of runoff. The climate factors that have important influence on hydrological simulation include precipitation and temperature. Domestic and foreign scholars have found that precipitation, precipitation intensity, and precipitation types in many parts of the world have changed significantly by sorting out a large number of literatures on precipitation change. From a global perspective, precipitation in the high latitudes of the northern hemisphere has increased significantly, while precipitation in the middle and low latitudes has increased and decreased locally. Generally speaking, the humid areas have become more humid, the arid area is becoming more arid, and the interannual fluctuation is obviously enhanced. The change in precipitation can directly affect runoff [1]. Watershed hydrological simulation and prediction is the main content of the study of hydrological runoff and also the research basis of related interdisciplinary studies, which has important value. Under the background of increasingly significant environmental changes, the traditional stable watershed assumption in hydrological simulation is facing challenges, which makes the model parameters, representing the hydrological characteristics of the watershed in the model, no longer hold the fixed assumption and weaken the evaluation ability [2]. Studying the parameter characteristics of the hydrological model of the “Unsteady” watershed and improving the simulation effect of the model in the changing environment can provide technical support for the current and future flood control, drought resistance, water resources planning, and management [3]. For example, studies by many scholars show that since the 1970s, with the trend increase in precipitation in the United States, runoff in most parts of the United States has also shown an obvious increasing trend [4]. From the perspective of temperature, the warming rate in the recent 60 years is obviously faster. The results show that the land warming is faster than the ocean warming, and the warming range in the high latitudes is larger than that in the middle and low latitudes; the temperature increase in winter is more obvious than that in summer [5]. The change in temperature mainly affects the evapotranspiration of runoff, and the change in temperature and precipitation also affects each other [6]. Global warming will accelerate the global hydrological cycle, resulting in an increase jn precipitation and the frequency and intensity of extreme hydrological events.
The relationship between runoff and discharge is an important condition for runoff prediction, which has a very important strategic significance for the scientific formulation of the water use plan, the optimal scheduling and rational allocation of water resources, and the protection of water ecological environment. In fact, the medium- and long-term hydrological factors are affected by many factors, such as astronomy, meteorology, geography, and so on, and are the result of many factors. Therefore, we should select many factors with physical causes related to the prediction factors from the historical data as the prediction factors and establish the quantitative or qualitative relationship between the factors and the prediction factors through statistical analysis and other mathematical methods, so as to carry out the hydrological forecast. This kind of method is called multifactor prediction method [7]. For multifactor forecast, the commonly used methods are multiple regression, stepwise regression, and so on. The ultimate purpose of runoff prediction is to serve the hydrological business application. In production practice, there is a demand for both short-term forecast and medium- and long-term forecast, and the future demand may be more extensive [8]. In addition, there are many uncertainties in runoff forecast, so people need to synthesize various information to judge the value of the forecast information. Machine learning theory is based on statistics, information theory, biology, cybernetics, and computer science, involving more theoretical knowledge [9]. In the follow-up development process, it is gradually applied to hydrological runoff prediction and other research fields. Accuracy prediction of rainfall–runoff has high importance in redistributing water resources and the strategic planning, as well as fitting the issue of being carbon neutral, while there is a high complexity between the inherent randomness of behavior and the variables of the hydrometeorological [10, 11]. Meanwhile, there exists many factors, which may be due to the difference results of rainfall–runoff. Nowadays, there are many available methods for the prediction of streamflow forecasting. It can be divided into data-driven models and physical models [12]. The physical models are often used to study the movements and deposits of water [13, 14], while the resolution of prediction results is often influenced by the physical parameters, the initial condition of catchments, and the temporal resolution. Thus, the traditional model has a limitation in solving such complicated problem of predicting the accurate value of rainfall–runoff [15]. In fact, artificial neural networks (ANNs) have been widely used in many engineering fields, which achieve good results [16–20]. Among them, the long short-term memory (LSTM), which has the advantage of having high resolution and accountability, is adopted in this study. Based on the prediction results, the parameter estimation is investigated in detail.
The Han River, with a drainage area of 159,000 km2 and a total length of more than 1,500 km, is the largest tributary of the Yangtze River basin. HRB (106°12′–114°14′E, 30°08′–34°11′N) has obvious climate characteristics of a subtropical monsoon. The climate is comparatively mild, with a mean annual temperature between 15°C and 17°C. Rainfall within the Han basin is comparatively abundant, with a mean annual rainfall of 600–1,300 mm. The precipitation is especially concentrated within the summer half year, accounting for quite 70% of the annual precipitation. Among them, June, July, and August are particularly prominent, with precipitation accounting for about 40% to 50% of the annual total. The largest source of the water volume of the Han River and its tributaries is rainwater, followed by groundwater. Groundwater recharge accounts for about 15%–20% of the annual runoff. Therefore, the annual runoff changes of the rivers within the Han River system are basically equivalent because of the annual precipitation changes. The runoff varies greatly from year to year within the basin, with the utmost annual runoff usually thrice the dimensions of the minimum annual runoff. The annual average runoff of the full basin is about 60 billion cubic meters. Because of abundant rainfall, water resources within the basin are very abundant. However, there are differences within the distribution of water resources within the basin and uneven seasonal distribution, and water must be transferred outside the basin. There has been a decreasing trend in water resources in recent years. The maps of Han River basin are shown as Figure 1.
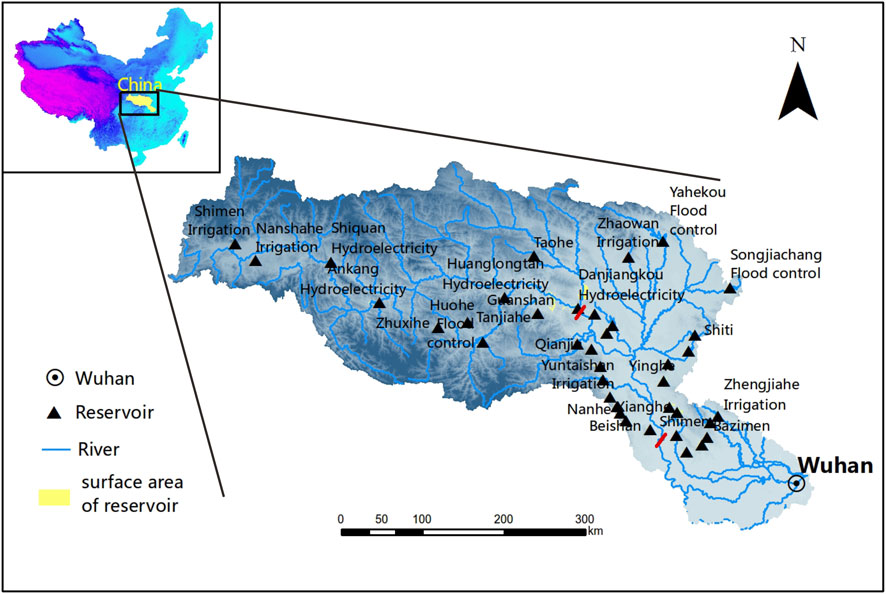
FIGURE 1. Maps of the Han River basin.
As shown in Figure 1, the topography of the eastern area is higher than the western area in the Han River, with dense river networks. The hydrological stations are distributed in the upper, middle, and lower reaches. Except for the Huanglongtan (HLT) station, which is on the tributary, the Zenghe, Baihe (BH) station, Huangjiagang (HJG) station, and Huangzhuang (HZ) station are all on the main stream. The monitoring data of the Huangjiagang (HJG) station are used in this study to investigate the application and accuracy of the LSTM. As shown in the analysis results of the machine learning method, the LSTM method is adopted in this study. The structure of the LSTM method is shown in Figure 2.
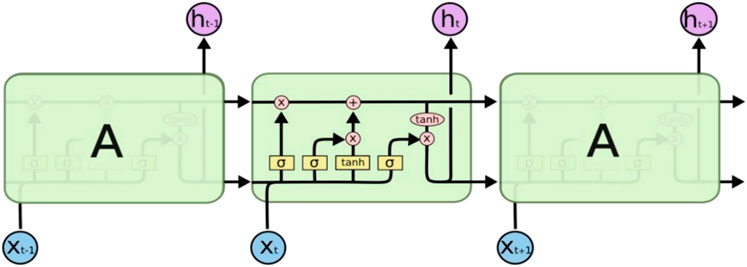
FIGURE 2. The structure of the long short-term memory (LSTM) method unit [18].
As shown in Figure 2, the model can be trained by adding the input gate, the forget gate, and the output gate. Autocorrelation is very important in time series forecasting, especially with LSTM models. Autocorrelation is the basis of LSTM model prediction, and the larger the autocorrelation coefficient (ACF), the better. ACF reflects the memory of the sequence. The LTP and STP mentioned in some studies refer to long-term memory and short-term memory, which are also characteristics of sequences. In addition, the forecast period is determined by autocorrelation: The LSTM method mentioned earlier has a drawback in that it can only predict the next data xt+1. If you want to predict xt+2, we need to substitute xt+1 into the model for prediction. This will cause the accumulation of errors. How does the the encounter period be improved? There is a need to use batch forecasting (batch forecasting): in a forecast to give the expected results of the encounter period. However, the premise of making such a prediction is that the autocorrelation ACF of the data sequence has an order of k, and the prediction order cannot be greater than k. The results of autocorrelation are shown in Figure 3.
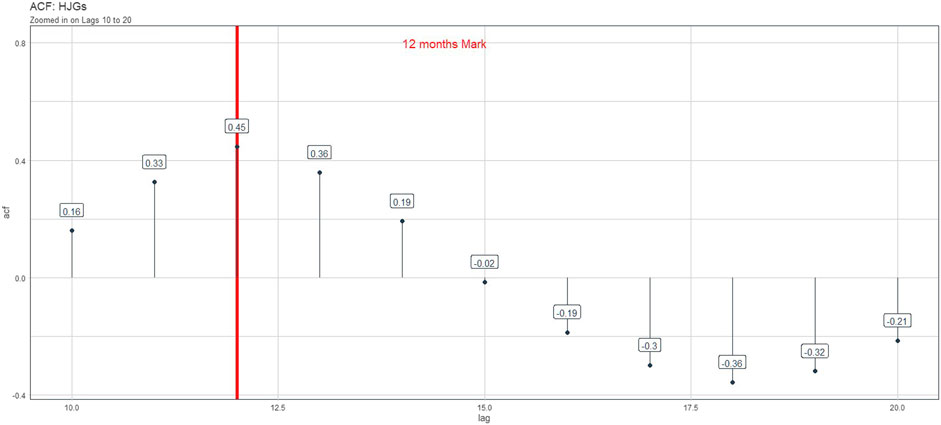
FIGURE 3. The results of autocorrelation.
As shown in Figure 3, it could be presumed that the application of the results can be acceptable. Before the prediction process, the cross-validation should be verified to study the accuracy and application of the trained model. The historical data are adopted in this study. The historical data of Huangjiagang (HJG) and Shiquan (SQ) gauge station from January 1st 1956 to October 1st 2012 are adopted in this study. The specific method is to divide the entire sequence value into 12 parts, each with a length of 144 steps or 12 years, and a sliding window of 4 years. The first 11 years of each subset of 12 years are the training set, and the last year is used as the verification set, which is compared with actual data for verification, and model evaluation indicators are selected to judge the applicability of the model. This study currently selects the RMSE root mean square error, which will be shown later. The cross-validation results of HJG and SQ based on the LSTM are shown as Figures 4 and 5 separately.
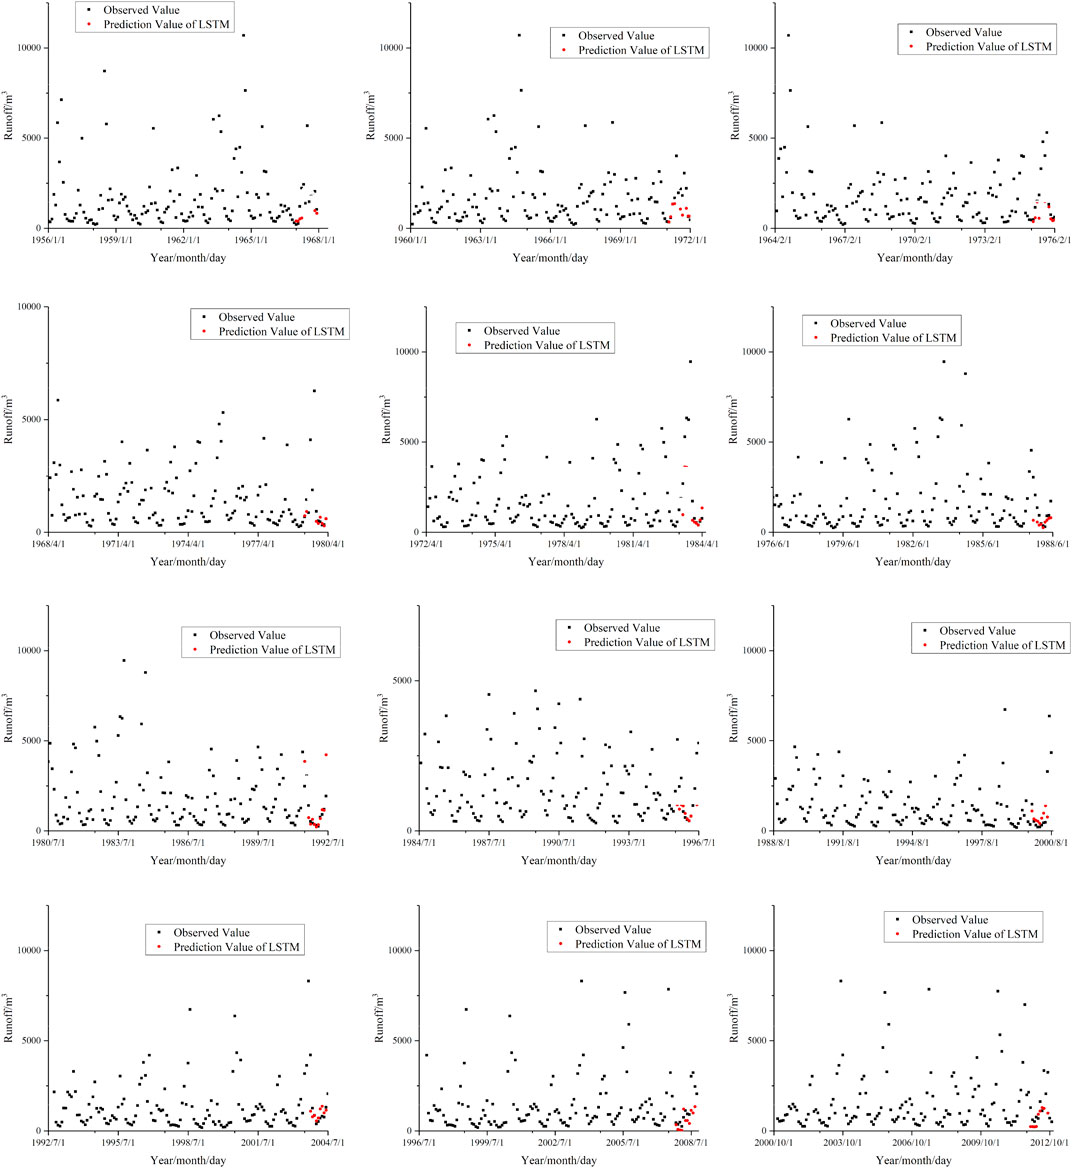
FIGURE 4. The results of cross-validation based on the LSTM.
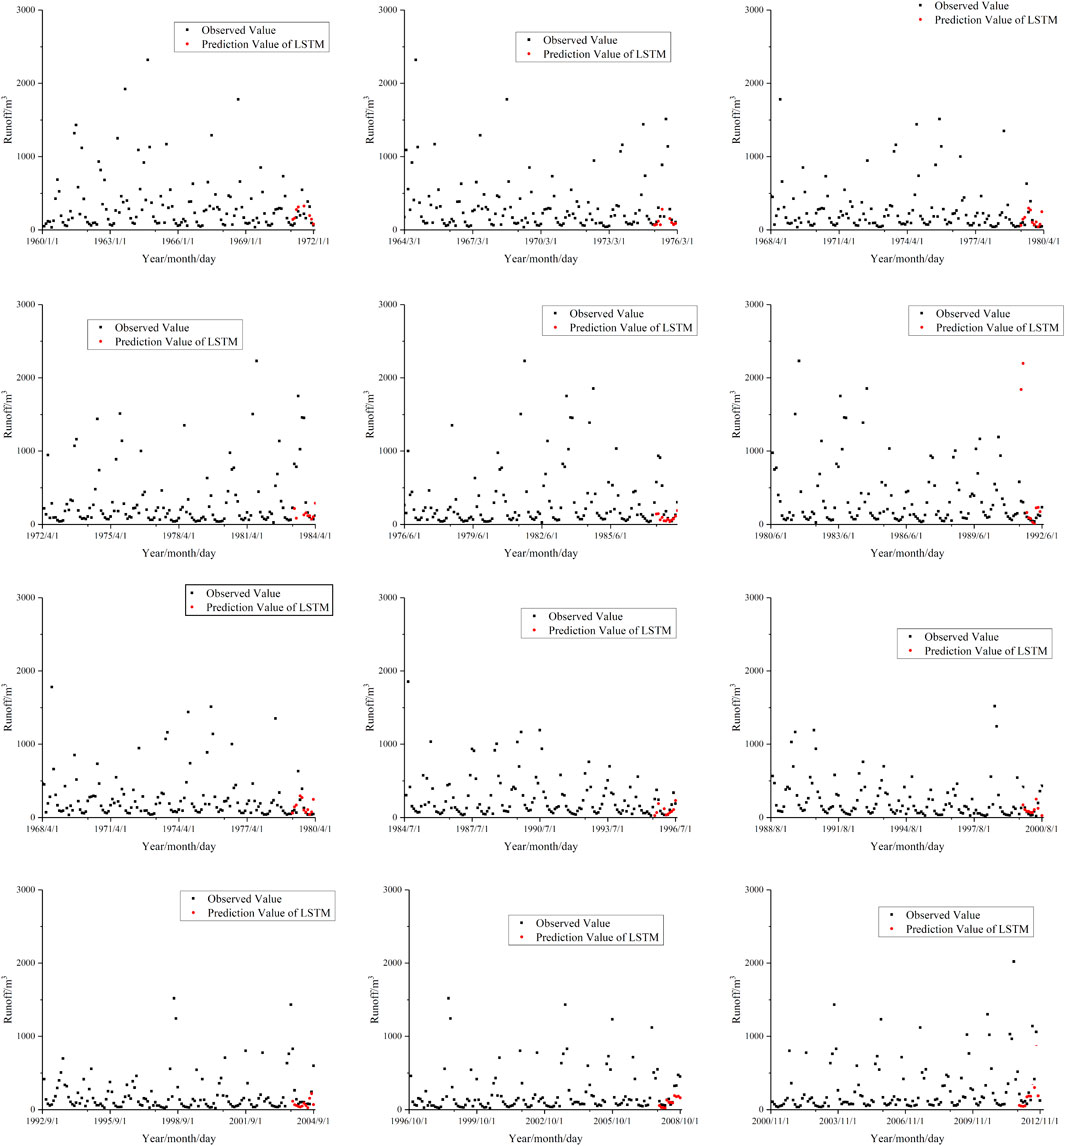
FIGURE 5. the results of cross-validation based on the LSTM in SQ station
From the simulation results (Figure 4), the overall performance of the model is relatively good. Most of the trends in the next year and most points can be found in the 7th, 10th, and 11th subsets. However, the problem is also obvious: the peak value is not too clear. This will be fully reflected in the RMSE. Through the selection of the optimal self-lag order, it can be seen that the largest autocorrelation coefficient appears at the 12th order. Therefore, this high correlation can be used to build a model to make a 12-order prediction. In this study, it is the forecast for the next year for the purpose of the future risk analysis. Finally, the prediction results are shown in Figure 5.
As shown in Figure 5, the prediction result of the Huangjiagang station from January 2014 to January 2015 uses the established model. It can be seen that the perfect prediction of the flood season and nonflood season within a year has surpassed most forecasting models. The results show high application and accuracy characteristics. The parameter estimation study is based on this prediction results.
According to the research data, after studying a large number of spatial and nonspatial hydrological runoff data, the relationship and parameter estimation of hydrological runoff are the key links affecting hydrological application business. For the purpose of simulating the natural hydrological cycle process of a watershed, its basic principle is to generalize various elements in the water cycle by analyzing the key factors of the hydrological cycle process of a watershed, and establish a mathematical model that can truly reflect the relationship between various elements and the hydrological cycle process by using various algebraic, partial differential, or integral equations [21, 22]. Due to the complex structure of the hydrological model and the complex evolution characteristics and spatiotemporal evolution trend of a basin water cycle system, in order to accurately describe the hydrological cycle process of the basin, most hydrological model parameters are difficult to determine. How to determine the runoff parameters that can adapt to the heterogeneity of the underlying surface and the size of runoff level of different basins is the key to obtain high-precision short-term runoff forecast information of the basin [23, 24]. Including basin spatial data, basin meteorological data, runoff simulation data, and other information, through data collection, data processing, parameter estimation, and optimization, hydrological runoff relationship modeling and analysis are realized [25]. Because meteorological conditions and hydrological factors can have a direct impact on runoff, specific hydrometeorological data are needed as the research basis. Among many factor analysis methods, the random forest method is often used for factor analysis and result prediction, due to its high resolution and reliability of prediction results [22, 26, 27]. In essence, it belongs to an important branch of ensemble learning. It uses nonparametric calculations to generate several weak decision trees in a random manner and predicts by integrating the prediction results of all decision trees, which can solve classification problems and can also be used for regression analysis. Random forest is a combined classifier of ensemble learning. It uses bootstrap resampling method to sample from the original data, and then model the decision tree of the extracted samples, combine multiple decision trees, and get the result through voting. For the traditional random forest, when the final voting classification is performed, the voting weight of each decision tree is the same. It seems that this voting method is fair, but the classification accuracy of each decision tree in the random forest is different. Some classification results may be better; some are relatively poor. The main idea is to set a weight for each decision tree. When voting, each decision tree must be multiplied by this weight value. Among them, a part of the training samples is used to train the decision tree in the traditional random forest. After the training is completed, another part of the training samples is used as the test samples to test the classification ability of the decision tree. The PSO algorithm is a global random search algorithm, which is based on group predation behavior of birds in the migration process, while the particle swarm optimization (PSO) is introduced to solve this limitation [28, 29]. The prediction of PSO-RF, prediction value of RF, and observed values are compared.
As shown in Figure 6, the PSO algorithm is adopted in this study to optimize the random forest. First, the training data and test dataset are divided. In this study, the training datasets are 635 months, and the test dataset is 30, which stands for the last 30 months. The input factors are rainfall, temperature, sunshine, relative humidity, wind speed, and evaporation. The output factor is runoff value. Then, in the data preprocessing procedure, the data are standardized. In the PSO algorithm part, the fitness function is first determined. Then the population and speed are initialized. The termination conditions are determined if they are met; if met, the best parameter is obtained; if not, then the speed and position are updated, and the fitness value is calculated until the termination conditions are met. Finally, the best RF model is obtained. Then the prediction results are shown as follows:
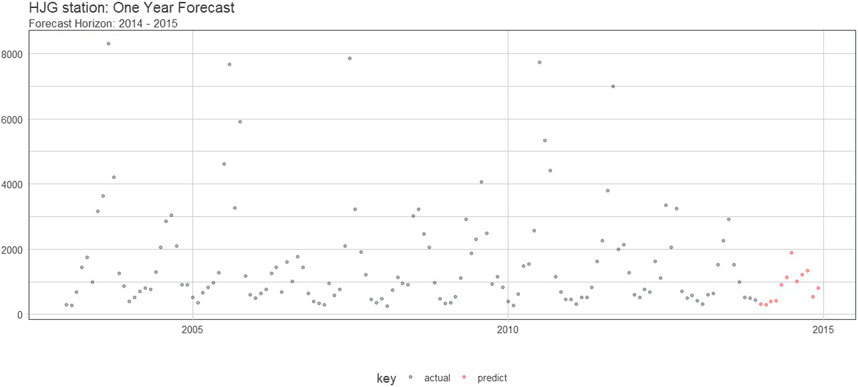
FIGURE 6. Prediction results of 2014–2015 based on the LSTM.
According to Figure 7, it can be obtained that the prediction result of PSO-RF and RF has high resolution and is a good application. The prediction value of PSO-RF and RF has good consistency with the observed value. In the 3 months, it can be seen that the prediction of PSO-RF is closer to the true value compared with the prediction value of RF. It means that the PSO has to improve the peak point value prediction ability. The prediction result of PSO-RF and RF is shown in Table 1.
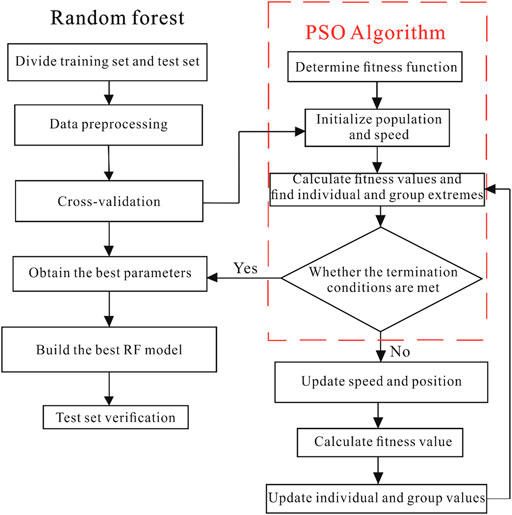
FIGURE 7. Random forest model optimized by the particle swarm optimization (PSO).
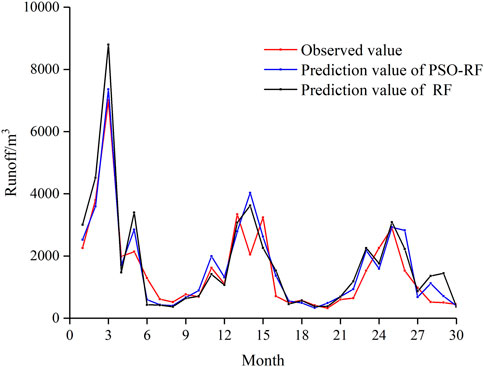
FIGURE 8. Prediction results based on different methods.

TABLE 1. Prediction results of particle swarm optimization (PSO)-random forest (RF) and RF.
According to the Table 1, it can be obtained that the R2 of PSO-RF increases compared with the RF. It is mainly due to the increase that reflects the peak point value, while the RMSE value and MAE of PSO-RF decreases compared with the RF, which means that the PSO-RF can well reflect the real value of the runoff. According to the calculated result, the influence impact of rainfall, temperature, sunshine, relative humidity, wind speed, and evaporation are 7.59, 1.05, 0.50, 2.76, 0.351, and 0.72, respectively. It means the rainfall has the greatest impact on the runoff, which is consistent with the true situation, and wind speed has the lowest impact on the runoff.
We chose two sites to compare the applicability of the LSTM method in the Han River Basin. As the Figure 1 shows, the SQ station is the upstream of Hanjiang basin and the HJG is in the middle of Hanjiang basin. According to Figures 4 and 5, the result of catching peak point has shown noticeable difference. The LSTM method has more ability to catch the peak point in SQ than HJG station may as the a result of the location of these two stations. SQ station has less human activities than HJG will make LSTM more applicative in this area.
In actual engineering fields, the pore water content in a rock has a certain correlation with the runoff. In order to solve the actual engineering issue, the rainfall–runoff of the Han River, which is located in the Karst area, is investigated in detail and predicted. In fact, the accuracy prediction of streamflow is also one of the critical factors for the hydrology. However, due to the highly complicated characteristics of the rainfall–runoff, the LSTM method is adopted in this study to predict the streamflow, and the cross-validation and fitness are studied to verify the effectivity of the prediction model. The result of the prediction well explains the change law of the streamflow. Due to the complexity of the prediction result and influence factor, the RF algorithm is adopted in this study, and PSO is introduced to optimize the RF algorithm. The prediction result shows high accuracy and good consistency with the real results. Among the influence factors, the rainfall has the most impact compared with other factors, which means the PSO-RF has a good application in the influence factor analysis.
The original contributions presented in the study are included in the article/Supplementary Material. Further inquiries can be directed to the corresponding author.
LF and DS conceived the idea of this manuscript. LF developed the theory, performed the computations, verified the results, and completed the written work. All the authors read and approved the final manuscript.
This research was funded by the Variation Characteristics of Water Conversion in Jianghan Plain Under Changing Environment and Adaptation Model for Agricultural Water Saving and Emission Reduction (U21A20156). The authors would like to thank the reviewers and the editors for their valuable suggestions and contributions which significantly improved this article, and would also need to acknowledge the Bureau of Hydrology of Yangtze River Water Resources Commission of Water Resources Ministry that supported the data collection.
The authors declare that the research was conducted in the absence of any commercial or financial relationships that could be construed as a potential conflict of interest.
All claims expressed in this article are solely those of the authors and do not necessarily represent those of their affiliated organizations, or those of the publisher, the editors, and the reviewers. Any product that may be evaluated in this article, or claim that may be made by its manufacturer, is not guaranteed or endorsed by the publisher.
The authors thank the reviewers and the editors for their valuable suggestions and contributions that significantly improved this article. The authors also acknowledge the Construction and Administration Bureau of the Middle-Route of the South-to-North Water Division Project of China, which supported the data collection.
1. Adane GB, Hirpa BA, Gebru BM, Song C, Lee W-K. Integrating Satellite Rainfall Estimates with Hydrological Water Balance Model: Rainfall-Runoff Modeling in Awash River Basin, Ethiopia. Water (2021) 13(6):800. doi:10.3390/w13060800
2. Rau P, Bourrel L, Labat D, Ruelland D, Frappart F, Lavado W, et al. Assessing Multidecadal Runoff (1970-2010) Using Regional Hydrological Modelling under Data and Water Scarcity Conditions in Peruvian Pacific Catchments. Hydrological Process (2019) 33(1):20–35. doi:10.1002/hyp.13318
3. Zhou M, Qu S, Chen X, Shi P, Xu S, Chen H, et al. Impact Assessments of Rainfall-Runoff Characteristics Response Based on Land Use Change via Hydrological Simulation. Water (2019) 11(4):866. doi:10.3390/w11040866
4. Cheng X, Feng Z-K, Niu W-J. Forecasting Monthly Runoff Time Series by Single-Layer Feedforward Artificial Neural Network and Grey Wolf Optimizer. IEEE Access (2020) 8:157346–55. doi:10.1109/access.2020.3019574
5. Cai D, Fraedrich K, Guan Y, Guo S, Zhang C, Zhu X. Urbanization and Climate Change: Insights from Eco-Hydrological Diagnostics. Sci total Environ (2019) 647:29–36. doi:10.1016/j.scitotenv.2018.07.319
6. Chen Q, Chen H, Wang J, Zhao Y, Chen J, Xu C. Impacts of Climate Change and Land-Use Change on Hydrological Extremes in the Jinsha River Basin. Water (2019) 11(7):1398. doi:10.3390/w11071398
7. Kwon M, Kwon H-H, Han D. A Hybrid Approach Combining Conceptual Hydrological Models, Support Vector Machines and Remote Sensing Data for Rainfall-Runoff Modeling. Remote Sensing (2020) 12(11):1801. doi:10.3390/rs12111801
8. Krasnogorskaya N, Longobardi A, Mobilia M, Khasanova LF, Shchelchkova AI. Hydrological Modeling of green Roofs Runoff by Nash cascade Model. Open Civil Eng J (2019) 13(1). doi:10.2174/1874149501913010163
9. Song CM. Hydrological Image Building Using Curve Number and Prediction and Evaluation of Runoff through Convolution Neural Network. Water (2020) 12(8):2292. doi:10.3390/w12082292
10. Chu H, Wei J, Wu W. Streamflow Prediction Using LASSO-FCM-DBN Approach Based on Hydro-Meteorological Condition Classification. J Hydrol (2020) 580:124253. doi:10.1016/j.jhydrol.2019.124253
11. Adamowski J, Fung Chan H, Prasher SO, Ozga‐Zielinski B, Sliusarieva A. Comparison of Multiple Linear and Nonlinear Regression, Autoregressive Integrated Moving Average, Artificial Neural Network, and Wavelet Artificial Neural Network Methods for Urban Water Demand Forecasting in Montreal, Canada. Water Resour Res (2012) 48(1):W01528. doi:10.1029/2010wr009945
12. Di C, Yang X, Wang X. A Four-Stage Hybrid Model for Hydrological Time Series Forecasting. PloS one (2014) 9(8):e104663. doi:10.1371/journal.pone.0104663
13. Romagnoli M, Portapila M, Rigalli A, Maydana G, Burgués M, García CM. Assessment of the SWAT Model to Simulate a Watershed with Limited Available Data in the Pampas Region, Argentina. Sci Total Environ (2017) 596-597:437–50. doi:10.1016/j.scitotenv.2017.01.041
14. Sommerlot AR, Wagena MB, Fuka DR, Easton ZM. Coupling the Short-Term Global Forecast System Weather Data with a Variable Source Area Hydrologic Model. Environ Model Softw (2016) 86:68–80. doi:10.1016/j.envsoft.2016.09.008
15. Ahmed AAM, Deo RC, Feng Q, Ghahramani A, Raj N, Yin Z, et al. Deep Learning Hybrid Model with Boruta-Random forest Optimiser Algorithm for Streamflow Forecasting with Climate Mode Indices, Rainfall, and Periodicity. J Hydrol (2021) 599:126350. doi:10.1016/j.jhydrol.2021.126350
16. Liu C, Wang Y, Hu X, Han Y, Zhang X, Du L. Application of GA-BP Neural Network Optimized by Grey Verhulst Model Around Settlement Prediction of Foundation Pit. Geofluids (2021) 2021:1–16. doi:10.1155/2021/5595277
17. Liu C, Hu X, Yao R, Han Y, Wang Y, He W, et al. Assessment of Soil Thermal Conductivity Based on BPNN Optimized by Genetic Algorithm. Adv Civil Eng (20202020) 2020(3):1–10. doi:10.1155/2020/6631666
18. Van SP, Le HM, Thanh DV, Dang TD, Loc HH, Anh DT. Deep Learning Convolutional Neural Network in Rainfall-Runoff Modelling. J Hydroinformatics (2020) 22(3):541–61. doi:10.2166/hydro.2020.095
19. Cao J, Farnham DJ, Lall U. Spatial-temporal Wind Field Prediction by Artificial Neural Networks. arXiv preprint arXiv:1712.05293 (2017).
20. Hu C, Wu Q, Li H, Jian S, Li N, Lou Z. Deep Learning with a Long Short-Term Memory Networks Approach for Rainfall-Runoff Simulation. Water (2018) 10(11):1543. doi:10.3390/w10111543
21. Burger F, Ayala A, Farias D, Shaw TE, MacDonell S, Brock B, et al. Interannual Variability in Glacier Contribution to Runoff from a High‐elevation Andean Catchment: Understanding the Role of Debris Cover in Glacier Hydrology. Hydrological Process (2019) 33(2):214–29. doi:10.1002/hyp.13354
22. Strobl C, Boulesteix AL, Zeileis A, Hothorn T. Bias in Random forest Variable Importance Measures: Illustrations, Sources and a Solution. Bmc Bioinformatics (2007) 8:25. doi:10.1186/1471-2105-8-25
23. de la Fuente A, Meruane V, Meruane C. Hydrological Early Warning System Based on a Deep Learning Runoff Model Coupled with a Meteorological Forecast. Water (2019) 11(9):1808. doi:10.3390/w11091808
24. Lawrence RL, Wood SD, Sheley RL. Mapping Invasive Plants Using Hyperspectral Imagery and Breiman Cutler Classifications (randomForest). Remote Sensing Environ (2006) 100(3):356–62. doi:10.1016/j.rse.2005.10.014
25. Lee M, Kang N, Joo H, Kim HS, Kim S, Lee J. Hydrological Modeling Approach Using Radar-Rainfall Ensemble and Multi-Runoff-Model Blending Technique. Water (2019) 11(4):850. doi:10.3390/w11040850
27. Rodriguez-Galiano VF, Ghimire B, Rogan J, Chica-Olmo M, Rigol-Sanchez JP. An Assessment of the Effectiveness of a Random forest Classifier for Land-Cover Classification. ISPRS J Photogrammetry Remote Sensing (2012) 67:93–104. doi:10.1016/j.isprsjprs.2011.11.002
28. Lee CM, Ko CN. Time Series Prediction Using RBF Neural Networks with a Nonlinear Time-Varying Evolution PSO Algorithm. Neurocomputing (2009) 73(1-3):449–60. doi:10.1016/j.neucom.2009.07.005
Keywords: long short-term memory (LSTM), pore water, karst, rainfall-runoff, prediction
Citation: Fang L and Shao D (2022) Application of Long Short-Term Memory (LSTM) on the Prediction of Rainfall-Runoff in Karst Area. Front. Phys. 9:790687. doi: 10.3389/fphy.2021.790687
Received: 07 October 2021; Accepted: 01 November 2021;
Published: 26 January 2022.
Edited by:
Qingxiang Meng, Hohai University, ChinaReviewed by:
Chengjin Zhu, Shanghai Jiao Tong University, ChinaCopyright © 2022 Fang and Shao. This is an open-access article distributed under the terms of the Creative Commons Attribution License (CC BY). The use, distribution or reproduction in other forums is permitted, provided the original author(s) and the copyright owner(s) are credited and that the original publication in this journal is cited, in accordance with accepted academic practice. No use, distribution or reproduction is permitted which does not comply with these terms.
*Correspondence: Dongguo Shao, ZG9uZ2d1b3NoYW9AMTYzLmNvbQ==
Disclaimer: All claims expressed in this article are solely those of the authors and do not necessarily represent those of their affiliated organizations, or those of the publisher, the editors and the reviewers. Any product that may be evaluated in this article or claim that may be made by its manufacturer is not guaranteed or endorsed by the publisher.
Research integrity at Frontiers
Learn more about the work of our research integrity team to safeguard the quality of each article we publish.