 Hao Zhang1
 Xingyuan Lu1
 Zhuoyi Wang1A. P. Konijnenberg2Haiyun Wang1
 Chengliang Zhao1*Yangjian Cai1,3,4*
- 1School of Physical Science and Technology, Soochow University, Suzhou, China
- 2Eindhoven University of Technology, Eindhoven, Netherlands
- 3School of Physics and Electronics, Shandong Normal University, Jinan, China
- 4Shandong Provincial Engineering and Technical Center of Light Manipulation & Shandong Provincial Key Laboratory of Optics and Photonic Devices, School of Physics and Electronics, Shandong Normal University, Jinan, China
We report on a partially coherent power-exponent-phase vortex beam (PC-PEPV), whose spatial coherence is controllable and the initial phase exhibits a periodic power exponential change. The PC-PEPV beam was generated experimentally with various spatial coherence widths, and its propagation properties were studied both numerically and experimentally. By modulating the topological charge (TC) and power order of the PC-PEPV beam, the structure of the vortex beam can be adjusted from circular to elliptic, triangular, quadrangle, and pentagon. When the power order is odd, the PC-PEPV beam with a negative TC can be generated, and the profiles of the PC-PEPV beam can be precisely controlled via adjusting the value of the power order. For the case of high spatial coherence width, the number of the dark cores in the polygonal intensity array of the PC-PEPV beam equals the magnitude of the TC. However, when decreasing the spatial coherence width, the dark cores vanish and the intensity gradually transforms into a polygonal light spot. Fortunately, from the modulus and phase distributions of the cross-spectral density (CSD), both the magnitude and sign of the TC can be determined. In the experiment, the modulus and phase distribution of the CSD are verified by the phase perturbation method. This study has potential applications in beam shaping, micro-particle trapping, and optical tweezers.
Introduction
Since it was verified that the optical vortex can carry orbital angular momentum (OAM) [1], it became a research hot spot in the field of light manipulation. It is well known that the optical vortex possesses a helical phase term of exp(imθ), where m is the topological charge (TC) and θ is the azimuthal angle. At the center of the optical vortex, the phase is undetermined and the intensity is zero. Optical vortices are widely investigated in many fields, such as micro-particle manipulation [2–5], free-space optical communications [6–8], optical measurements [9, 10], and super-resolution imaging [11].
The conventional optical vortex has a circular intensity profile, which limits its applications. To address this problem, various asymmetric and non-canonical models for optical vortices are proposed, providing higher freedom of control, for example, the optical vortex with a 3D free-style structure [12], the asymmetric Bessel beam [13], remainder-phase optical vortex [14], anomalous optical vortex [15], and power-exponent-phase vortex (PEPV) [16]. It is worth noting that, compared with the classical vortex, the PEPV beam has a non-uniform phase and a spiral-shaped intensity distribution. Specifically, the phase on a closed path around the center point will increase exponentially. Soon afterward, the propagation properties of the PEPV beam was investigated [17], and this kind of vortex shows more advantages in particle manipulation [18–20]. Recently, a new kind of PEPV (NPEPV) beam was proposed, where each part of the spiral phase increases from 0 to 2π, showing exponential growth [21]. In addition, the phase and intensity patterns both show rotational symmetry. However, these excellent studies are only focused on the field of fully coherent light.
Coherence is one of the most important characteristics of the laser beam. Compared with the fully coherent beam, the partially coherent beam [22, 23] is more ubiquitous and has some unique advantages in practical applications. For instance, the partially coherent beam can increase the transfer efficiency in the process of non-linear optics [24], enhance the signal to noise ratio [25], decrease the bit error ratio [26], and realize particle trapping [27, 28] and ghost imaging [29, 30]. The partially coherent vortex beam was first proposed by Gori et.al., which is expressed by the incoherent superposition of a series of coherent Laguerre–Gaussian modes [31]. Subsequently, the study of the vortex beam has expanded from fully coherent to partially coherent and attracted enormous attention during the past decades [32–38]. The partially coherent vortex beam has several advantages over the fully coherent vortex beam. For instance, it is less disturbed when propagating through a turbulent atmosphere [39] as high-freedom beam shaping is possible [40], and it has remarkable self-reconstruction properties [41]. Different from fully coherent vortex beam with dark hollow intensity distribution, the central dark core in the partially coherent vortex beam will gradually vanish as the spatial coherence width decreases [42]. To describe the singularity of the partially coherent vortex beam, the concept of a coherence vortex, named as coherence singularity, is proposed. It reveals that the singularity of the partially coherent vortex will be hidden in the distribution of the cross-spectral density (CSD), instead of intensity [43, 44]. Meanwhile, the TC of the partially coherent beam can be determined by measuring the modulus and phase of the CSD function [45, 46]. However, the aforementioned conventional partially coherent vortex beams only carry the common helical phase term exp(imθ), where the structure of the beams can only be reshaped from a doughnut-like intensity pattern to a circular intensity spot, limiting its practical applications. It inspires us to explore a special partially coherent vortex beam with a controllable structure.
To address this problem, in this study, we propose the theoretical model of a partially coherent power-exponent-phase vortex (PC-PEPV) beam, and its propagation properties are studied by numerical simulations. Different from the conventional partially coherent vortex beam, the PC-PEPV beam can realize a polygonal-structured intensity distribution and be shaped freely and precisely via varying the initial spatial coherence width, power order, and topological charge. In addition, we experimentally generated the PC-PEPV beam and measured the modulus and phase distributions of its CSD function via the phase perturbation method. The coherence singularities are observed in the phase distributions, which helps the determination of magnitude and sign of the TC. Compared with the partially coherent conventional vortex beam, our study enriches the mode distributions and realizes a controllable beam shaping, which have potential applications in particle manipulation.
Methods
Principle of Generating the PC-PEPV Beam
Compared with a conventional vortex beam with a uniformly varying phase, that is, exp(imθ), the electric field of a NPEPV beam with Gaussian-distributed amplitude in the source plane (z = 0) can be written as [21]:
where (r, θ) denotes the polar coordinates in the source plane, r is the radial coordinate, θ is the azimuthal coordinate, w0 is the beam width, rem(.) means the remainder function [14], m is the TC number, and n represents the power order of the spiral phase. Note that the power order n can be an integer or a fraction. It should be noted that the NPEPV beam will reduce to the conventional vortex beam if the parameters are n = 1.
To distinguish the difference between the conventional vortex beam and NPEPV beam, according to Eq. 1, the initial phases of them are depicted in Figure 1. Here, the value of TC is fixed as m = 3. As shown in Figures 1A,B, the initial phases with power order n = 1 and 2 can be regard as the initial phase of conventional vortex and NPEPV beam, respectively. Furthermore, the relationship between the initial phases and azimuth of the two phases is shown in Figure 1C. In contrast to the initial phase of the conventional vortex beam, which has a linear variation from 0 to 2π, the initial phase of the NPEPV beam shows a periodic power exponential change. However, the Eq.1 is only suitable for perfectly coherent cases which neglected the significance of coherence of the light. Hence, in the following study, we extend this fully coherent NPEPV beam to a partially coherent field.
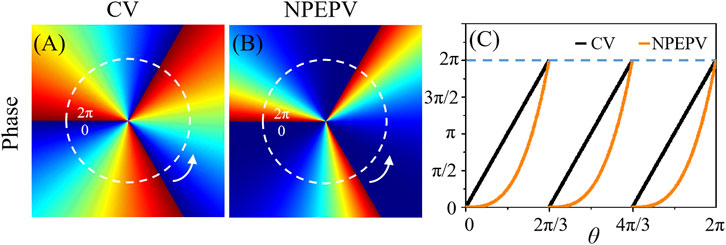
FIGURE 1. Numerical simulation initial phases of the conventional vortex (CV) and NPEPV. (A) is the initial phase of the conventional vortex beam with TC m = 3, and power order n = 1, (B) is the initial phase of the NPEPV beam with TC m = 3 and power order n = 3, and (C) is the relationship between the initial phases and azimuth in a closed path marked by the white circular dashed line in Figure 1A; Figure 1B.
For a partially coherent beam, the CSD function in the space–frequency domain [23, 47] can be used to express its statistical characteristics as follows:
where (r1, θ1) and (r2, θ2) represent the coordinates of two random points in the source plane, denotes the ensemble average, and * represents the complex conjugate. In the following derivation, for brevity, we only consider a monochromatic beam and omit the frequency ω [42, 48]. By substituting Eq. 1 into Eq. 2, we find that for a Schell model PC-PEPV beam carrying the distinct power-exponent-phase shown in Figure 1B, the CSD function can be written as follows (see Supplementary Material):
where σ denotes the initial spatial coherence width of the beam. Generally, the propagation properties through a paraxial ABCD optical system can be studied via the generalized Collins formula. The CSD function in the observation plane can be written as follows:
Here, ρ and φ are the radial and azimuthal coordinates of the observation plane, respectively. A, B, C, and D are the transfer matrix elements of the optical system. For a focused optical system, we can set A = 0, B = f, C = −1/f, and D = 1, where f is the focal length of the lens.
OAM Spectrum of the PC-PEPV Beam
Due to the introduction of the power order, the characteristics of the PC-PEPV beam differ from the conventional partially coherent vortex, which is closely related to the OAM spectrum. In Figure 2, we calculated the OAM spectrum of the PC-PEPV beam with different initial spatial coherence and power order in the source plane. Here, TC m = 3 and w0 = 1 mm. Any vortex beam can be expressed as an orthogonal superposition of a series of integer OAM beams [49, 50]. Hence, the Eq. 1 can be rewritten as follows:
where l is an integer and the mode coefficients are given by:
and the power weight is defined as
Here, the normalized power weight for each OAM mode can then be defined as follows:
As depicted in Figures 2A–C, the power order n = 1, which corresponds to a conventional vortex beam. Clearly, the OAM spectrum of the conventional vortex beam with high spatial coherence is shown in Figure 2A and features a unique peak at l = 3. When the spatial coherence decreases, the OAM spectrum tends to a Gaussian distribution, and the main peak is located at l = 3. As the power order increases, that is, n = 2 and 3, the conventional vortex beam transforms into the PC-PEPV beam, and the OAM spectra with high spatial coherence are depicted in Figures 2D,G, respectively. By contrast, the OAM spectrum increases at l = 0 and 6 but decreases at l = 3 due to the power order in the spiral phase. Similarly, the OAM spectrum tends to a Gaussian distribution as the spatial coherence decreases.
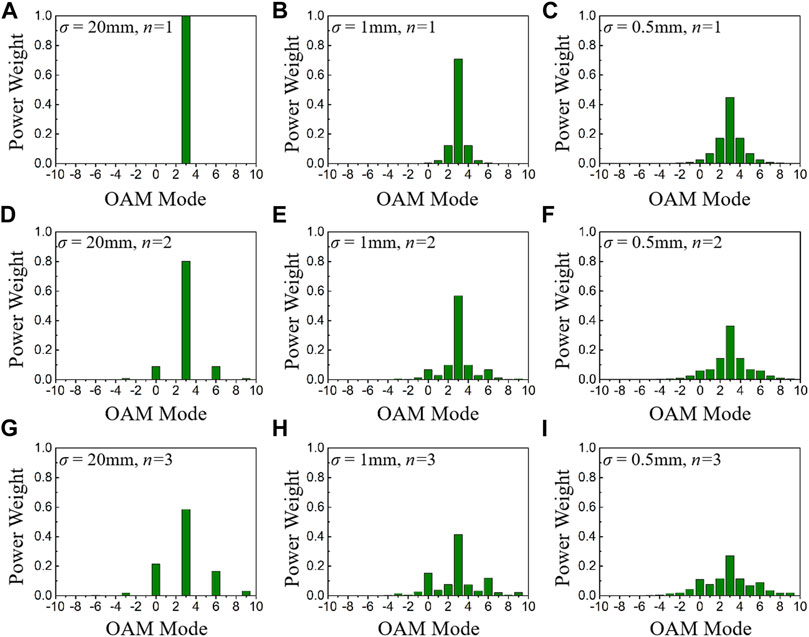
FIGURE 2. OAM spectrum of the PC-PEPV beam with beam waist w0 = 1 mm and TC m = 3, under different spatial coherence σ and power order n. (A–C) σ = 20, 1, 0.5 mm, and power order n = 1; (D–F) σ = 20, 1, 0.5 mm, and power order n = 2; and (G–I) σ = 20, 1, 0.5 mm, and power order n = 3.
Experimental Setup
The schematic of the experimental setup is depicted in Figure 3, which is used for generating a PC-PEPV beam and measuring the modulus and phase distribution of its CSD function. The coherent laser beam with a wavelength of λ = 532 nm is emitted from a solid-state laser and then expanded by the beam expander. The expanded beam is focused on the rotating ground-glass disk (with 400 Grit and 20 Hz rotational frequency) by the lens L1 (f1 = 100 mm), and then collimated by the lens L2 (f2 = 100 mm) to get a partially coherent Gaussian Schell model beam with controllable spatial coherence. The initial spatial coherence width can be controlled via adjusting the focused beam spot size on the rotating ground-glass disk [47]. The aperture A1 is used to get the central area of the partially coherent Gaussian Schell model beam. Then it is reflected to the first spatial light modulator (SLM1) via a mirror M. As shown in Figure 3A, the fork grating loaded on SLM1 is designed via the method of computer-generated holograms [10]. Then the lenses L3 and L4 and aperture A2 are used to form a 4-f system and filter the +1 order of the output beam, named as the PC-PEPV beam. The PC-PEPV beam is focused by the lens L5. One path is reflected via the beam splitter, and the intensity is recorded by the charge-coupled device (CCD1), which is located at the focal plane of L5. To verify the CSD distribution and measure the coherence singularities of the PC-PEPV beam, the other path is transmitted through the beam splitter and focused onto SLM2. The phase written into SLM2 is shown in Figure 3B, containing a central square window with displacement grating, spherical wave phase for focusing, and an additional central phase perturbation [51, 52]. Note that the focused input PC-PEPV beam and the center of SLM2 need to be aligned. Finally, the output beam from SLM2 is reflected by the beam splitter and recorded by the CCD2 located at the Fourier plane.
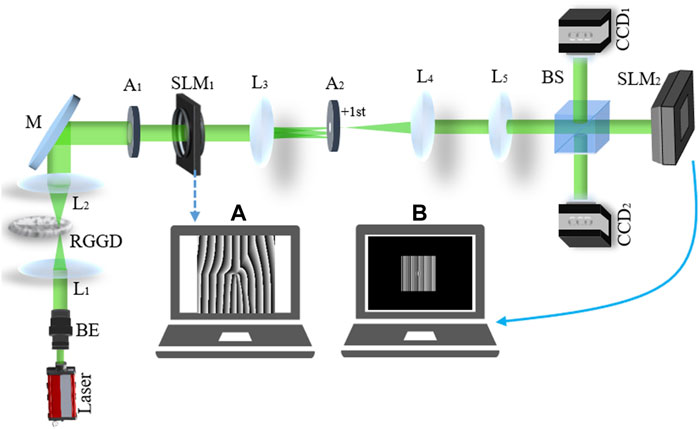
FIGURE 3. Experimental setup for generating a PC-PEPV beam and measuring the amplitude and phase distribution of its CSD. (A) Fork grating written into SLM1 and (B) phase mask written into SLM2. BE, beam expander; L1–L5, lenses; RGGD, rotating ground-glass disk; M, mirror; A1, A2, apertures; SLM1, SLM2, spatial light modulators; BS, beam splitter; and CCD1, CCD2, charge-coupled device.
Method to Measure the CSD Function of the PC-PEPV Beam
The Fourier transformation intensity recorded by the CCD2 with no additional phase perturbation can be written as follows:
where W(ρ1, ρ2) is the CSD function of the PC-PEPV beam on the plane of SLM2 and k represents the coordinate vector in the plane of CCD2. Then we introduce an on-axis phase perturbation at ρ2 = ρ0 = (0, 0) of SLM2. The complex-valued phase perturbation can be expressed as C = [exp(iφ) – 1]δ(ρ – ρ0), where δ(ρ) represents the Dirac function. Thus, the perturbed Fourier transformation intensity will change as follows:
Performing an inverse Fourier transform of this intensity gives the following equation:
To measure the CSD function of the PC-PEPV beam, the phase assignments φ need to be assigned three times to get three equations, and the CSD function can be calculated via the following equation:
Here, C1, C2, and C3 represent three different phase perturbations with φ equal to φ1, φ2, and φ3, which should be chosen as far away as possible within 2π (i.e., phase working range of SLM2 with wavelength equal to 532 nm). It can help obtain three intensities with maximum difference and enhance the signal to noise ratio of the retrieval. Here, we set φ1 = 0, φ2 = −2π/3, and φ3 = 2π/3.
Results and Discussion
Numerical Simulation Results With Different Coherence Width and TC
In this section, we investigate the properties of the PC-PEPV beam focused by a thin Fourier lens via numerical calculation based on the complex random screen decomposition [53–55]. Figure 4 illustrates the initial phase patterns of PC-PEPV beams on the source plane and the simulated distributions of PC-PEPV beams on the focal plane with high initial spatial coherence width (σ = 20 mm), including the intensity, and the modulus and phase of the CSD function with on-axis reference (r2 = 0, θ2 = 0). The initial spatial coherence width means the transverse width between the maximum value to the point with e−1/2 the maximum value of the modulus of the degree of coherence [23]. Here, λ = 532 nm, w0 = 1 mm, f = 300 mm, power order n = 2, and TCs m = 2, 3, 4, and 5. The simulated initial phase patterns and intensity patterns are shown in the first and second rows of Figure 4, respectively. It is observed that the initial phase exhibits a periodic power exponential change and the polygonal optical vortex arrays are generated, respectively. The number of the dark cores are N = 2, 3, 4, and 5, which are equal to the absolute value of the TC. Note that each dark core is a unit vortex with TC = +1 so that they are separated imperfect doughnut-like dark core. Moreover, the geometry of the generated PC-PEPV beam are elliptic, triangular, quadrangle, and pentagon, respectively, which is specific compared with the conventional vortex beam that has a “doughnut-like” profile. In this case where we have a high initial spatial coherence width, the number of vortices and the geometry of the PC-PEPV beam can be freely modulated via adjusting the values of the TC.
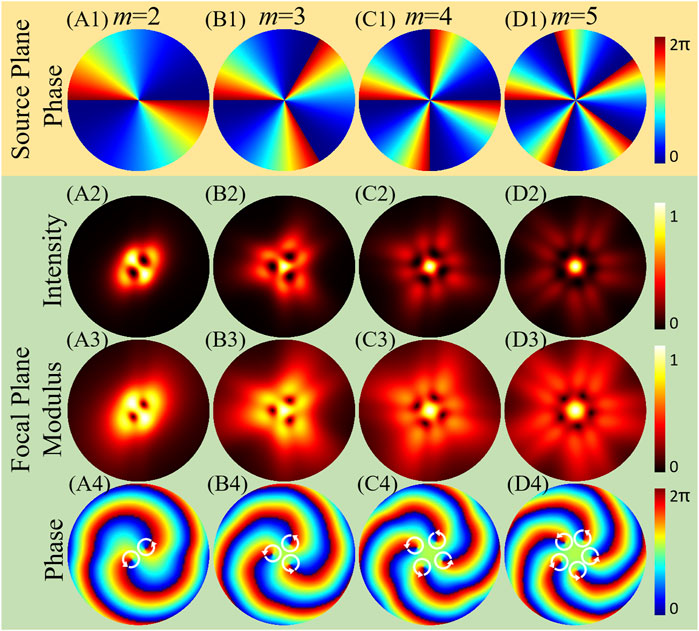
FIGURE 4. Numerical simulation initial phases, intensities, and CSD distributions of the PC-PEPV with high spatial coherence (σ = 20 mm) and power order n = 2. (A1–D1) are the initial phases on the source plane, (A2–D2) are the intensity patterns, (A3–D3) are the modulus of the CSD function, and (A4–D4) are the phase patterns of the CSD function. All results are calculated on the focal plane, except the initial phase. White circular arrows represent the anticlockwise direction of the phase winding which indicates the positive TC.
However, as the TC increases, the intensity becomes higher for the central spot and lower for the outer region. The reason is that radius of a vortex beam will increase with the TC increase, which causes the total energy to disperse in the outer region. As a consequence, the dark cores in the intensity gradually become indistinguishable and the value of the TC becomes difficult to determine. To solve this problem, we calculated the modulus and the phase of the CSD function, as shown in the third and bottom rows of Figure 4, respectively. The structure of the modulus is similar to the intensity pattern when the initial spatial coherence width σ is much larger than the beam waist w0. Furthermore, the number of the dark cores in the modulus of the CSD function also equals the magnitude of the TC. To verify the sign of the vortex, the corresponding phase patterns are shown in Figures 4A4–D4. The phase rotation of coherence singularities is marked by the white circular arrow. Anticlockwise corresponds to a positive sign of TC and clockwise indicates that the TC is negative [56]. The locations of these phase singularities correspond to those of the dark cores in the modulus of the CSD function. Furthermore, it can be seen from the phases that a light spot appeared in the center of intensity owing to the split of the singularities.
Then we studied the characteristic of the PC-PEPV beam with a medium spatial coherence width, which is equal to the beam waist (σ = 1 mm). The intensity patterns of the PC-PEPV beam are depicted in Figures 5A1–D1, which show that the focusing properties are very different between the PC-PEPV beam with different spatial coherence widths. The dark cores in the PC-PEPV beam at the focal plane disappear gradually as the coherence width σ decreases. When the TC is equal to 2 and 3, the zero-intensity dark cores in the high coherence case become low-intensity cores, as shown in Figures 5A1,B1. As the TC became larger, as shown in Figures 5C1,D1, the dark cores nearly disappeared, and the geometric structure of the vortex array disappeared at the same time. In this case, we could not determine the magnitude of the TC from its intensity. However, the modulus of the CSD function distribution in Figures 5A2–D2 remains the same as that in Figure 4 for high coherence case. Even for TC equals 5, one can also clearly tell that the number of the dark cores is equal to the number of the TC. Meanwhile, the magnitude and sign of the TC also can be determined via the phase distribution, as depicted in the bottom row of Figure 5.
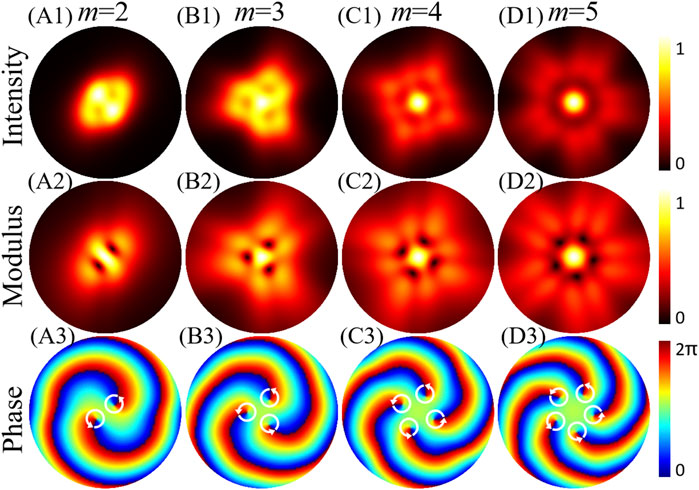
FIGURE 5. Numerical simulation intensities and CSD distributions of the PC-PEPV beams on the focal plane with medium spatial coherence equal to the beam waist (σ = 1 mm) and power order n = 2. (A1–D1) are the intensity patterns, (A2–D2) are the modulus of the CSD function, and (A3–D3) are the phase patterns of the CSD function. White circular arrows represent the anticlockwise direction of the phase winding which indicates the positive TC.
In Figure 6, we consider a low spatial coherence (σ = 0.5 mm) to investigate the properties of the PC-PEPV beam. The dark cores in the intensity have completely vanished due to the modes overlapping for the partially coherent beam with lower coherence width [37]. The intensity is Gaussian distributed, and the geometry of the PC-PEPV beam becomes elliptic, triangular, quadrangle, and pentagon light spots which is specific compared with the conventional partially coherent vortex beam (show a circular intensity spot with Gaussian distribution) [32]. If the coherence width decreases further, the PC-PEPV beam will degenerate to a circularly symmetric Gaussian distribution [57]. From the low coherence intensity patterns, we could not find any information about the TC. However, we can still find the magnitude and sign of the TC from the modulus and phase of the CSD function, as shown in the middle and bottom rows of Figure 6.
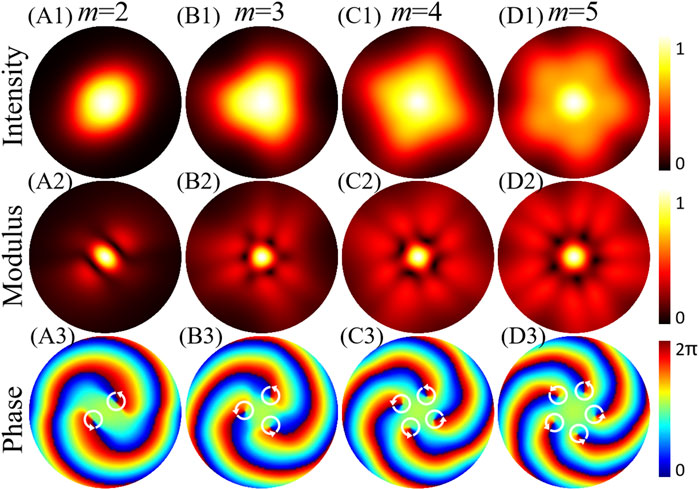
FIGURE 6. Numerical simulation intensities and CSD distributions of the PC-PEPV beams on the focal plane with low spatial coherence (σ = 0.5 mm) and power order n = 2. (A1–D1) are the intensity patterns, (A2–D2) are the modulus of the CSD function, and (A3–D3) are the phase patterns of the CSD function. White circular arrows represent the anticlockwise direction of the phase winding which indicates the positive TC.
Regulation Characteristics of the Power Order
As well known, the TC can be negative. In the aforementioned discussion of Figures 4–6, the sign of the TC m must be positive due to the power order n = 2. However, with the power order n = 3, the TC of the PC-PEPV beam can be both positive and negative, as shown in Figure 7. The intensity, modulus, and phase of the CSD function of the PC-PEPV beam with high coherence width (σ = 20 mm) and TC (m = 3 and −3) are depicted in Figures 7A1–A3; Figures 7B1–B3, respectively. Meanwhile, the PC-PEPV beam with low coherence width (σ = 0.5 mm) and TC (m = 3 and −3) are demonstrated in Figures 7C1–C3 and Figures 7D1–D3, respectively. Compared with n = 2, the intensity of the central light spot increases and the intensities of the dark cores decrease. This is because the larger power order value makes the zeroth component of the spiral phase higher [21]. In addition, the magnitude and sign of the TC can be determined by the modulus and phase of the CSD function patterns. As depicted in Figures 7A3–D3, the anticlockwise phase winding (positive TC) and clockwise phase winding (negative TC) of coherence singularities are marked by the white and black circle arrows, respectively. The positive and negative of TC is relative, which is based on the theoretical model of the vortex phase, that is, Equation 1.
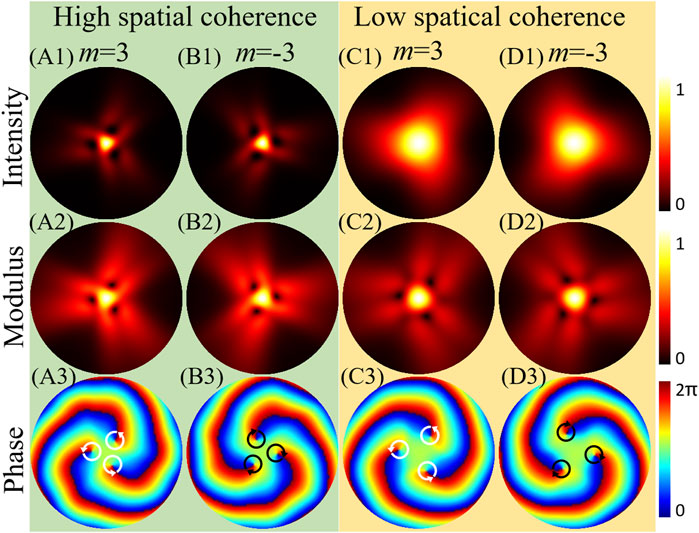
FIGURE 7. Numerical simulation intensities and CSD distributions of the PC-PEPV beams on the focal plane with positive and negative TCs and power order n = 3 under high and low spatial coherence (σ = 20 and 0.5 mm). (A1–D1) are the intensity patterns, (A2–D2) are the modulus of the CSD function, and (A3–D3) are the phase patterns of the CSD function. White circular arrows represent the anticlockwise direction of the phase winding which indicates the positive TC.
To further study the influence of the power order n, the numerical simulation intensities and CSD distributions of the PC-PEPV beam with power order n increase from 4 to 10 with step 2 are shown in Figure 8. Here, the TC m equals 3 and low spatial coherence σ is equal to 0.5 mm. In contrast to the aforementioned PC-PEPV beam with small power order n, the intensity transforms from triangular to approximately a Gaussian form with the increase of power order n, as shown in Figures 8A1–D1 The reason is that the initial phase of the PC-PEPV beam is approaching to a constant with an increase power order n [21]. In addition, as shown in Figures 8A2–D2 the modulus of the CSD function remains the same structure but decreases intensity in the outer region. It is interesting to note that the three positive singularities split to three positive and negative singularity pairs, which cause the total TC approach to 0 owing to annihilate between the singularity pairs, as depicted in Figures 8A3–D3.
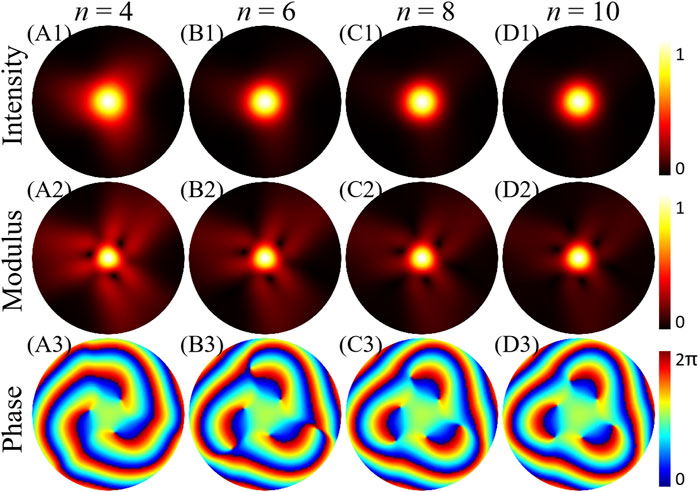
FIGURE 8. Numerical simulation of intensities and CSD distributions of the PC-PEPV beams on the focal plane with TC m = 3 and low spatial coherence (σ = 0.5 mm). (A1–D1) are the intensity patterns, (A2–D2) are the modulus of the CSD function, and (A3–D3) are the phase patterns of the CSD function.
Corresponding Experimental Results of the PC-PEPV Beam
Figure 9 shows the experimental measurements of the PC-PEPV beam with high coherence width (σ = 20 mm), and the other parameters are the same as that in Figure 4. The first row of Figure 9 depicts the experimental intensity patterns of the PC-PEPV beam captured with CCD1, which agree well with the numerical simulation results in Figure 4. The middle row demonstrates the experimental modulus of the CSD function of the PC-PEPV beam. The green spots represent the perturbation point located in the center. For TC equals 2, 3, 4, and 5, we can observe 2, 3, 4, 5 dark cores in the modulus of the CSD function, respectively, whose location correspond to the intensity dark cores. The number of the dark cores in the intensity and modulus of the CSD function both indicate the magnitude of the TC. Furthermore, based on Eq. 12, we can also get the phase distributions of CSD function of the PC-PEPV beam, as shown in Figures 9A3–D3. When TC is positive, the phase winding is anticlockwise and consistent for all the coherence singularities. The number of coherence singularities indicates the magnitude of TC and the orientation reveals the sign of the TC.
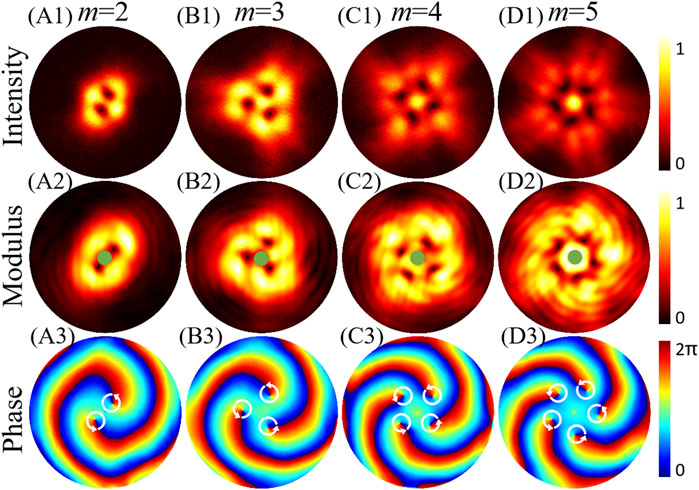
FIGURE 9. Experimental intensity on CCD1 and CSD distributions of the PC-PEPV beam with high spatial coherence width (σ = 20 mm). (A1–D1) are intensity patterns, (A2–D2) are modulus of the CSD function, and (A3–D3) are phase patterns of the CSD function.
Figures 10, 11 show the experimental results of the PC-PEPV beam with medium (σ = 1 mm in Figure 10) and low spatial coherences (σ = 0.5 mm in Figure 11). The other parameters are the same as those in Figures 5, 6, respectively. As shown in the first row of Figures 10, 11, the dark cores in the intensity patterns fade away when the coherence width decreases, and the magnitude of the TC can no longer be determined from the intensity distributions. However, we can also obtain the magnitude of the TC from its retrieved modulus of the CSD function, as shown in the middle row of Figures 10, 11. Similarly, both the sign and magnitude of the TC can be determined from the phase patterns, as shown in the bottom row of Figures 10, 11. In the case with low coherence, the PC-PEPV beam with elliptic, triangular, quadrangle, and pentagon structures can be generated experimentally. The results may be useful in the field of beam shaping and optical trapping.
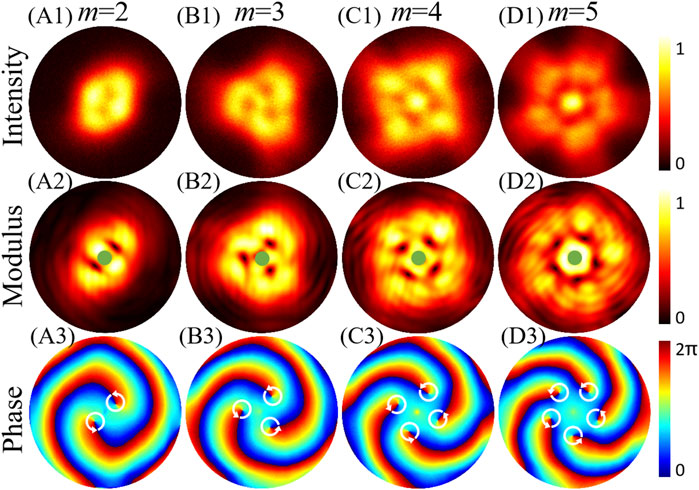
FIGURE 10. Experimental intensity on CCD1 and CSD distributions of the PC-PEPV beam with medium spatial coherence width (σ = 1 mm). (A1–D1) are intensity patterns, (A2–D2) are modulus of the CSD function, and (A3–D3) are phase patterns of the CSD function.
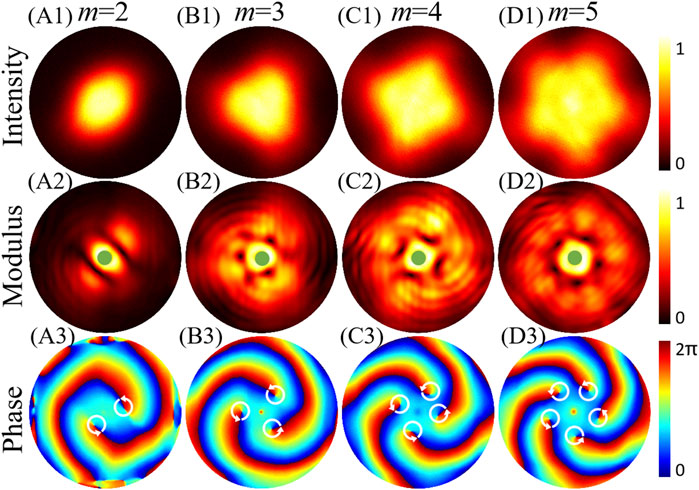
FIGURE 11. Experimental intensity on CCD1 and CSD distributions of the PC-PEPV beam with low spatial coherence width (σ = 0.5 mm). (A1–D1) are intensity patterns, (A2–D2) are modulus of the CSD function, and (A3-D3) are phase patterns of the CSD function.
In addition, with odd power order (n = 3), the PC-PEPV beam with positive and negative TC are generated experimentally, as depicted in Figure 12. All parameters of the PC-PEPV beam are same as those in Figure 7. The intensity and the modulus and phase of the CSD function are in agreement with the simulation results in Figure 7. Based on the aforementioned discussion, we know that the TC can adjust the polygonal structure of the PC-PEPV beam. Furthermore, the power order can also help realize a precise manipulation of the structure from circle to polygonal. The details of the numerical simulations and experimental intensities of the PC-PEPV beam (m = 3) with high and low spatial coherence are shown in Videos 1 and 2 (mmc 1 mmc 2 of the Supplementary Material), respectively, where the power order n increase from 1 to 3 with step 0.1.
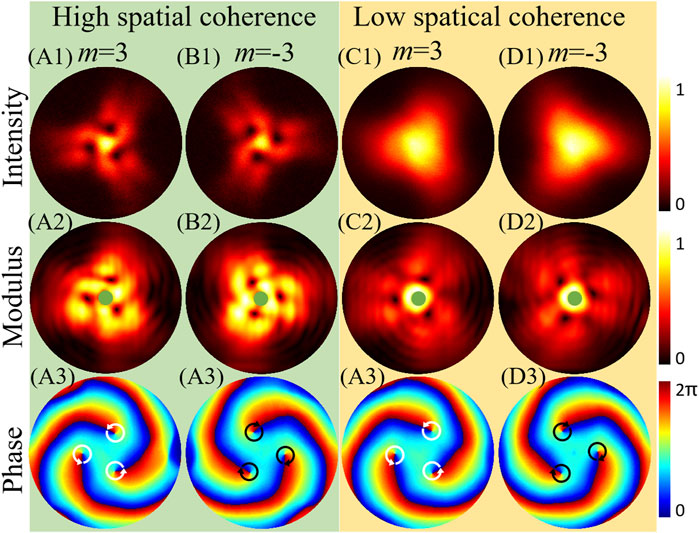
FIGURE 12. Experimental intensity on CCD1 and CSD distributions of the PC-PEPV beam with odd power order n = 3 and positive and negative TCs under high (σ = 20 mm) and low spatial coherence width (σ = 0.5 mm). (A1–D1) are intensity patterns, (A2–D2) are modulus of the CSD function, and (A3–D3) are phase patterns of the CSD function.
Conclusion
In conclusion, we have introduced the theoretical model of a PC-PEPV beam and studied its propagation properties numerically and experimentally. Different from the conventional partially coherent vortex beam where only a circular intensity distribution remains, the polygonal-structured intensity distribution of the PC-PEPV beam is manipulated by the value of the TC, and the polygonal vortex array is transformed into a polygonal light spot by decreasing the spatial coherence width. Furthermore, the value of the power order is used to control the details of the structure. For a PC-PEPV beam, the magnitude and sign of the TC can be determined by the coherence singularities in modulus and phase of CSD function, even when the optical array structure in the intensity fades away as the spatial coherence decreases. Moreover, when the power order is even, the sign of the TC is always positive. Our experimental results agree well with the numerical simulation results. We believe that the results will be useful for beam shaping and optical trapping.
Data Availability Statement
The original contributions presented in the study are included in the article/Supplementary Material, further inquiries can be directed to the corresponding authors.
Author Contributions
HZ proposed the idea. HZ and XL wrote the original manuscript. HZ and ZW performed the experiment. AK, HW, and CZ gave suggestions in numerical simulations. CZ and YC supervised the project. All authors contributed to the revision of the manuscript and approved the final version.
Funding
This work was supported by the National Key Research and Development Program of China (2019YFA0705000), National Natural Science Foundation of China (12174280, 11774250, 11974218, and 91750201), Innovation Group of Jinan (2018GXRC010), Priority Academic Program Development of Jiangsu Higher Education Institutions, China Scholarship Council (201906920048), and Tang Scholar, Local Science and Technology Development Project of the Central Government (YDZX20203700001766).
Conflict of Interest
The authors declare that the research was conducted in the absence of any commercial or financial relationships that could be construed as a potential conflict of interest.
Publisher’s Note
All claims expressed in this article are solely those of the authors and do not necessarily represent those of their affiliated organizations, or those of the publisher, the editors, and the reviewers. Any product that may be evaluated in this article, or claim that may be made by its manufacturer, is not guaranteed or endorsed by the publisher.
Supplementary Material
The Supplementary Material for this article can be found online at: https://www.frontiersin.org/articles/10.3389/fphy.2021.781688/full#supplementary-material
References
1. Allen L, Beijersbergen MW, Spreeuw RJC, Woerdman JP. Orbital Angular Momentum of Light and the Transformation of Laguerre-Gaussian Laser Modes. Phys Rev A (1992) 45:8185–9. doi:10.1103/PhysRevA.45.8185
3. Padgett M, Bowman R. Tweezers with a Twist. Nat Photon (2011) 5:343–8. doi:10.1038/NPHOTON.2011.81
4. Li X, Zhou Y, Cai Y, Zhang Y, Yan S, Li M, et al. Generation of Hybrid Optical Trap Array by Holographic Optical Tweezers. Front Phys (2021) 9:591747. doi:10.3389/fphy.2021.591747
5. Zhang H, Li X, Ma H, Tang M, Li H, Tang J, et al. Grafted Optical Vortex with Controllable Orbital Angular Momentum Distribution. Opt Express (2019) 27:22930–8. doi:10.1364/OE.27.022930
6. Wang J, Yang J-Y, Fazal IM, Ahmed N, Yan Y, Huang H, et al. Terabit Free-Space Data Transmission Employing Orbital Angular Momentum Multiplexing. Nat Photon (2012) 6:488–96. doi:10.1038/NPHOTON.2012.138
7. McLaren M, Agnew M, Leach J, Roux FS, Padgett MJ, Boyd RW, et al. Entangled Bessel-Gaussian Beams. Opt Express (2012) 20:23589–97. doi:10.1364/OE.20.023589
8. Bozinovic N, Yue Y, Ren Y, Tur M, Kristensen P, Huang H, et al. Terabit-scale Orbital Angular Momentum Mode Division Multiplexing in Fibers. Science (2013) 340:1545–8. doi:10.1126/science.1237861
9. Lavery MPJ, Speirits FC, Barnett SM, Padgett MJ. Detection of a Spinning Object Using Light's Orbital Angular Momentum. Science (2013) 341:537–40. doi:10.1126/science.1239936
10. Forbes A, Dudley A, McLaren M. Creation and Detection of Optical Modes with Spatial Light Modulators. Adv Opt Photon (2016) 8:200–27. doi:10.1364/AOP.8.000200
11. Tamburini F, Anzolin G, Umbriaco G, Bianchini A, Barbieri C. Overcoming the Rayleigh Criterion Limit with Optical Vortices. Phys Rev Lett (2006) 97:163903. doi:10.1103/PhysRevLett.97.163903
12. Rodrigo JA, Alieva T. Freestyle 3D Laser Traps: Tools for Studying Light-Driven Particle Dynamics and beyond. Optica (2015) 2:812–5. doi:10.1364/OPTICA.2.000812
13. Kotlyar VV, Kovalev AA, Soifer VA. Asymmetric Bessel Modes. Opt Lett (2014) 39:2395–8. doi:10.1364/OL.39.002395
14. Ma H, Li X, Zhang H, Tang J, Li H, Tang M, et al. Optical Vortex Shaping via a Phase Jump Factor. Opt Lett (2019) 44:1379–82. doi:10.1364/OL.44.001379
15. Yang Y, Zhu X, Zeng J, Lu X, Zhao C, Cai Y. Anomalous Bessel Vortex Beam: Modulating Orbital Angular Momentum with Propagation. Nanophotonics (2018) 7:677–82. doi:10.1515/nanoph-2017-0078
16. Li P, Liu S, Peng T, Xie G, Gan X, Zhao J. Spiral Autofocusing Airy Beams Carrying Power-exponent-phase Vortices. Opt Express (2014) 22:7598–606. doi:10.1364/OE.22.007598
17. Lao G, Zhang Z, Zhao D. Propagation of the Power-exponent-phase Vortex Beam in Paraxial ABCD System. Opt Express (2016) 24:18082–94. doi:10.1364/OE.24.018082
18. Cheng S, Xia T, Liu M, Jin Y, Zhang G, Xiong Y, et al. Power-exponent Helico-Conical Optical Beams. Opt Laser Techn (2019) 117:288–92. doi:10.1016/j.optlastec.2019.04.041
19. Wang H, Tang L, Ma J, Hao H, Zheng X, Song D, et al. Optical Clearing and Shielding with Fan-Shaped Vortex Beams. APL Photon (2020) 5:016102. doi:10.1063/1.5133100
20. Pei Z, Huang S, Chen Y, Yan C. Comparison of Microparticle Manipulating Characteristics of Canonical Vortex Beam and Power-exponent-phase Vortex Beam. J Mod Opt (2021) 68:224–32. doi:10.1080/09500340.2021.1889060
21. Shen D, Wang K, Zhao D. Generation and Propagation of a New Kind of Power-exponent-phase Vortex Beam. Opt Express (2019) 27:24642–53. doi:10.1364/OE.27.024642
22. Wolf E. Optics in Terms of Observable Quantities. Nuovo Cim (1954) 12:884–8. doi:10.1007/BF02781855
23. Mandel L, Wolf E. Optical Coherence and Quantum Optics. Cambridge: Cambridge University Press (1995).
24. Cai Y, Peschel U. Second-harmonic Generation by an Astigmatic Partially Coherent Beam. Opt Express (2007) 15:15480–92. doi:10.1364/OE.15.015480
25. Ricklin JC, Davidson FM. Atmospheric Optical Communication with a Gaussian Schell Beam. J Opt Soc Am A (2003) 20:856–66. doi:10.1364/JOSAA.20.000856
26. Ricklin JC, Davidson FM. Atmospheric Turbulence Effects on a Partially Coherent Gaussian Beam: Implications for Free-Space Laser Communication. J Opt Soc Am A (2002) 19:1794–802. doi:10.1364/JOSAA.19.001794
27. Zhao C, Cai Y, Lu X, Eyyuboğlu HT. Radiation Force of Coherent and Partially Coherent Flat-Topped Beams on a Rayleigh Particle. Opt Express (2009) 17:1753–65. doi:10.1364/OE.17.001753
28. Zhang J-F, Wang Z-Y, Cheng B, Wang Q-Y, Wu B, Shen X-X, et al. Atom Cooling by Partially Spatially Coherent Lasers. Phys Rev A (2013) 88:023416. doi:10.1103/PhysRevA.88.023416
29. Cai Y, Zhu S-Y. Ghost Interference with Partially Coherent Radiation. Opt Lett (2004) 29:2716–8. doi:10.1364/OL.29.002716
30. Liu X, Wang F, Zhang M, Cai Y. Experimental Demonstration of Ghost Imaging with an Electromagnetic Gaussian Schell-Model Beam. J Opt Soc Am A (2015) 32:910–20. doi:10.1364/JOSAA.32.000910
31. Gori F, Santarsiero M, Borghi R, Vicalvi S. Partially Coherent Sources with Helicoidal Modes. J Mod Opt (1998) 45:539–54. doi:10.1080/09500349808231913
32. Wang F, Cai Y, Korotkova O. Partially Coherent Standard and Elegant Laguerre-Gaussian Beams of All Orders. Opt Express (2009) 17:22366–79. doi:10.1364/OE.17.022366
33. Li J, Zhang H, Lü B. Partially Coherent Vortex Beams Propagating through Slant Atmospheric Turbulence and Coherence Vortex Evolution. Opt Laser Techn (2010) 42:428–33. doi:10.1016/j.optlastec.2009.08.019
34. Raburn WS, Gbur G. Singularities of Partially Polarized Vortex Beams. Front Phys (2020) 8:168. doi:10.3389/fphy.2020.00168
35. Zeng J, Liu X, Wang F, Zhao C, Cai Y. Partially Coherent Fractional Vortex Beam. Opt Express (2018) 26:26830–44. doi:10.1364/OE.26.026830
36. Ostrovsky AS, García-García J, Rickenstorff-Parrao C, Olvera-Santamaría MA. Partially Coherent Diffraction-free Vortex Beams with a Bessel-Mode Structure. Opt Lett (2017) 42:5182–5. doi:10.1364/OL.42.005182
37. Dong M, Zhao C, Cai Y, Yang Y. Partially Coherent Vortex Beams: Fundamentals and Applications. Sci China Phys Mech Astron (2021) 64:224201. doi:10.1007/s11433-020-1579-9
38. Liu R, Wang F, Chen D, Wang Y, Zhou Y, Gao H, et al. Measuring Mode Indices of a Partially Coherent Vortex Beam with Hanbury Brown and Twiss Type experiment. Appl Phys Lett (2016) 108:051107. doi:10.1063/1.4941422
39. Gallo K, Assanto G. All-optical Diode Based on Second-Harmonic Generation in an Asymmetric Waveguide. J Opt Soc Am B (1999) 16:267–9. doi:10.1364/JOSAB.16.000267
40. Masters BR. Three-dimensional Microscopic Tomographic Imaging of the Cataract in a Human Lens In Vivo. Opt Express (1998) 3:332–8. doi:10.1364/OE.3.000332
41. Yelin D, Oron D, Thiberge S, Moses E, Silberberg Y. Multiphoton Plasmon-Resonance Microscopy. Opt Express (2003) 11:1385–91. doi:10.1364/OE.11.001385
42. Gbur G, Visser TD. Coherence Vortices in Partially Coherent Beams. Opt Commun (2003) 222:117–25. doi:10.1016/S0030-4018(03)01606-7
43. Gbur G, Visser TD, Wolf E. Hidden Singularities in Partially Coherent Wavefields. J Opt A: Pure Appl Opt (2004) 6:S239–S242. doi:10.1088/1464-4258/6/5/017
44. Cai Y, Chen C. Paraxial Propagation of a Partially Coherent Hermite-Gaussian Beam through Aligned and Misaligned ABCD Optical Systems. J Opt Soc Am A (2007) 24:2394–401. doi:10.1364/JOSAA.24.002394
45. Zeng J, Lu X, Liu L, Zhu X, Zhao C, Cai Y. Simultaneous Measurement of the Radial and Azimuthal Mode Indices of a Higher-Order Partially Coherent Vortex Beam Based on Phase Detection. Opt Lett (2019) 44:3881–4. doi:10.1364/OL.44.003881
46. Liu X, Shen Y, Liu L, Wang F, Cai Y. Experimental Demonstration of Vortex Phase-Induced Reduction in Scintillation of a Partially Coherent Beam. Opt Lett (2013) 38:5323–6. doi:10.1364/OL.38.005323
47. Cai Y, Chen Y, Yu J, Liu X, Liu L. Generation of Partially Coherent Beams. Prog Opt (2017) 62:157–223. doi:10.1016/bs.po.2016.11.001
48. Palacios DM, Maleev ID, Marathay AS, Swartzlander GA. Spatial Correlation Singularity of a Vortex Field. Phys Rev Lett (2004) 92:143905. doi:10.1103/PhysRevLett.92.143905
49. Zeng J, Liu X, Zhao C, Wang F, Gbur G, Cai Y. Spiral Spectrum of a Laguerre-Gaussian Beam Propagating in Anisotropic Non-kolmogorov Turbulent Atmosphere along Horizontal Path. Opt Express (2019) 27:25342–56. doi:10.1364/OE.27.025342
50. Pinnell J, Nape I, Sephton B, Cox MA, Rodríguez-Fajardo V, Forbes A. Modal Analysis of Structured Light with Spatial Light Modulators: a Practical Tutorial. J Opt Soc Am A (2020) 37:C146–C160. doi:10.1364/JOSAA.398712
51. Shao Y, Lu X, Konijnenberg S, Zhao C, Cai Y, Urbach HP. Spatial Coherence Measurement and Partially Coherent Diffractive Imaging Using Self-Referencing Holography. Opt Express (2018) 26:4479–90. doi:10.1364/OE.26.004479
52. Lu X, Shao Y, Zhao C, Konijnenberg S, Zhu X, Tang Y, et al. Noniterative Spatially Partially Coherent Diffractive Imaging Using Pinhole Array Mask. Adv Photon (2019) 1:1. doi:10.1117/1.AP.1.1.016005
53. Xiao X, Voelz D. Wave Optics Simulation Approach for Partial Spatially Coherent Beams. Opt Express (2006) 14:6986–92. doi:10.1364/OE.14.006986
54. Voelz D, Xiao X, Korotkova O. Numerical Modeling of Schell-Model Beams with Arbitrary Far-Field Patterns. Opt Lett (2015) 40:352–5. doi:10.1364/OL.40.000352
55. Tong R, Dong Z, Chen Y, Wang F, Cai Y, Setälä T. Fast Calculation of Tightly Focused Random Electromagnetic Beams: Controlling the Focal Field by Spatial Coherence. Opt Express (2020) 28:9713–27. doi:10.1364/OE.386187
56. Li X, Zhang H. Anomalous Ring-Connected Optical Vortex Array. Opt Express (2020) 28:13775–85. doi:10.1364/OE.390985
Keywords: singular optics, vortex beam, partially coherent, power-exponent-phase, beam shaping
Citation: Zhang H, Lu X, Wang Z, Konijnenberg AP, Wang H, Zhao C and Cai Y (2021) Generation and Propagation of Partially Coherent Power-Exponent-Phase Vortex Beam. Front. Phys. 9:781688. doi: 10.3389/fphy.2021.781688
Received: 23 September 2021; Accepted: 25 October 2021;
Published: 23 November 2021.
Edited by:
Pei Zhang, Xi’an Jiaotong University, ChinaReviewed by:
Zhi-Han Zhu, Harbin University of Science and Technology, ChinaXinzhong LI, Henan University of Science and Technology, China
Copyright © 2021 Zhang, Lu, Wang, Konijnenberg, Wang, Zhao and Cai. This is an open-access article distributed under the terms of the Creative Commons Attribution License (CC BY). The use, distribution or reproduction in other forums is permitted, provided the original author(s) and the copyright owner(s) are credited and that the original publication in this journal is cited, in accordance with accepted academic practice. No use, distribution or reproduction is permitted which does not comply with these terms.
*Correspondence: Chengliang Zhao, emhhb2NoZW5nbGlhbmdAc3VkYS5lZHUuY24=; Yangjian Cai, eWFuZ2ppYW5jYWlAc3VkYS5lZHUuY24=