 Su-Hua Zhou
 Shuai-Kang Zhou2
 Jiu-Chang Zhang
95% of researchers rate our articles as excellent or good
Learn more about the work of our research integrity team to safeguard the quality of each article we publish.
Find out more
BRIEF RESEARCH REPORT article
Front. Phys. , 14 October 2021
Sec. Interdisciplinary Physics
Volume 9 - 2021 | https://doi.org/10.3389/fphy.2021.777216
This article is part of the Research Topic Microscopic Structure Effect on the Macroscopic Property of Geomaterials View all 63 articles
The spatial variability of soil properties is inherent. A series of direct shear tests were carried out on strongly weathered slates samples with weak bedding planes, the result of which indicates the existence of variability of shear strength parameters. Based on the testing results, several numerical simulations of slopes were conducted considering such a variability of shear strength. The results had shown that the weak bedding planes affect the shape of sliding arc as well as the factor of safety of slopes. As the dip angle of bedding planes increases, the shape of the sliding surface changes from circular to a mixed form of circular and planner. When incorporating the spatial variability of weak planes’ shear strength into the stability analysis, the safety factors of slopes would reduce, in which the sliding arc exhibited a sliding band comprising multiple sets of sliding arcs.
The factor of safety (FS) is one of the commonly exploited indicators in slope stability analysis. It is defined as the ratio of the shear strength to the resistance force on the critical slip surface (CSS) of the slope. The CSS refers to a particular slip surface with the lowest FS in the slope. Many studies have revealed that the shear strength of rocks and soils usually exhibits a high degree of spatial variability due to complex geological, environmental, and physical effects. Such inherent variability leads to the uncertainty of slope stability. As a result, it is of great importance to take into account the spatial variability of shear strength parameters in the analysis of the problem.
In the past few decades, numerous works have focused on the spatial variability of rock and soil strength and its effect on the slope stability and reliability. For instance, Pinheiro Branco et al. [1] investigated the spatial variability of a granite residual soil and variation coefficients and fluctuation scales as quantitative statistical indicators are proposed. Ip et al. [2] evaluated and compared the algorithms of random forest, ordinary kriging, and regression kriging in predicting the spatial variation of soil shear strength parameters. Cai et al. [3] and Jiang et al. [4] examined the influence of the shear strength variability of soil on the slope reliability by utilizing the infinite and two-dimensional slope models, respectively. Qi and Li [5] studied the effects of such a variability on the evolution of the critical slip surface. By exploiting the random fields simulation technique, Nguyen et al. [6] assessed the probability of rainfall-induced landslides by considering the spatial variation of soil strength.
This study is aimed to scrutiny the stability of a bedding slate slope accounting for the spatial variability of shear strength of bedding surfaces. A highway slope with bedding slates is chosen as the case study. The contents of this paper are organized as follows. Initially, a series of direct shear tests are performed to measure the shear strength parameters of slate bedding planes. Then, the probabilistic distribution of shear strength parameters is evaluated by fitting the experimentally observed data. Finally, the numerical models for the slopes accounting for the spatial variability of weak bedding planes are established and explained in some detail.
The tested materials in the present study are strongly weathered argillaceous slates, which are collected from an exposed slope along the No.76 Xiamen-Chengdu national highway. The composition of the slope is argillaceous slate. Due to the frequent and heavy tectonic activities, these slates have experienced moderately or highly weathering with well-developed bedding structures. Based on the field survey, the dipping direction and angle of structural planes of the testing slope are 120° and 40°, respectively. The composition of the interlayer filler of the structural planes are clay minerals, and slate debris with thickness varying from 3 to 15 mm. During the rainfall period, the water content of filling argillaceous would increase, significantly reducing its strength. Thereby, the strength of the structural planes plays a crucial role in determining slope stability. To obtain the shear strength parameters required for the slope stability analysis, the samples of slates with structural planes are collected from the testing slope for the in-door direct shear test. To explore the spatial variability of parameters associated with the mechanical aspects of slates, 12 samples in total are collected from different parts of the slope.
As demonstrated in Figures 1A–C, the testing equipment exploited in the present scrutiny is XJ-1 portable shearing system. The normal and shear loading forces are applied using four SYB-2S hydraulic pumps. The maximum applied force on samples was 10 MPa. The horizontal and normal components of displacements are measured during the loading process by utilizing four dial indicators. In the laboratory, some steel units are built to prepare the testing specimens.
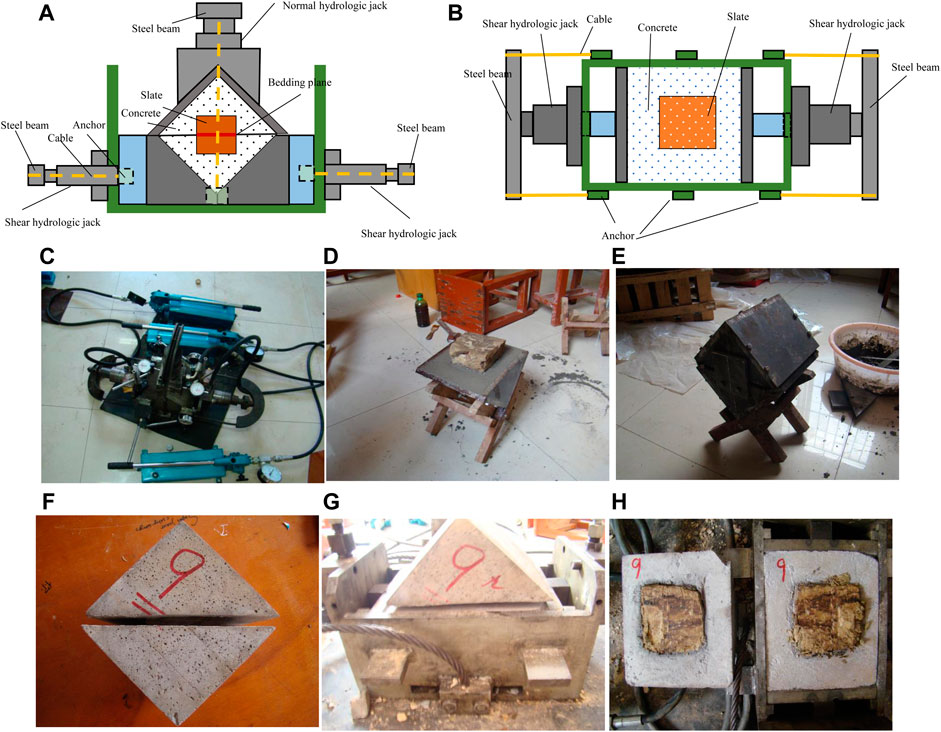
FIGURE 1. (A) Illustration of side view of testing equipment; (B) Illustration of top view of testing equipment; (C) Photo of testing equipment; (C–F) Preparation of testing specimen; (G) Setup of specimen; (H) Failed specimen.
As shown in Figures 1C–H, the dimensions of the exploited units are 200 mm × 200 mm × 200 mm in cubic form with two mirror parts. To guarantee us that the size of the shearing plane would be greater than 70 × 70 mm, each slate sample is cut into a size of 100 mm × 100 mm × 100 mm. The cut slates are placed inside the unit with mortar fulfilled the rest space. In this process, two parts of slate samples in separated units are aligned. Additionally, a gap of 5–10 mm between the two parts of the unit is reserved. Before performing the test, these prepared specimens are cured for 14 days under room temperature and humidity conditions. In total, twenty testing specimens are prepared, and the laboratory shearing tests are conducted based on the following steps.
Step 1. Placing the prepared specimen in the shearing equipment.
Step 2. Execration of the normal force via the hydraulic pumps. The normal force is applied with an increment of 10% of the estimated maximum normal force. The normal displacements corresponding to each force level are simultaneously recorded.
Step 3. Execration of the shear force via the hydraulic pumps. The shear force is applied with an increment of 10% of the estimated maximum shear force. Similarly, the horizontal displacements associated with each force level are simultaneously recorded. If the shear displacements of a shear force level exceeds 1.5 times of those resulted from the previous shear force level, half of the shear force is exerted until reaching the peak strength. The loading is terminated as the residual strength is reached (i.e., the loading force is harshly reduced while the shear displacement quickly grows). During applying shear force, the normal force should be fairly kept fixed with a disturbance less than 1%.
Step 4. When the shearing process is finished, first the shear force and then the normal force is unloaded. The unloading of both normal and shear forces in each step is performed with a reduction rate of 10% of the highest value.
The plots of the shear stress
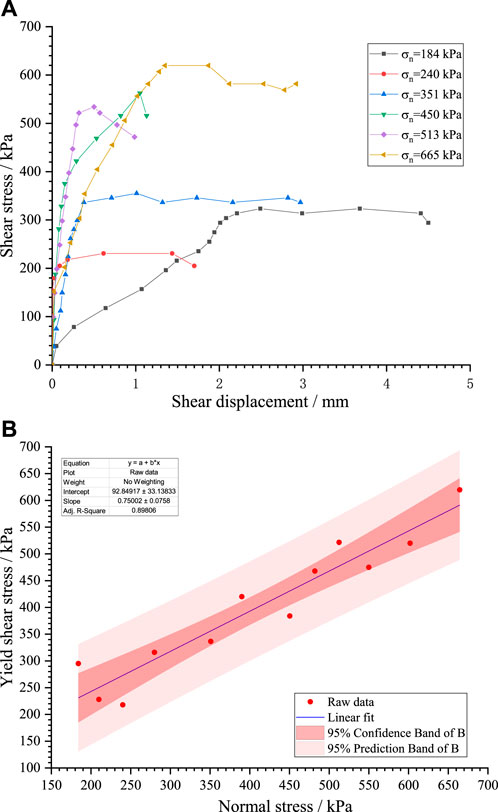
FIGURE 2. (A) Direct shear test result; (B) Fitting of yield shear stress.
The Mohr-Coulomb (M-C) failure criterion is the most frequently exploited one to describe materials’ strength. To obtain the shear strength parameters (i.e., cohesion strength
Due to the spatial variability of rock masses, the mechanical parameters at all points of the slope medium would not be constant, as illustrated in Figure 2B. By this view, two important issues should be taken into account in the stability analysis of bedding slopes: one is the dip angle of bedding, and the other is the spatial variability of the shear strength for weak bedding structures. These issues affect the failure modes of bedding slopes as well as their stabilities. Hence, this section establishes a FLAC3D slope model, as demonstrated in Figure 3, by considering the inclination and spatial variability of bedding structures. The constitutive model of the slope adopts a ubiquitous joint model, adding a weak surface in Mohr-Coulomb material, which also obeys the Mohr-Coulomb yielding criterion. The physical and mechanical properties of rock mass and weak surface are considered by the model simultaneously. The failure may firstly occur in rock mass or along the weak surface, or both at the same time, which mainly relies on the stress state of rock mass, joint occurrence, and mechanical properties of rock mass and joints. The strength reduction method is commonly employed for slope stability analysis. For the given numerical analyses, the strength parameters of the slope’s rock and soil mass (including rock mass and weak surface) would gradually reduce until the slope reaches the limit state. The ratio of the strength parameter value of rock and soil mass to the strength parameter of the limit state can be readily calculated, the so-called safety factor. Simultaneously, the position and shape of the potential failure of the sliding surface can be achieved based on the elastic-plastic calculation results.
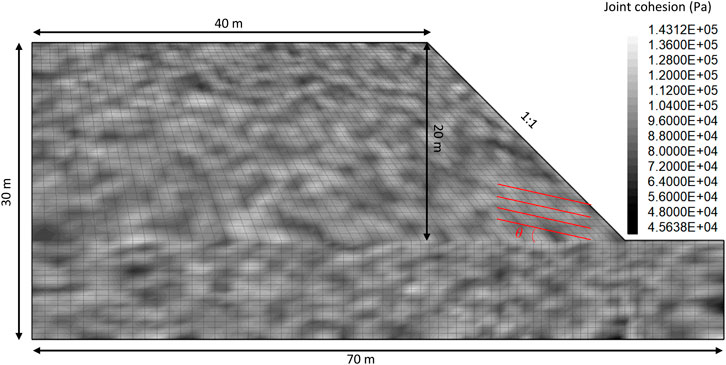
FIGURE 3. Numerical models of slopes.
Obviously, the available test data are usually limited due to the limitation of engineering investigation and test costs, and it is challenging to achieve statistical characteristics of geotechnical parameters based on the limited test data. According to previous examinations, the normal distribution function can better reflect the statistical characteristics of strength parameters of the rock mass. As a result, we choose the normal distribution to understand the spatial variability of the shear strength of the soft slope layer. The friction angle and cohesion are generally considered as the independent factors among all the shear strength parameters of the rock mass [7,8]. According to the laboratory test results, it is assumed that the friction angle obeys the normal distribution with mean value and standard deviation of 23° and 2°, respectively. Further, the cohesion parameter follows the normal distribution whose mean value and standard deviation in order are 100 and 20 kPa. The rock matrix is assumed to be homogenous of friction angle 25°and of cohesion 200 kPa. The elastic modulus and Poisson’s ratio of the model are 500 MPa and 0.3, respectively. Further, the dip angle varies in the range of 0°–90°. As depicted in Figure 3, the strength parameters of each block in the model are randomly set on the basis of the normal distribution. When it is relatively difficult to obtain the real parameters of all positions of the slope body in the geological survey, the random field model could be a suitable replacement for the actual geological situation in a mathematical sense through the limited geological survey or test data. The results of each implementation of the random field model can be regarded as a possible actual situation. For the sake of comparison, the modeling results that ignore the spatial variability of the shear strength have also been provided.
In Figure 4, the results of various cases have been provided. Figures 4A,C,E,G illustrate the modeling results of slopes containing the bedding planes with various dip angles. In these models, the shear strength parameters of the slope masses are assumed to be constant. Figures 4B,D,F,H show the corresponding modeling results of slopes accounting for the spatial variability of shear strengths. It can be observed from Figures 4A–H that the sliding arcs of bedding slopes with constant shear strength parameters are generally similar to those obtained for the cases with considering the spatially variable parameters; nevertheless, the sliding arcs calculated with constant shear strength parameters would be smoother than those obtained based on the spatial variability of shear strength parameters. Additionally, a few sub-arcs are also detectable in Figures 4B,F,H, which formed a sliding band.
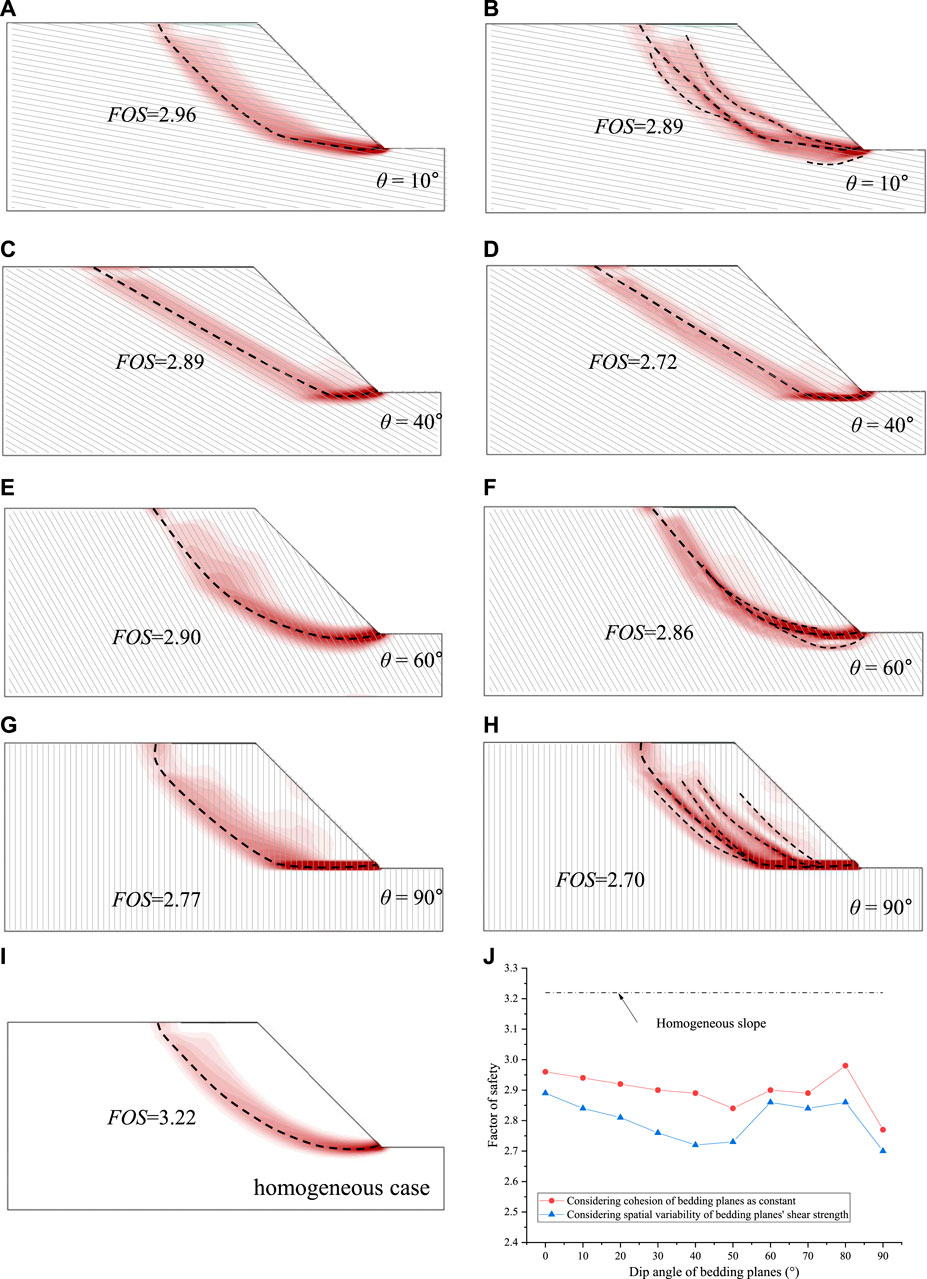
FIGURE 4. Simulation results of slopes. (A), (C), (E), (G) Slope cases with constant shear strength parameters and different dip angles of bedding planes. (B), (D), (F), (H) Slope cases with random shear strength parameters and different dip angles of bedding planes. (J) Homogeneous slope without bedding planes. (I) Safety factor (SF) of all modeled slope cases.
It can also be observed that the failure modes of slopes change with dip angle. When the dip angle of beddings is relatively gentle (i.e.,
Figure 4I presents the simulation results of a homogeneous slope without bedding planes, which exhibits a circular arc sliding surface. The safety factor (SF) of all modeled slope cases was summarized in Figure 4J. It can be seen from Figure 4J that the presence of weak bedding planes has significantly reduced the slope stability compared with the homogenous slope. When the slope is subjected to the same dip angle of bedding planes, the slope cases with the spatial variability of shear strength parameters had lower SFs than those with constant shear strength parameters. With the increase of bedding planes’ dip angle from 0° to 50°, the shape of the sliding surface tends to be controlled by bedding planes, and as a consequence of which the SF gradually decreases; however, when the dip angle of bedding planes exceeds the slope gradient (i.e., from 50° to 90°), the SF would increase with the dipping angle. The lowest SF is obtained when the bedding planes become vertical. This is concluded that the possible tensile crack as well as the fracture failure could reduce its stability.
To examine the influence of dip angles and spatial variability of shear strength parameters of weak bedding planes on the slope stability, a series of direct shear tests were carried out, based on the results of which several numerical simulations of slopes were conducted. The main obtained results are as follows:
1. Twelve strongly weathered slates samples with weak bedding planes were randomly collected from a field slope in Guizhou province of China. The strength parameters of weak bedding planes were reported through direct shear tests. The obtained results indicated the existence of variability of shear strength parameters.
2. For the strongly weathered slate slopes with bedding planes, numerical studies with the ubiquitous-joint model revealed that the predicted results by models accounting for the spatial variability of the shear strength of the weak planes tend to be more in line with those of the actual rock mass in engineering practices.
3. As the dip angle of bedding planes increases, the shape of the sliding surface changes from circular mode to a mixed mode of circular and planner. When the dip angle of planes is relatively low (or high), the weak planes usually determine the lower (or upper) part of the sliding surface. In the case of vertical bedding planes, toppling or bending failure may be occurred, reducing the safety factor.
4. The safety factors would reduce by incorporating the spatial variability of weak planes’ shear strength into the stability analysis. Additionally, the sliding surface can be replaced by a sliding band comprising multiple sets of sliding paths.
The original contributions presented in the study are included in the article/Supplementary Material, further inquiries can be directed to the corresponding author.
All authors listed have made a substantial, direct, and intellectual contribution to the work and approved it for publication.
The authors declare that the research was conducted in the absence of any commercial or financial relationships that could be construed as a potential conflict of interest.
All claims expressed in this article are solely those of the authors and do not necessarily represent those of their affiliated organizations, or those of the publisher, the editors and the reviewers. Any product that may be evaluated in this article, or claim that may be made by its manufacturer, is not guaranteed or endorsed by the publisher.
This work was supported by National Natural Science Foundation of China (51708199; 51609070), Science and Technology Infrastructure Program of Guizhou Province (2020-4Y047), and Fundamental Research Funds for the Central Universities (531107050969). All these financial supports were acknowledged.
1. Pinheiro Branco L, Topa Gomes A, Silva Cardoso A, Santos Pereira C. Natural Variability of Shear Strength in a Granite Residual Soil from Porto. Geotech Geol Eng (2014) 32(4):911–22. doi:10.1007/s10706-014-9768-1
2. Ip SCY, Satyanaga A, Rahardjo H. Spatial Variation of Shear Strength Properties Incorporating Auxiliary Variables. Catena (2021) 200. doi:10.1016/j.catena.2021.105196 https://www.sciencedirect.com/science/article/abs/pii/S0341816221000552?via%3Dihub.
3. Cai J-S, Yan E-C, Yeh T-CJ, Zha Y-Y, Liang Y, Huang S-Y, et al. Effect of Spatial Variability of Shear Strength on Reliability of Infinite Slopes Using Analytical Approach. Comput Geotechnics (2017) 81:77–86. doi:10.1016/j.compgeo.2016.07.012
4. Jiang S-H, Huang J, Huang F, Yang J, Yao C, Zhou C-B. Modelling of Spatial Variability of Soil Undrained Shear Strength by Conditional Random fields for Slope Reliability Analysis. Appl Math Model (2018) 63:374–89. doi:10.1016/j.apm.2018.06.030
5. Qi X-H, Li D-Q. Effect of Spatial Variability of Shear Strength Parameters on Critical Slip Surfaces of Slopes. Eng Geology (2018) 239:41–9. doi:10.1016/j.enggeo.2018.03.007
6. Nguyen TS, Likitlersuang S, Ohtsu H, Kitaoka T. Influence of the Spatial Variability of Shear Strength Parameters on Rainfall Induced Landslides: a Case Study of sandstone Slope in Japan. Arabian J Geosciences (2017) 10–16. doi:10.1007/s12517-017-3158-y
7. Fenton GA, Vanmarcke EH. Spatial Variation in Liquefaction Risk. Géotechnique (1998) 48(6):819–31. doi:10.1680/geot.1998.48.6.819
Keywords: shear strength, spatial variability, slope stability, weak bedding planes, sliding arc
Citation: Zhou S-H, Zhou S-K, Zhang J-C and Tan X (2021) Effect of Bedding Orientation and Spatial Variability of Stratification Shear Strength on Stability of Transversely Isotropic Rock Slope. Front. Phys. 9:777216. doi: 10.3389/fphy.2021.777216
Received: 15 September 2021; Accepted: 27 September 2021;
Published: 14 October 2021.
Edited by:
Chun Zhu, Hohai University, ChinaReviewed by:
Wei Chen, Central South University, ChinaCopyright © 2021 Zhou, Zhou, Zhang and Tan. This is an open-access article distributed under the terms of the Creative Commons Attribution License (CC BY). The use, distribution or reproduction in other forums is permitted, provided the original author(s) and the copyright owner(s) are credited and that the original publication in this journal is cited, in accordance with accepted academic practice. No use, distribution or reproduction is permitted which does not comply with these terms.
*Correspondence: Xin Tan, eGludGFuQGhudS5lZHUuY24=
Disclaimer: All claims expressed in this article are solely those of the authors and do not necessarily represent those of their affiliated organizations, or those of the publisher, the editors and the reviewers. Any product that may be evaluated in this article or claim that may be made by its manufacturer is not guaranteed or endorsed by the publisher.
Research integrity at Frontiers
Learn more about the work of our research integrity team to safeguard the quality of each article we publish.