- 1School of Computer and Information Science, Southwest University, Chongqing, China
- 2Department of Computer Science, Hong Kong Baptist University, Kowloon, Hong Kong, SAR, China
Identifying multiple influential spreaders, which relates to finding k (k > 1) nodes with the most significant influence, is of great importance both in theoretical and practical applications. It is usually formulated as a node-ranking problem and addressed by sorting spreaders’ influence as measured based on the topological structure of interactions or propagation process of spreaders. However, ranking-based algorithms may not guarantee that the selected spreaders have the maximum influence, as these nodes may be adjacent, and thus play redundant roles in the propagation process. We propose three new algorithms to select multiple spreaders by taking into account the dispersion of nodes in the following ways: (1) improving a well-performed local index rank (LIR) algorithm by extending its key concept of the local index (an index measures how many of a node’s neighbors have a higher degree) from first-to second-order neighbors; (2) combining the LIR and independent set (IS) methods, which is a generalization of the coloring problem for complex networks and can ensure the selected nodes are non-adjacent if they have the same color; (3) combining the improved second-order LIR method and IS method so as to make the selected spreaders more disperse. We evaluate the proposed methods against six baseline methods on 10 synthetic networks and five real networks based on the classic susceptible-infected-recovered (SIR) model. The experimental results show that our proposed methods can identify nodes that are more influential. This suggests that taking into account the distances between nodes may aid in the identification of multiple influential spreaders.
1 Introduction
Many real-world problems involve the identification of multiple influential nodes in complex networks, such as finding a few individuals who are critical to the spread of information on the internet, or who may speed up the transmission process of pestilence in crowds once infected [1]. The problem of identifying multiple influential nodes differs from that of discovering the most influential nodes. The latter refers to finding the k (k > 1) most influential spreaders, which is commonly addressed by ranking the influence of individual nodes. The former involves the identification of a set of k nodes with the maximum influence as a whole. That is, identifying multiple influential nodes should take into account the different roles that nodes play in the propagation process rather than just evaluating their individual influence [2].
Methods to identify multiple influential spreaders fall in three categories. The first regards this as an influence maximization (IM) problem. Some well-known methods include the greedy [3], new greedy [4], community-based greedy [5], k-medoid [6], two-phase influence maximization [7], and collective influence [8] algorithms. However, as the IM problem is NP-hard, these algorithms are challenged by increasing network sizes, and thus are not applicable to huge real networks.
Methods in the second category attempt to identify multiple influential nodes by ranking their influences, which are calculated according to various topology-based centrality measures: 1) classic topological centrality metrics, such as degree centrality [9], betweenness centrality [10], and closeness centrality [10]; 2) centrality measures that take into account multiple (global or local) network features, such as KED centrality [11], efficiency centrality (EC) [12], composite centrality based on analytic hierarchy process [13], and classified neighbors centrality [14]; and 3) local-information-based iterative algorithms such as PageRank [15], LeaderRank [16], and VoteRank [17]. However, the ranking approach may not always find a set of nodes with the maximum influence [18], possibly because they separately measure the influence of each node, and thus omit overlapping effects of topologically adjacent top-ranked nodes.
Algorithms in the third category consider the distance between nodes when evaluating node importance. For instance, the local index rank (LIR) algorithm [19] is based on the local index (LI) value of a node, which represents the number of neighbors whose degree exceeds that of the focus node. Spreaders are selected from nodes whose LI values are 0 (i.e., 0-LI nodes). However, the LIR method cannot avoid some adjacent 0-LI nodes, and sometimes there are not enough 0-LI nodes to be selected as spreaders. Another example is the independent set (IS) algorithm [20], which divides nodes into independent sets by the Welsh-Powell coloring algorithm and selects spreaders in the largest independent set to ensure that selected nodes are non-adjacent. However, special situations may occur, such as not enough spreaders in the largest independent set; meanwhile directly selecting rest spreaders in following independent sets may derogate the advantages brought by independent set.
We propose three methods with different degrees of dispersion to identify multiple spreaders. The first one is LIR-2 method which extends the concept of the local index to second-order neighbors and does not restrict the spreaders’ selection from the 0-LI nodes. By doing so, this method enlarges the distance between the 0-LI nodes and can guarantee to select enough spreaders. The second one is IS-LIR method which hybrids LIR and IS to ensure that nodes in the same independent set are non-adjacent. The third one is IS-LIR-2 method, which hybrids the improved second-order LIR method and IS method so that the selected spreaders are more dispersed. Comparing the proposed three methods with traditional methods for multiple spreader identification on 10 synthetic networks and five real networks based on the SIR propagation model, we find our methods more effective in maximizing the size of the spreading coverage, and that a higher dispersion of the selected multiple spreaders helps to amplify the spreading.
The rest of this paper is organized as follows.Sec. 2 introduces work relating to the identification of multiple influential spreaders. Sec. 3 formalizes the research problem and proposes our method. Sec. 4 describes our experiments, including baseline methods, the SIR propagation model, evaluation metrics, parameter settings for experiments, and datasets. Sec. 5 provides the experimental results and discusses why diversity should be considered when we select a set of influential spreaders. We summarize our work in Sec. 6.
2 Related Work
Identifying a set of influential nodes in a network is important for designing network immunization [21], system control strategy [22] and improving the network robustness [23,24]. Work about multiple spreader identification falls in three categories. The first regards it as an influence maximization problem [3], and thus utilizes optimization algorithms to directly identify a set of spreaders. The greedy algorithm [3] is a classic example. These algorithms are accurate but time-consuming, and thus do not suit large-scale networks. Some researchers employ information about network structures to reduce the time complexity while maintaining the high accuracy of classic optimization algorithms. The NewGreedy algorithm [4] removes edges that do not contribute to propagation, so as to speed up the simulation process. The community-based greedy algorithm (CGA) [5] mines the top-k spreaders from detected communities so as to reduce the running time. Another algorithm [6] constructs an information transfer probability matrix and uses the k-medoid clustering algorithm to find the most centrally located nodes in clusters as spreaders. Two-phase influence maximization (TIM) [7] includes the phases of parameter estimation and node selection to reduce time complexity.
Methods in the second category select the top-ranked spreaders, whose influence is calculated based on network topological information. Classic indicators such as degree centrality [9], betweenness centrality [10], closeness centrality [10], and coreness centrality [25], have been utilized to estimate the influence of spreaders. Some researchers take into account multiple (global or local) network features when measuring the importance of spreaders [26]. For instance, KED centrality [11] combines the number and diversity of paths. Composite centrality based on the analytic hierarchy process (AHP) [13] combines degree, betweenness, and closeness centrality. Classified neighbors centrality (CNC) [14] classifies the neighbors of a focal node into four groups according to the removal order in the process of k-shell decomposition, weights each class differentially, and sums them to characterize the spreading capacity of the node. PageRank [15], LeaderRank [16], and VoteRank [17] all consider the importance of a node itself and its connections with other nodes to identify influential nodes. These rank-based algorithms often have simple forms and low time complexity and can effectively mine a single important node. However, they may not efficiently find multiple important spreaders because they seldom consider interactions between spreaders, i.e., they ignore the overlapping effects of top-ranked nodes if they are topologically adjacent.
Algorithms in the third category attempt to minimize the overlapping effects of spreaders during selection. The SuperNode algorithm [27] uses the Blondel community detection algorithm to get the community division in the network, and selects important nodes from the communities according to size so that the selected nodes have some distance. An independent set (IS)-based partitioned ranking algorithm [20] divides nodes into independent sets by the Welsh-Powell coloring algorithm, then selects the top-ranked nodes in the largest independent set based on certain centrality indicators. The local index rank (LIR) algorithm [19] selects spreaders from nodes with 0-LI values, i.e., those whose direct neighbors have lower degrees than themselves. However, there may not be enough 0-LI nodes to be selected as spreaders in some cases, and the selection of adjacent nodes cannot be avoided. We seek to overcome the above deficiencies by extending LIR methods to two-layer neighbors and integrating them with IS methods.
3 Methods
We formalize the problem of multiple influential spreader identification and propose the LIR-2, IS-LIR, and IS-LIR-2 algorithms, which consider the diversity of nodes to different degrees.
3.1 Formulation of Research Problem
Given a graph G (V, E), where V = {v1, v2, … , vN} denotes the node-set and whose size is N, and E = {e1, e2, … , eM} denotes the edge-set, whose size is M. A method to address the problem of multiple influential node identification can be regarded as a function f (⋅) to select a node subset S ⊆ V with a given k (1 < k < N) nodes, which should have the maximum influence on graph G, i.e.,
3.2 LIR-2 Method
LIR-2 improves on LIR [19], where the local index (LI) of node vi is the number of its first-order neighbors of greater degree, i.e.,
LIR-2 extends the neighbors of node vi from first to second order. The second-order local index LI2 of node vi is defined as
where N(vi) and N (N(vi)) denote the first- and second-order neighbors, respectively, of node vi, Q(x) = 1 when x > 0, and otherwise Q(x) = 0. According to the definition, the LI2 value of node vi is the number of its first- and second-order neighbors of greater degree.
The LIR-2 method sorts nodes by LI2 values within degrees, and selects those of top rank as spreaders, as described in Algorithm 1.
Algorithm 1. LIR-2
Figures 1A,B illustrate LIR and LIR-2, respectively, on a toy network with 20 nodes and 41 edges. Figure 1C shows a single 0-LI node (node 20). Therefore, 0-LI nodes are insufficient for the selection of multiple spreaders. As LIR-2 is not limited to the selection of top-ranked spreaders from nodes with 0 LI2 values, they can select spreaders as required.
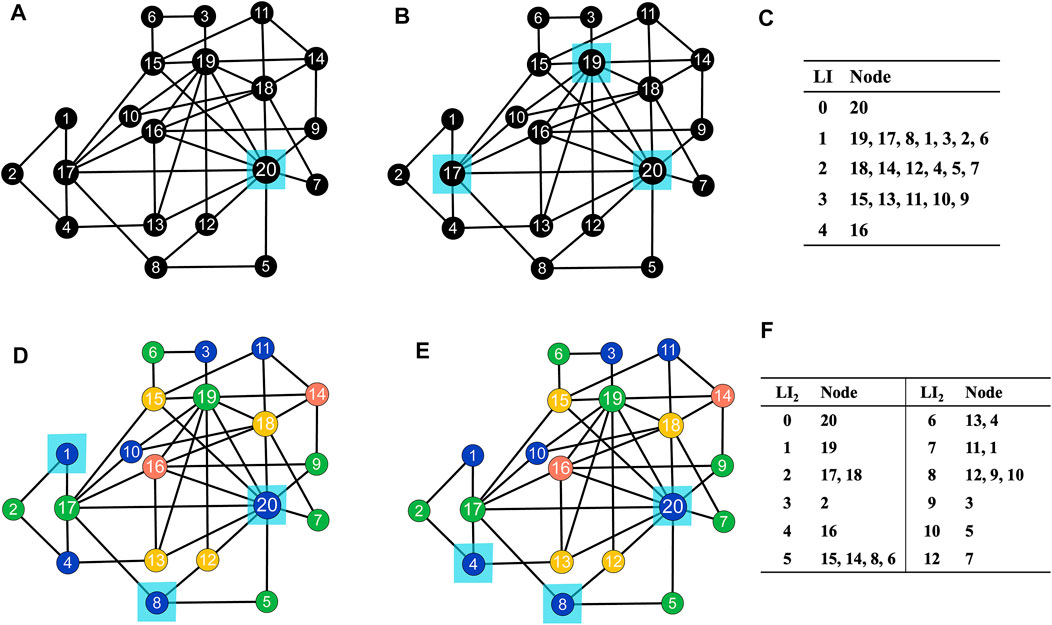
FIGURE 1. Illustrations of LIR [subfigure (A)], LIR-2 [subfigure (B)], IS-LIR [subfigure (D)], and IS-LIR-2 [subfigure (E)] methods on a toy network with 20 nodes and 41 edges. The selected spreaders are highlighted in light blue color. Nodes with different colors in subfigures (D) and (E) belong to different independent sets, which are generated by the Welsh-Powell algorithm. The values of index LI and LI2 of nodes are represented in subfigure (C) and subfigure (F).
3.3 IS-LIR Method
The LIR method cannot avoid the selection of adjacent nodes. We combine LIR with the IS method to ensure that nodes in the same independent set are non-adjacent. The proposed IS-LIR method uses the Welsh-Powell algorithm to divide nodes into different independent sets, then calculates LI for nodes in independent sets that are ranked in descending order. Nodes are selected from the ranked independent sets, one by one, based on the LIR method. The IS-LIR algorithm is outlined in Algorithm 2.
Algorithm 2. IS-LIR
Figure 1D illustrates the IS-LIR method on a toy network as an example, first using the Welsh-Powell algorithm to color all nodes in four colors (blue, green, yellow, and pink). Nodes of the same color constitute independent sets, which are sorted by node size, and nodes are sorted by degree within each independent set. We now have a node list, whose top members are selected as the influential spreaders. For instance, using the IS-SIR method, if we seek three effective spreaders on the toy network, we will select nodes 20, 8, and 1 in the blue set.
3.4 IS-LIR-2 Method
IS-LIR-2 combines IS and LIR-2 to select spreaders from more dispersed candidates. Its process, as shown in Algorithm 3, is similar to that of IS-LIR, but nodes in each independent set are ranked based on LI2 values.
Algorithm 3. IS-LIR-2
Figure 1E illustrates how IS-LIR-2 runs on the toy network. Like the IS-LIR method (Figure 1D), nodes are colored with four colors. Three spreaders, nodes 20, 8, and 4, are selected according to their LI2 values, as shown in Figure 1F.
4 Experiment Settings
We introduce the classic SIR model, which will be utilized to simulate epidemic spreading, and present two evaluation metrics to compare the performance of the proposed methods with eight baseline methods: degree centrality ranking (DC) [9], LIR [19], degree centrality ranking based independent set (IS-DC) [20], eigenvector centrality ranking based independent set (IS-EV) [20], neighborhood centrality ranking based independent set (IS-ND) [20], and VoteRank [17]. We describe the synthetic and real networks used in our experiments, and discuss parameter settings.
4.1 SIR Model
The SIR model classifies each node in a propagation process into the three states of susceptible, infected, and recovered. All nodes are initially susceptible, except a few in infected states. In our simulations, the infected nodes at time step t = 0 are those identified as influential nodes by our proposed methods and the baseline methods for comparisons. At each time step, infected nodes at the end of the previous time step randomly select a neighbor node, which, if susceptible, will be infected with probability μ. All infected nodes recover with probability β. Recovered nodes cannot be infected again, and cannot affect susceptible neighbor nodes. Simulations end when there are no infected nodes in the network.
4.2 Evaluation Metrics
We use two measures to evaluate the performance of our methods in identifying effective influential spreaders. The outbreak size proportion [28] at time step T is
where nR(T) and nI(T) are the numbers of susceptible and infected nodes, respectively, at the end of the time step T, and N is the total number of nodes.
The average shortest path length of the identified spreaders represents the dispersion among them [28], and is defined as
where l (u, v) is the shortest path length between nodes u and v; when |S| = 1, L = 0. A larger L indicates a smaller overlapping neighbor area between nodes in the spreader set.
4.3 Synthetic and Real Networks
To evaluate the effectiveness of our proposed methods in identifying influential spreaders on networks with different topological structures, we compare them with benchmark algorithms on 10 synthetic networks and four real networks. The synthetic networks include three small-world networks generated based on the Watts-Strogtaz (WS) small-world network model [29], four scale-free networks generated based on the
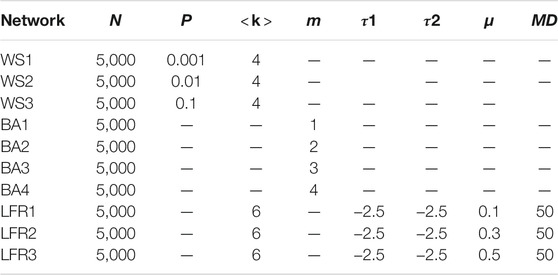
TABLE 1. Key parameter settings in generating synthetic networks. N is the number of nodes; p is a random reconnection probability;
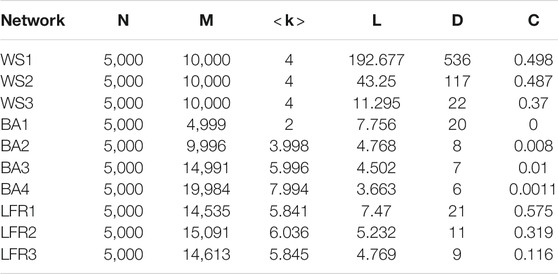
TABLE 2. Topological features of synthetic networks. N is the number of nodes; M is the number of edges;
The five real networks used in this study include a football network [32], a collaboration network [33] between jazz musicians (referred to as jazz network), a contact network between high school students (referred to as high-school network) [34], an email network [35], and a power network [29]. The football network includes United States college Division I football games in 2000, where nodes represent teams, and edges are regular-season games between two connected teams [32]. The jazz network describes collaborations between jazz musicians, where each node represents a jazz musician, and an edge denotes that two musicians have played together in a band. The high-school network shows contacts between high school students in specific classes (called “classes préparatoires” in Lycée Thiers, France). The email network presents email communications at the University Rovira i Virgili in Tarragona, Spain, in 2003. Nodes are users, and each edge represents that at least one email was sent. The power network is a topological representation of the Western States Power Grid in the United States, where an edge denotes a power supply line and a node can be a generator, transformer, or substation. Table 3 summarizes the basic topological features of the five real networks.

TABLE 3. Basic topological features of five real networks. N is the number of nodes; M is the number of edges;
4.4 Parameter Settings
Our experiments based on the SIR model explored the proportion of final outbreak size F (tend) with respect to the effective infected probability λ and proportion of spreaders p. We set the parameter of the recovered probability
We also carried out a sensitivity analysis on the size of the spreader set p, varying it between 0.01 and 0.15, i.e., p ∈ [0.01, 0.15], with a step of 0.01, and the effective infected probability λ was fixed at 2.0.
In addition, we explored the final outbreak size proportion F (tend) while varying the effective infected probability λ, where λ ∈ [1.5, 2.5] with a step of 0.1, and fixed the scales of spreaders at p = 0.08. Results were averaged over 1,000 independent runs.
5 Results and Discussion
We present the experimental results evaluating the proposed methods, and determine whether identified spreaders are effective while varying the infection probability λ. We show the relationships between the dispersion and the effectiveness of influential spreaders identified by our proposed methods and the baseline methods.
Figure 2 displays the final outbreak size F (tend) for different numbers of spreaders (denoted by the proportion of selected spreaders p) identified by different methods based on SIR simulations, and shows that our proposed methods generally outperform the baseline methods on synthetic and real networks. On WS networks, IS-LIR-2 has the largest final outbreak scale on WS1. IS-LIR-2, IS-LIR, and VoteRank perform similarly to or better than other algorithms on WS2 and WS3. On BA networks, the performance of IS-LIR-2 and LIR-2 is superior to the other methods, especially on BA2, BA3, and BA4. On LFR networks, IS-LIR performs better than the other methods, and IS-LIR-2 performs better on LFR2 but not so well on LFR3. In experiments on real networks, IS-LIR and IS-LIR2 could identify more influential spreaders in most cases on almost all five real networks. However, LIR-2 was not significantly superior on real networks except the arenas-email network. LIR-2, IS-LIR, and IS-LIR2 had obvious advantages selecting multiple spreaders in most cases. This implies that to take into account the dispersion of selected nodes can improve performance.
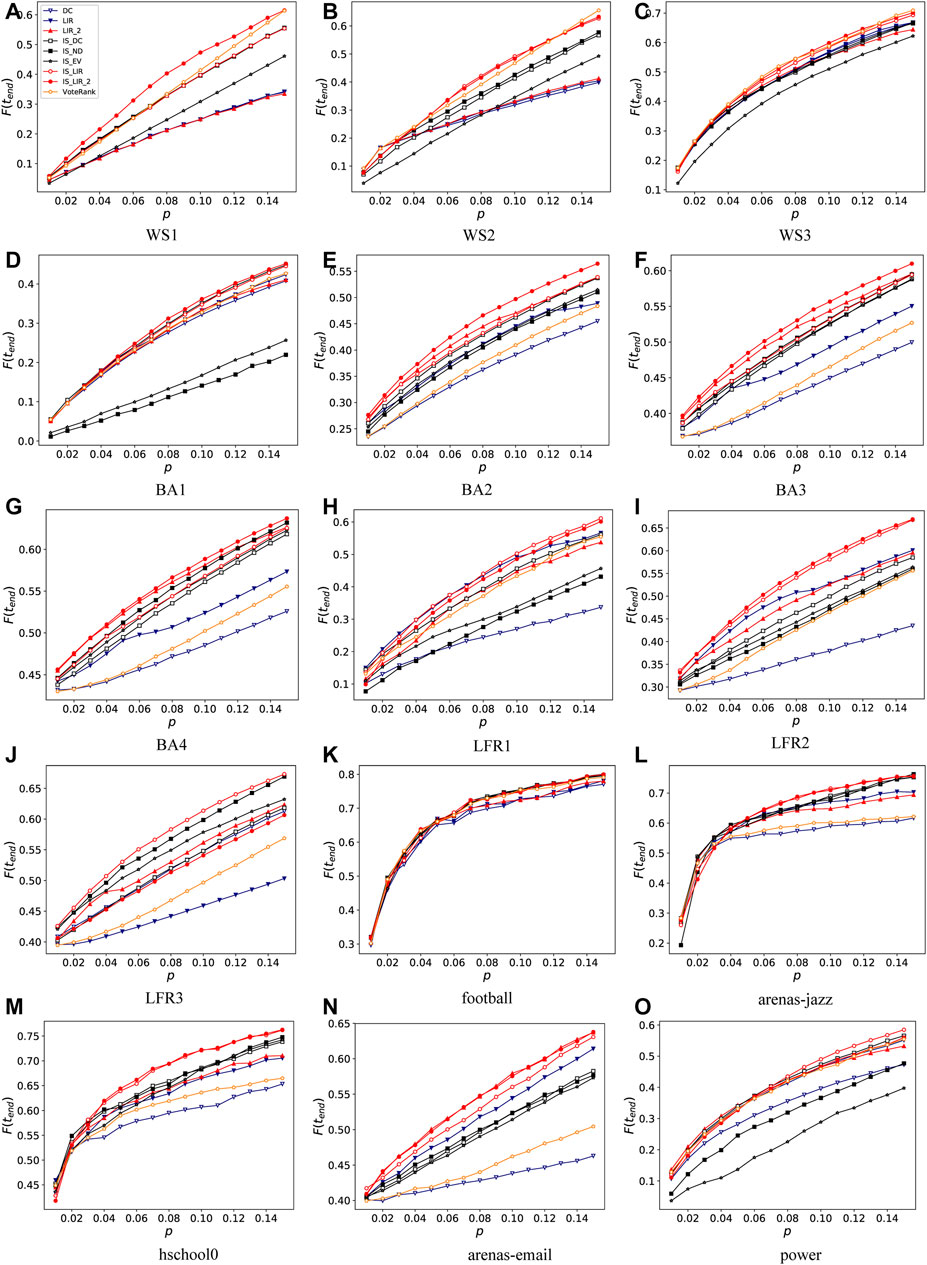
FIGURE 2. Proportion of final outbreak size F (tend) with respect to different proportions p of selected spreaders with respect to nine algorithms on 10 synthetic networks [subfigures (A–J)] and five real networks [subfigures (K–O)]. Infected probability in SIR model is λ = 2.0; SIR recovered probability
As the infected probability in the SIR model is a key parameter that may affect the final break size of infections, we explored the performance (represented by the final outbreak size proportion F (tend)) of our proposed methods with different values of the infected probability λ. As shown in Figure 3, whether λ is small or large, IS-LIR and IS-LIR-2 have significant advantages over baseline methods on most of the synthetic and real networks. Specifically, on WS networks, as the infected rate increases, the performance of IS-LIR-2 increases significantly on WS1 and WS2, and IS-LIR performs best on WS2. On BA networks, IS-LIR-2 and LIR-2 are consistently superior to other algorithms on most BA networks. Focusing on LFR networks, we can see that IS-LIR is always better than the baseline methods except on the LFR2 network, where IS-LIR-2 performs better. On real networks, we can see that IS-LIR and IS-LIR-2 maintain their advantages whether λ is small or large.
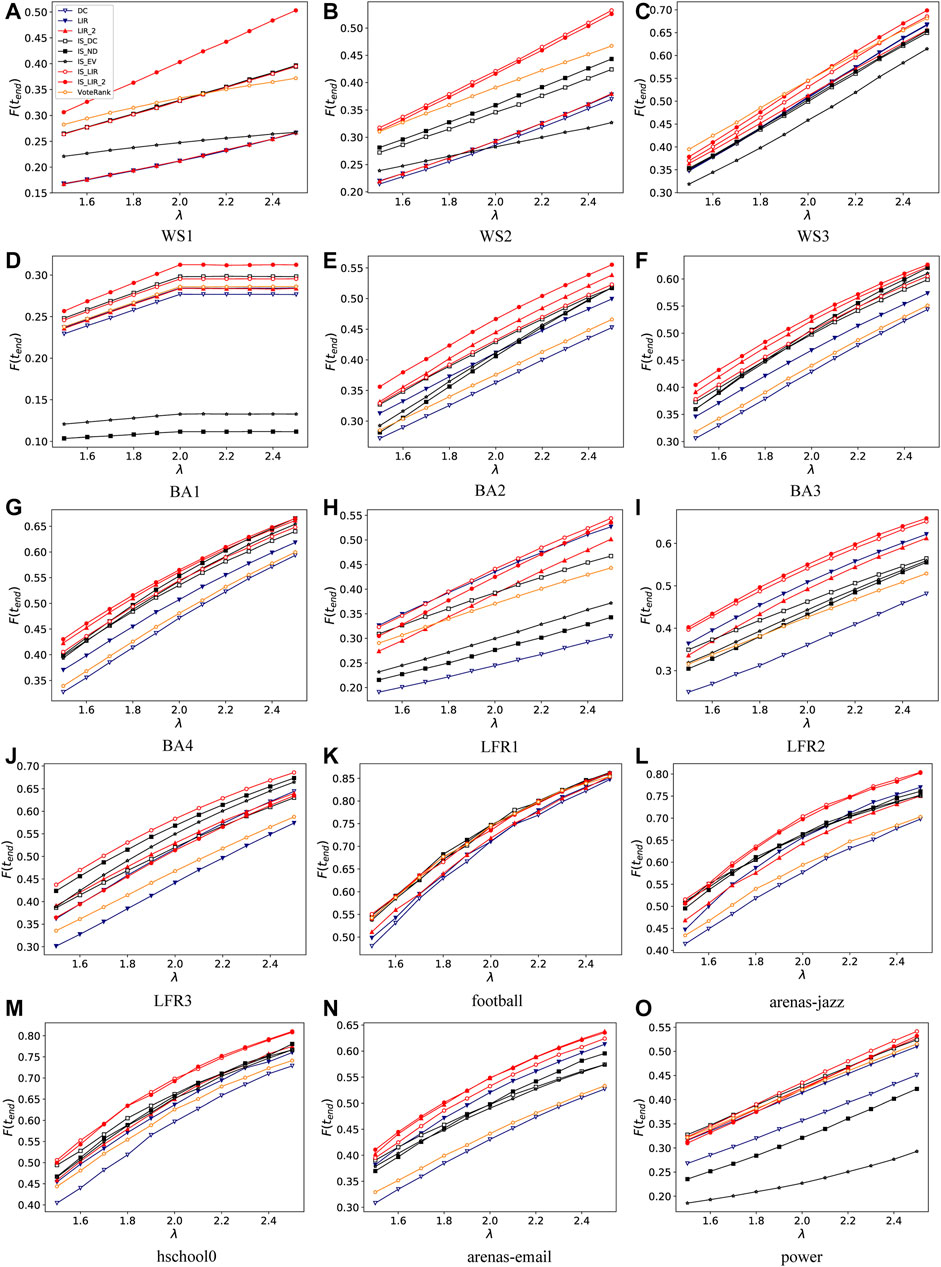
FIGURE 3. Final outbreak size proportion F (tend) at different effective infected probabilities λ with respect to nine algorithms on ten synthetic networks [subfigures (A–J)] and five real networks [subfigures (K–O)]. SIR recovered probability
Figure 4 presents the structural characteristics of influential nodes identified by LIR-2, IS-LIR, and IS-LIR2 and the baseline methods, and shows that spreaders identified by IS-LIR-2, IS-LIR, and LIR-2 have the largest harmonic mean of the average shortest path length L between any two nodes in most cases, except the LFR3 and football networks. On LFR3, multiple spreaders identified by IS-LIR, IS-ND, and IS-EV have the top three average shortest path lengths (as shown in Figure 4J). On the football network, vote-rank and IS-DC identified spreaders with larger average shortest path lengths than our proposed method in a few cases (as shown in Figure 4K). These results may explain why our proposed methods outperform the baseline methods in identifying multiple influential spreaders (as shown in Figure 2): if the identified spreaders have a larger mean shortest path length, they may result in a more heavier infection spreading. This implies that taking into account the dispersion of nodes can help find the most influential spreaders.
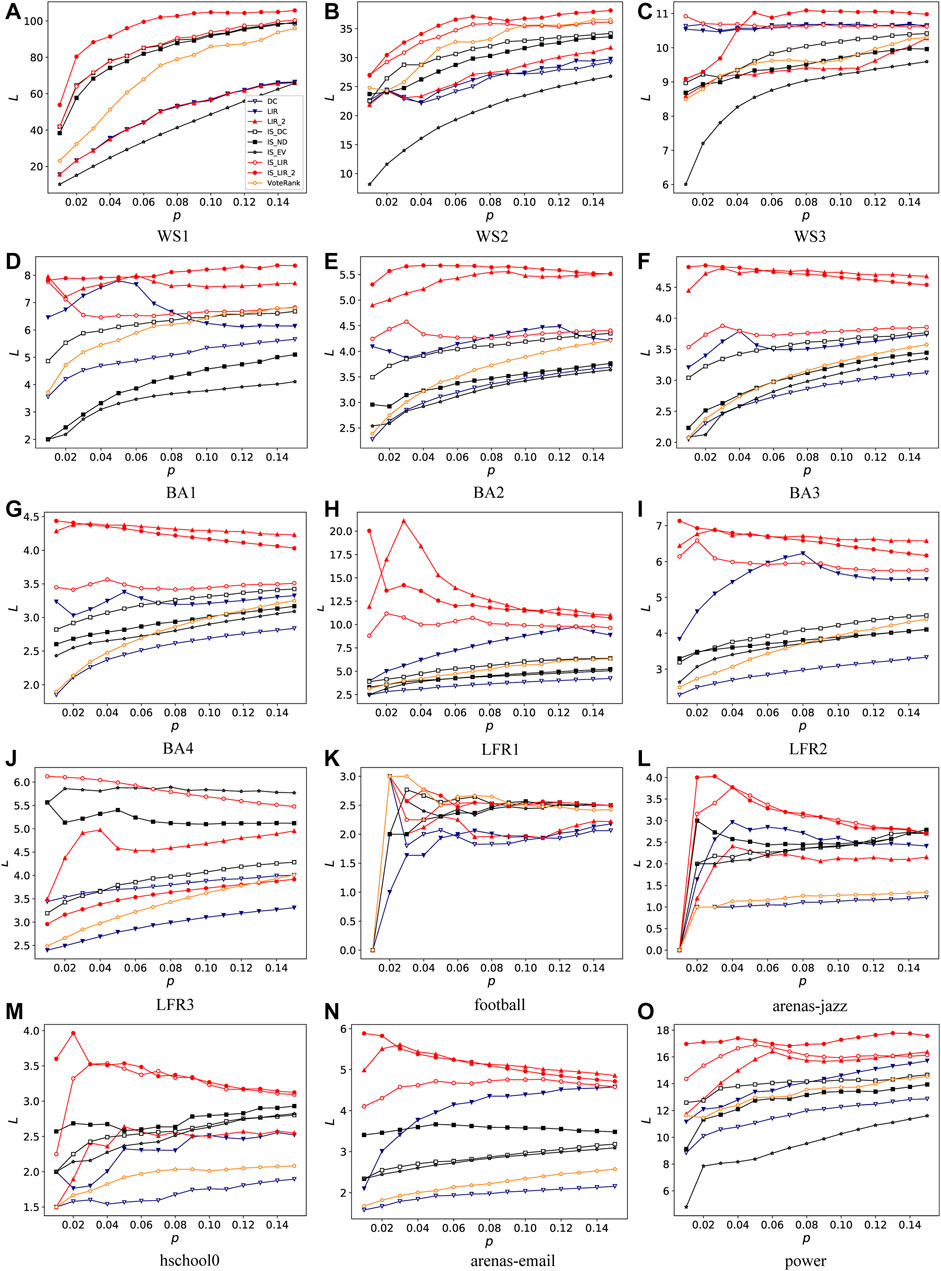
FIGURE 4. Harmonic mean of average shortest path length L between any two nodes with respect to different proportions of multiple spreaders p with respect to nine algorithms on ten synthetic networks [subfigures (A–J)] and five real networks [subfigures (K–O)].
6 Conclusion
To effectively identify a set of influential spreaders is important in infectious disease prevention or information dissemination. To address this problem, inspired by the LIR method [19] and IS method [20], we proposed the LIR-2, IS-LIR, IS-LIR-2 algorithms, which take into account the dispersion of selected spreaders in different ways. In evaluation experiments on 10 synthetic networks and five real networks, our proposed methods, especially IS-LIR and IS-LIR-2, were more effective than six baseline methods at identifying more influential spreaders. One potential reason is that the spreaders found by our methods have a larger average shortest path length, i.e., the selected spreaders are more dispersed, so as to reduce the opportunity to infect the same nodes in the propagation process. IS-LIR, LIR-2, and IS-LIR-2 achieved a good balance between expanding the final spreading range of the spreaders on the SIR model and increasing the topological distance between them. However, we merely studied static, undirected, and unweighted networks. How to extend our methods to other types of networks, and how to investigate their sensitivity to specific network characteristics are two interesting questions to be addressed in future work.
Data Availability Statement
The data used in the study are all available via the cited references, further inquiries can be directed to the corresponding author.
Author Contributions
Proposed and implemented algorithms: LT, ML, and LL. Performed the experiments: LT, ML, and LL. Wrote the paper: LT, ML, ZZ, and LL.
Funding
This work is supported by National Natural Science Foundation of China (No. 61976181) and Fundamental Research Funds for the Central Universities (XDJK2019C122).
Conflict of Interest
The authors declare that the research was conducted in the absence of any commercial or financial relationships that could be construed as a potential conflict of interest.
Publisher’s Note
All claims expressed in this article are solely those of the authors and do not necessarily represent those of their affiliated organizations, or those of the publisher, the editors and the reviewers. Any product that may be evaluated in this article, or claim that may be made by its manufacturer, is not guaranteed or endorsed by the publisher.
References
1. Su Z, Gao C, Liu J, Jia T, Wang Z, Kurths J. Emergence of Nonlinear Crossover under Epidemic Dynamics in Heterogeneous Networks. Phys Rev E (2020) 102:052311. doi:10.1103/PhysRevE.102.052311
2. Gao C, Su Z, Liu J, Kurths J. Even central Users Do Not Always Drive Information Diffusion. Commun ACM (2019) 62:61–7. doi:10.1145/3224203
3. Kempe D, Kleinberg J, Tardos É. Maximizing the Spread of Influence through a Social Network. In: Proceedings of the Ninth ACM SIGKDD International Conference on Knowledge Discovery and Data Mining-KDD ’03; 2003 August 24–27; Washington, D.C. New York, NY, USA (2003). p. 137–46. doi:10.1145/956750.956769
4. Chen W, Wang Y, Yang S. Efficient Influence Maximization in Social Networks. In: Proceedings of the 15th ACM SIGKDD International Conference on Knowledge Discovery and Data Mining-KDD ’09; 2009 June 28–July 1; Paris, France. New York, NY, USA (2009). p. 199–208. doi:10.1145/1557019.1557047
5. Wang Y, Cong G, Song G, Xie K. Community-based Greedy Algorithm for Mining Top-K Influential Nodes in mobile Social Networks. In: Proceedings of the 16th ACM SIGKDD International Conference on Knowledge Discovery and Data Mining KDD ’10; 2010 July 24–28; Washington, D.C. New York, NY, USA (2010). p. 1039–48. doi:10.1145/1835804.1835935
6. Zhang X, Zhu J, Wang Q, Zhao H. Identifying Influential Nodes in Complex Networks with Community Structure. Knowledge-Based Syst (2013) 42:74–84. doi:10.1016/j.knosys.2013.01.017
7. Tang Y, Xiao X, Shi Y. Influence Maximization. In: Proceedings of the 2014 ACM SIGMOD International Conference on Management of Data SIGMOD ’14; 2014 June 22–27; Snowbird, UT. New York, NY, USA (2014). p. 75–86. doi:10.1145/2588555.2593670
8. Morone F, Makse HA. Influence Maximization in Complex Networks through Optimal Percolation. Nature (2015) 524:65–8. doi:10.1038/nature14604
9. Bonacich P. Factoring and Weighting Approaches to Status Scores and Clique Identification. J Math Sociol (1972) 2:113–20. doi:10.1080/0022250X.1972.9989806
10. Freeman LC. Centrality in Social Networks Conceptual Clarification. Social Networks (1978) 1:215–39. doi:10.1016/0378-8733(78)90021-7
11. Chen D-B, Xiao R, Zeng A, Zhang Y-C. Path Diversity Improves the Identification of Influential Spreaders. EPL (2014) 104:68006. doi:10.1209/0295-5075/104/68006
12. Wang S, Du Y, Deng Y. A New Measure of Identifying Influential Nodes: Efficiency Centrality. Commun Nonlinear Sci Numer Simul (2017) 47:151–63. doi:10.1016/j.cnsns.2016.11.008
13. Bian T, Hu J, Deng Y. Identifying Influential Nodes in Complex Networks Based on AHP. Phys A: Stat Mech Appl (2017) 479:422–36. doi:10.1016/j.physa.2017.02.085
14. Li C, Wang L, Sun S, Xia C. Identification of Influential Spreaders Based on Classified Neighbors in Real-World Complex Networks. Appl Maths Comput (2018) 320:512–23. doi:10.1016/j.amc.2017.10.001
15. Brin S, Page L. The Anatomy of a Large-Scale Hypertextual Web Search Engine. Comput Networks ISDN Syst (1998) 30:107–17. doi:10.1016/S0169-7552(98)00110-X
16. Lü L, Zhang Y-C, Yeung CH, Zhou T. Leaders in Social Networks, the Delicious Case. PLoS One (2011) 6:e21202–9. doi:10.1371/journal.pone.0021202
17. Zhang J-X, Chen D-B, Dong Q, Zhao Z-D. Identifying a Set of Influential Spreaders in Complex Networks. Sci Rep (2016) 6:27823. doi:10.1038/srep27823
18. Gu J, Lee S, Saramäki J, Holme P. Ranking Influential Spreaders Is an Ill-Defined Problem. EPL (2017) 118:68002. doi:10.1209/0295-5075/118/68002
19. Liu D, Jing Y, Zhao J, Wang W, Song G. A Fast and Efficient Algorithm for Mining Top-K Nodes in Complex Networks. Sci Rep (2017) 7:43330. doi:10.1038/srep43330
20. Zhao X-Y, Huang B, Tang M, Zhang H-F, Chen D-B. Identifying Effective Multiple Spreaders by Coloring Complex Networks. EPL (2015) 108:68005. doi:10.1209/0295-5075/108/68005
21. Li S, Zhao D, Wu X, Tian Z, Li A, Wang Z. Functional Immunization of Networks Based on Message Passing. Appl Maths Comput (2020) 366:124728. doi:10.1016/j.amc.2019.124728
22. Yu D, Long J, Chen CLP, Wang Z. Adaptive Swarm Control within Saturated Input Based on Nonlinear Coupling Degree. IEEE Trans Syst Man Cybern Syst (2021) 1–12. doi:10.1109/TSMC.2021.3102587
23. Gao C, Fan Y, Jiang S, Deng Y, Liu J, Li X. Dynamic Robustness Analysis of a Two-Layer Rail Transit Network Model. IEEE Trans Intell Transport Syst (2021) 1–16. doi:10.1109/TITS.2021.3058185
24. Li S, Lu D, Wu X, Han W, Zhao D. Enhancing the Power Grid Robustness against Cascading Failures under Node-Based Attacks. Mod Phys Lett B (2021) 35:2150152. doi:10.1142/s0217984921501529
25. Kitsak M, Gallos LK, Havlin S, Liljeros F, Muchnik L, Stanley HE, et al. Identification of Influential Spreaders in Complex Networks. Nat Phys (2010) 6:888–93. doi:10.1038/nphys1746
26. Gao C, Zhong L, Li X, Zhang Z, Shi N. Combination Methods for Identifying Influential Nodes in Networks. Int J Mod Phys C (2015) 26:1550067. doi:10.1142/S0129183115500679
27. He J-L, Fu Y, Chen D-B. A Novel Top-K Strategy for Influence Maximization in Complex Networks with Community Structure. PLoS One (2015) 10:e0145283. doi:10.1371/journal.pone.0145283
28. Sun H-l., Chen D-b., He J-l., Ch’ng E. A Voting Approach to Uncover Multiple Influential Spreaders on Weighted Networks. Physica A: Stat Mech its Appl (2019) 519:303–12. doi:10.1016/j.physa.2018.12.001
29. Watts DJ, Strogatz SH. Collective Dynamics of 'small-World' Networks. Nature (1998) 393:440–2. doi:10.1038/30918
30. Barabási A-L, Albert R. Emergence of Scaling in Random Networks. Science (1999) 286:509–12. doi:10.1126/science.286.5439.509
31. Lancichinetti A, Fortunato S, Radicchi F. Benchmark Graphs for Testing Community Detection Algorithms. Phys Rev E (2008) 78:046110. doi:10.1103/PhysRevE.78.046110
32. Girvan M, Newman MEJ. Community Structure in Social and Biological Networks. Proc Natl Acad Sci (2002) 99:7821–6. doi:10.1073/pnas.122653799
33. Gleiser PM, Danon L. Community Structure in Jazz. Advs Complex Syst (2003) 06:565–73. doi:10.1142/S0219525903001067
34. Mastrandrea R, Fournet J, Barrat A. Contact Patterns in a High School: a Comparison between Data Collected Using Wearable Sensors, Contact Diaries and friendship Surveys. PLoS One (2015) 10:e0136497–26. doi:10.1371/journal.pone.0136497
Keywords: identification of multiple influential spreaders, dispersion of nodes, location index rank algorithm, independent set algorithm, susceptible-infected-recovered model
Citation: Tao L, Liu M, Zhang Z and Luo L (2022) Identifying Multiple Influential Spreaders in Complex Networks by Considering the Dispersion of Nodes. Front. Phys. 9:766615. doi: 10.3389/fphy.2021.766615
Received: 29 August 2021; Accepted: 12 November 2021;
Published: 03 January 2022.
Edited by:
Shudong Li, Guangzhou University, ChinaReviewed by:
Jiajin Huang, Beijing University of Technology, ChinaKevin Du, The University of Hong Kong, Hong Kong, SAR China
Copyright © 2022 Tao , Liu , Zhang and Luo . This is an open-access article distributed under the terms of the Creative Commons Attribution License (CC BY). The use, distribution or reproduction in other forums is permitted, provided the original author(s) and the copyright owner(s) are credited and that the original publication in this journal is cited, in accordance with accepted academic practice. No use, distribution or reproduction is permitted which does not comply with these terms.
*Correspondence: Liang Luo , bHVvbGlhbmdAc3d1LmVkdS5jbg==
 Li Tao
  Mutong Liu 2
 Zili Zhang

