
95% of researchers rate our articles as excellent or good
Learn more about the work of our research integrity team to safeguard the quality of each article we publish.
Find out more
ORIGINAL RESEARCH article
Front. Phys. , 25 October 2021
Sec. Optics and Photonics
Volume 9 - 2021 | https://doi.org/10.3389/fphy.2021.761513
This article is part of the Research Topic Nonlinear Optics With Structured Light View all 10 articles
We further numerically study the mid-infrared supercontinuum (SC) and the rare optical rogue wave (ORW) generated by femtosecond pulse pumping in chalcogenide fibers. Specifically, it is shown via ensembles of numerical simulations that the compression of the spectrum by dispersion oscillating fiber (DOF) effectively controls the generation of ORW. A comparison is made between uniform fiber (UF) and DOF, the spectral bandwidth is compressed from 5,800 nm of UF to 2,300 nm of DOF, and the ORW of high peak power is suppressed. In addition, the oscillation amplitude, oscillation period and initial phase of DOF dispersion are further changed. It has been proved that the suppression effect of ORW is the best when the oscillation amplitude is 300 ps2/km, the oscillation period is 0.5 cm and the initial phase is 0. We believe that our research results will provide some enlightenment for controlling the direction of ORW by changing the characteristics of optical fiber, improving the performance of SC.
As is known to all, the mid-infrared supercontinuum (SC) has the advantages of wide spectral band, high radiation power and good spatial coherence. It has been widely used in spectroscopy [1], optical coherence chromatography [2], biomedical [3, 4]. In particular, SC broadening at long wavelength has attracted much attention [5]. Petersen et al. extended the long wavelength side of SC spectra to 7 μm in cascaded fibers with semiconductor lasers in 2016 [6]. Years later, the fluoride fiber was pumped by Martinez using a three-stage power amplifier, and obtained SC spectrum coverage of 1.6–11 μm [7]. Subsequently, the diameter of the fiber was reduced to 13 μm by Wang et al., and pumped the 17 cm fiber with an optical parametric amplifier laser to obtain SC spectra from 1.8 to 15 μm [8].
When the fiber is pumped by pulse, new frequency components can be generated continuously due to the interaction of linear and nonlinear effects, making the output spectrum greatly wider [9–11]. During the SC broadening formation, the velocity dispersion of the basic solitons caused by the decay of the higher order solitons is different due to the modulation instability (MI), and the collision between the solitons leads to optical rogue wave (ORW) [12]. ORW was first observed in nonlinear fiber systems by Solli et al. [13]. The ORW is a kind of low probability event with super high intensity and large redshift produced in the long wave length of SC, which seriously degrade the coherence, stability, and flatness of SC [14–16]. Next, a very weak CW trigger was used by Cheung et al. to enhance and stabilize SC generation [17]. Zhao also proposed the method of seed induced MI to control ORW in the process of mid-infrared SC generation [18]. Soon, high order ORW is studied by choosing appropriate nonlinear coefficients [19]. It is demonstrated that cascaded four wave mixing caused by weak continuous wave trigger can accelerate soliton fission and collision [20]. Therefore, how to effectively control the generation of ORW has become an important research hotspot in the field of nonlinear optics.
The periodic change of dispersion oscillating fiber (DOF) characteristics break the traditional limitation of standard MI in uniform fiber (UF). On the one hand, the MI gain side lobes result from quasi-phase-matching relation in DOF provide additional degree of freedom to control generation of ORW. For instance, Finot observed a spectral sideband splitting into different sub-sidebands in a periodically varying DOF [21]. An analytical model was also established by C. Franois et al. to calculate the parametric gain in DOFs and predict the position of the quasi-phase matched MI sidelobes [22]. Soon afterwards, the longitudinal periodic change of DOF is discussed by Mussot, which provided an additional degree of freedom to the system and led to the generation of multiple MI sideband pairs [23]. On the other hand, the dispersion and nonlinear periodic variation of DOF, which further affects the pulse and ORW generation [24]. Using continuous wave and seed signal to pump DOF by Feng in 2014, and compressed the pulse time domain of 37–21 ps [25]. Sysoliatin proved that ORW in the DOF can be controlled by changing the initial pulse and the fiber modulation period [26]. Except for the above, it is also showed an in-depth investigation of ORWs during picosecond SC generations in DOF [27].
To sum up, it is an effective way to control ORW by controlling the variation of dispersion and nonlinearity in mid-infrared DOF. In this paper, we present the in-depth investigation of ORWs during femtosecond SC generation in chalcogenide DOF. The effects of the DOF on ORW are observed by statistical peak power histogram. Then, the SC is generated by DOF with different oscillation amplitude, oscillation period and initial phase along the fiber length, respectively, and the influence of dispersion parameters on ORW is analyzed in detail.
The evolution of optical pulse in DOF can be described by the nonlinear Schrodinger equation in the following form [28]:
where A (z, t) is the field envelop, τshock = 1/ω0 and ω0 is the center frequency, γ is nonlinear coefficient, z accounts for coordinate along the fiber axis. The loss item α is ignored. Noise is included in the frequency domain through one photon per mode spectral density on each spectral discretization bin, and via the term ΓR which describes thermally driven spontaneous Raman scattering [29, 30]. The numerical simulation method is split-step fast Fourier transformation, and the fixed step size used in the simulation is 0.005 cm βk is the kth-order dispersion coefficient at the center frequency ω0, the group velocity dispersion (GVD) value is a sine function varying with the transmission distance, which has the following form [31]:
where β20 and β21 are the average GVD value and the oscillation amplitude of GVD value, respectively. Λ is the oscillation period along the transmission distance. The initial values are β20 = −144.3 ps2/km, Λ = 0.5 cm,
where fR = 0.115 is fractional contribution of delayed Raman response to nonlinear polarization, hR(t) is Raman response function and the formula is usually expressed as [33]:
where τ1 relates to the phonon oscillation frequency while τ2 defines the characteristic damping time of the network of vibrating atoms, taking the value τ1 = 23.1 fs, τ2 = 195 fs [34].
Based on the nonlinear Schrodinger equation satisfying the optical pulse transmission in DOF, the gain spectrum of MI in DOF is obtained by linear stability analysis. The MI gain of DOF can be approximately expressed as [35]:
where J is Bessel function of first kind, k represents the kth harmonic of the MI gain sideband. Ωk is the frequency detuning of the kth-order MI gain sideband. The MI gain in the anomalous dispersion region of UF is considered as:
Here Ωc = 4γP0/|β20|, which is the maximum frequency shift. P0 is the peak power of pump pulse.
The background material of DOF is chalcogenide glass As2Se3. In 2007, Imahoko et al. have implemented a 6–12 µm mid-infrared femtosecond laser source [36]. In 2016, a fiber laser system was designed to generate pulses with a duration of 100 fs and ultra-wide wavelength tunability in the range of 2–5 µm [37]. In this paper, the mid-infrared stray light obtained by Haakestad et al. is selected as the pump light source [38]. The Gaussian pump pulse (pulse width T0 = 480 fs and center wavelength λ0 = 4,000 nm) is propagating in the DOF. The modulated Gaussian input pulse envelope can be expressed as:
The pulse peak power is selected as 1.224 kW, and the initial phase is 0, the first order MI gain spectrum of the DOF is drawn. Figure 1A corresponds to the MI gain spectrum generated when the oscillation period of DOF is 0.5 cm and the oscillation amplitudes are 100 ps2/km (black), 200 ps2/km (green) and 300 ps2/km (red), respectively, and the MI gain (blue) of the UF is added for comparison. Obviously, the maximum MI gain of UF is 5.6 × 10⁶ km−1, while that of DOF is about 3.3 × 10⁶ km−1. With the increase of oscillation amplitude to 300 ps2/km, the frequency shift corresponding to the maximum MI gain is reduced from 31 THz to 13 THz. When the oscillation amplitude of DOF is 300 ps2/km, the oscillation periods are 0.5 cm (red), 1.5 cm (black) and 3 cm (green), respectively, their MI gain spectrum is shown in Figure 1B, the maximum MI gain of DOF is also about 3.3 × 10⁶ km−1. When the amplitude period increases to 3 cm, the frequency shift corresponding to the maximum MI gain is reduced from 31 THz to 5.5 THz. It can be seen that the MI gain of the fiber with different oscillation amplitude and period is different.
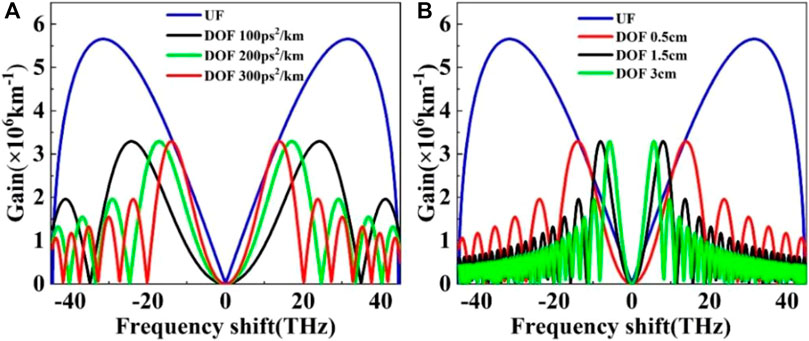
FIGURE 1. (A) MI gain spectra at the output of DOF with different oscillation amplitudes and UF (P0 = 1.224 kW, Λ = 0.5 cm, φ = 0), (B) MI gain spectra at the output of DOF with different oscillation periods and UF (P0 = 1.224 kW, β21 = 300 ps2/km, φ = 0).
In the simulation process, higher-order dispersion to tenth-order and the nonlinear coefficient also change along fiber lengths. The MI gain sidelobe contains the spectral bandwidth of noise, it is beneficial to suppress the generation of ORWs in the SC [39]. The input noise with relatively narrow bandwidth near the seed wavelength is enough to simulate the noise bandwidth of the input field. Therefore, according to the MI gain diagram in Figure 1, the random noise with limited bandwidth of 13 THz and pump pulse amplitude of 0.01% are selected.
The pump power of the pulse is 1.224 kW, the oscillation amplitude is 100 ps2/km, the oscillation period is 0.5 cm and the initial phase is 0. In the case of the different initial input noises, we show the output spectral variation of 500 individual simulations. Mean spectra of DOF at different fiber length has been shown in Figure 2. With the increase of fiber length, the spectral bandwidth becomes wider, but the spectral amplitude decreases gradually. Until the fiber length reaches 40 cm, the spectrum decays to below −20 dB, but the peak energy of the spectrum moves from 5,500 nm to the long wavelength. Therefore, in the next analysis, in order to further explore the influence of dispersion parameters on ORW in the SC, 9 and 20 cm fibers are selected. It can not only guarantee certain SC bandwidth, but also suppress ORW.
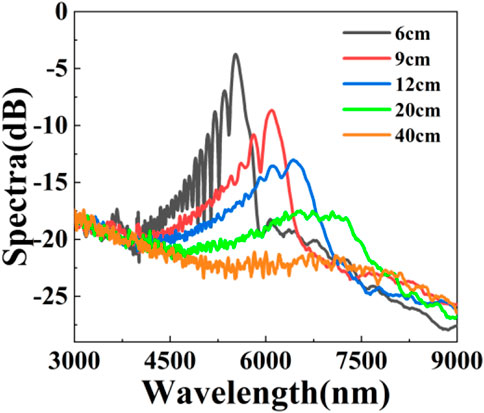
FIGURE 2. Output mean spectra in different length DOFs (P0 = 1.224 kW, β21 = 100 ps2/km, Λ = 0.5 cm, φ = 0).
At present, many scholars believe that the emergence of ORW is random and uncertain, usually by analyzing the probability of peak power to determine the generation of ORW. The characteristic of ORW is that the peak power histogram has a long tailed L-shaped distribution structure [40, 41], which is a low probability, high intensity extreme wave phenomenon generated at a long wavelength [18]. Therefore, in this paper, the long-pass filter is used to select the spectral components above a specific wavelength, perform the inverse Fourier transform on the spectral components, count the peak power histogram in the time domain, and observe whether the long tailed distribution diagram is improved. To determine the control effect of ORW.
Under the condition of 1.224 kW pulse pump power, the oscillation amplitude is 300 ps2/km, the oscillation period is 0.5 cm and the initial phase is 0. Figure 3A shows the SC generation in 9 cm UF. The gray line represents the output spectrum of 500 individual simulations, and the blue line represents the average value of the output spectrum in UF. Figure 3B also shows the output spectra of 500 individual simulations (gray curves) and the mean spectrum (red curves) in 9 cm DOF. Using −20 dB as the standard, it is found that the spectral width of UF is 5,800 nm and that of DOF is 2,300 nm. In Figures 3C,D corresponding detailed spectral evolutions dynamics of a single round trip in UF and DOF along the fiber lengths. The spectral bandwidth of the DOF is much more compressed than that of the UF in long wavelength range. When the fiber length reaches 9 cm, the spectrum of UF and DOF are broadened to the wavelength of 7,200 nm and 6,200 nm. In DOF, the energy transfer occurs when the wavelength is greater than 6,200 nm. A natural idea is that the extreme and rare ORW formed in DOF is suppressed compared with that in UF. In order to verify this conjecture, the statistical histogram of the peak power of the output spectrum (i.e., Raman soliton power) over 7,000 nm in two fibers is calculated, as shown in Figure 3E. Specifically, in UF, the peak power histogram is distributed in a wide range of 200–1000 W, and the probability of 400 W is 0.39. However, the peak power of 700–1000 W almost disappears in DOF, and the maximum probability intensity at 300 W is reduced to 0.33. The overall probability is scattered in a narrow range of 200–600 W, and the statistical histogram is Gaussian distribution. This phenomenon indicates that the probability of ORW in DOF is much smaller than that in UF. It should be noted that the effective suppression of ORW depends on spectral bandwidth compression.
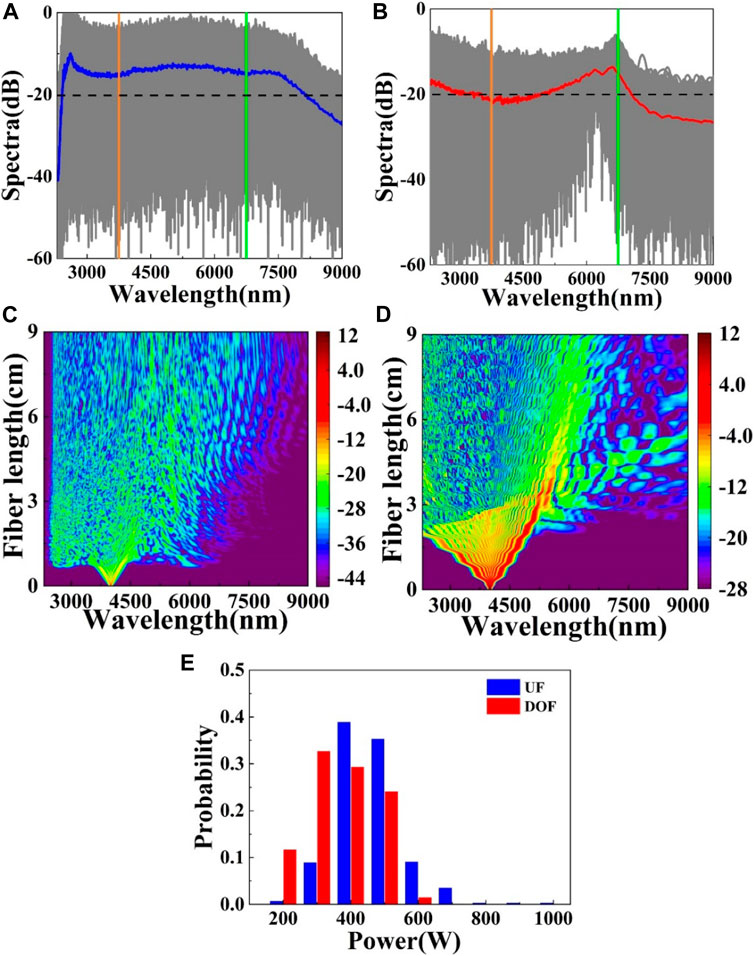
FIGURE 3. Output mean spectra in (A) UF and (B) DOF, (C) and (D) corresponding detailed spectral evolutions dynamics in UF and DOF along the fiber lengths, and (E) the histograms of the peak power beyond 7000 nm [green lines in (A) and (B)]. The yellow lines in (A) and (B) is the pump wavelength 4000 nm (P0 = 1.224 kW, β21 = 300 ps2/km, Λ = 0.5 cm, φ = 0).
Then, before discussing different dispersion variables, let’s see if the pump power has an effect on ORW. When the oscillation amplitude of DOF is 300 ps2/km, the oscillation period is 0.5 cm and the initial phase is 0, the simulation results of the different pump power are depicted in Figure 4A. It is evident that the shape of SC does not change, but the spectral amplitude increases with the increase of pump power. In order to further know the influence of pump power on ORW, the statistical histogram of soliton peak power under different pump power is calculated, as shown in Figure 4B. The results show that as the increase of pump power, the peak power range of soliton pulse gradually increases from 200 - 700 W to 4 - 16 kW, the span range of peak power becomes wider, but the maximum probability intensity decreases from 0.33 to 0.16. When the pump power is 1.224 kW, the peak power is relatively concentrated in the narrow range of 500 W. The disappearance of L-type long tail feature is conducive to the inhibition of ORW. Hence, in the follow-up simulation process, the pump power is still 1.224 kW.
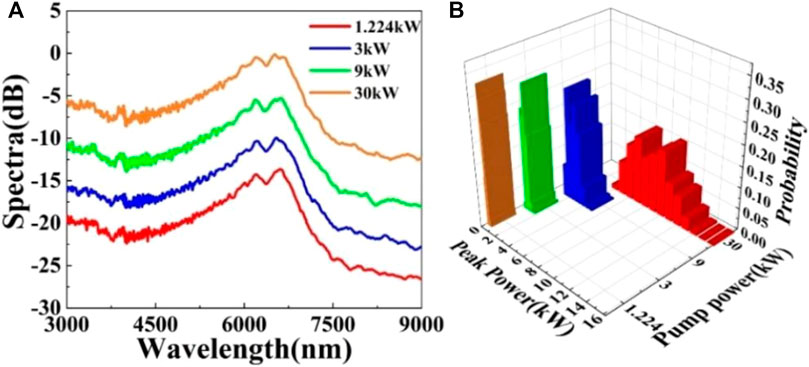
FIGURE 4. (A) Output mean spectra and (B) histograms of the peak power beyond 7,000 nm of the output spectra in DOF with different pump power (β21 = 300 ps2/km, Λ = 0.5 cm, φ = 0).
Next, the pump power is determined as 1.224 kW. The changes of different oscillation amplitudes are considered, and the oscillation amplitudes are 100, 200, and 300 ps2/km, respectively. The oscillation period is set to 0.5 cm and the initial phase is 0. In order to see the variation of dispersion parameters clearly, the variation curve of dispersion with 2 cm DOF is selected and shown in Figure 5A. To further exhibit the relation between ORWs and the distinct types of DOFs, we employ three DOFs with different oscillation amplitude in Figure 5B. As a comparison, it can be found that with −20 dB as the standard, the spectral width is same, about 2,300 nm, but as the increase of the oscillation amplitude, the corresponding long wavelength at −20 dB increases from 6,500 nm to 7,000 nm, the spectral suppression effect at the long wavelength gradually becomes better. In order to better understand the influence of oscillation amplitude on ORW, the peak power of solitons in optical fibers with different oscillation amplitudes is counted, as shown in Figure 5C. The results show that when the amplitude is 100 ps2/km, the power is distributed in a wide range of 200–900 W, and the probability of 400 W is 0.41. As the oscillation amplitude increases to 300 ps2/km, the peak power of 700–900 W disappears, the maximum probability intensity of 300 W gradually decreases to 0.33, and the probability of each peak power disperses in the narrow range of 200–600 W. That is to say, the peak power at the long wavelength decreases, and the long tail of the statistical histogram disappears, so the probability of ORW in SC decreases. In conclusion, when the oscillation amplitude of DOF is large, it can not only ensure a certain SC bandwidth, but also effectively suppress the ORW generation. In the follow-up simulation, the oscillation amplitude of 300 ps2/km is selected.

FIGURE 5. (A) Dispersion curves of DOF, (B) output mean spectra of the DOF, (C) histograms of the peak power beyond 7,000 nm of the output spectra in DOF with different oscillation amplitudes (P0 = 1.224 kW, Λ = 0.5 cm, φ = 0).
Then, the variation of different oscillation periods is considered. The pump power of the pulse is 1.224 kW, the oscillation amplitude is 300 ps2/km and the initial phase is 0. The oscillation period was changed to integer period 0.5, 1.5, 3 cm and non-integer period 6 cm, 7.2 cm, respectively. The variation curve of dispersion with 2 cm DOF is selected, as shown in Figure 6A, it is straightforward that as the oscillation period increases from 0.5 to 7.2 cm, the GVD parameter tends to be flat with the increase of fiber length. Similarly, we carry out an ensemble of 500 individual simulations for each fiber using the parameters mentioned above, and then we can obtain the final output mean spectra in Figure 6B. It is obvious that the suppression of SC is basically same with the change of the integral period, taking −20 dB as the standard, the spectral bandwidth is 2,300 nm. While the non-integral period has a certain influence on the spectrum, in the wavelength range of 8,000 nm–9,000 nm, the spectral intensity is increased by about 1 dB. Furthermore, the corresponding statistical histogram of peak power at wavelength over 7,000 nm is calculated, and integer period and non-integer period histogram are shown in Figures 6C,D. The suppression effect of non-integer period on ORW is poor, the probability of peak power of about 400 W is 0.42, the peak power distribution is between 200 and 700 W. Relatively speaking, the integer period has a good suppression effect on ORW, the highest probability intensity of 300 W peak power decreases to 0.34, and the overall probability is relatively evenly distributed between 200 and 600 W, but the suppression effect of integer period is basically the same. As a result, in the following simulation, the oscillation period is still 0.5 cm.
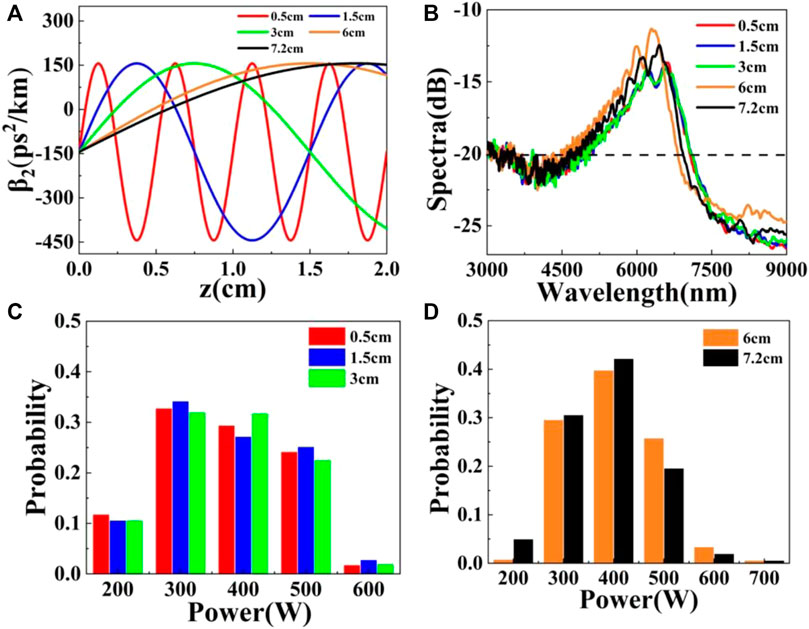
FIGURE 6. (A) Dispersion curves, (B) output mean spectra, (C,D) histograms of the peak power beyond 7,000 nm of the output spectra in DOF with different oscillation periods (P0 = 1.224 kW, β21 = 300 ps2/km, φ = 0).
In order to consider the different initial phases conditions, and initial phase is increased by 0.25π, 0.5π, 1.25π, 1.5π. The pump power of the pulse is 1.224 kW, the oscillation amplitude is 300 ps2/km, the oscillation period is 0.5 cm and the initial phase is 0. The variation curve of dispersion with 1 cm DOF is selected, as revealed in Figure 7A. Due to different initial phases, the dispersion value at the initial position of the fiber is different, and changes periodically with the length of DOF. Figure 7B shows the gain spectrum, it can be found that the suppression of SC is basically the same with the change of the initial phase of the fiber, the spectral width is about 2,300 nm. Homogeneously, the statistical histograms of different phases are shown in Figure 7C, the results show that the probability of each peak power is basically the same, the probability of peak power 300–400 W is the highest, about 0.35, and the peak power distribution is between 200 and 700 W, so to speak, the suppression effect of phase change on ORW is almost the same.

FIGURE 7. (A) Dispersion curves, (B) output mean spectra, (C) histograms of the peak power beyond 7,000 nm of the output spectra in DOF with different initial phases (P0 = 1.224 kW, β21 = 300 ps2/km, Λ = 0.5 cm).
Based on the data presented, an important conclusion can be drawn from the above results. The amplitude of DOF has a significant impact on the suppression of ORW. The greater the amplitude, the better the suppression effect. For changing the oscillation period, the suppression effect of integer period is better than non-integer period, but the suppression effect of different integer period is almost the same. For changing the initial phase, there is no significant difference in the inhibition effect of different phases on ORW. Therefore, based on the previous simulation results, in 9 cm DOF, the best parameters for ORW suppression are oscillation amplitude of 300 ps2/km, oscillation period of 0.5 cm and initial phase of 0.
In order to verify the correctness and universality of the conclusion, we use the above initial conditions, and change different dispersion parameters in 20 cm DOF. Here, we only simulate the spectrum for 100 individual simulations, and count the corresponding peak power histogram over 7,500 nm, as shown in Figure 8. After analyzing the data, the results indicate that the amplitude of DOF increases from 100 ps2/km to 300 ps2/km, as the increase of amplitude, the distribution range of peak power decreases from 150–550 W to 100–400 W, and the maximum intensity of probability concentrates from 0.31 of 250 W to about 0.46 of 200 W. The disappearance of high peak power means that the probability of occurrence of ORW decreases. When the oscillation period and initial phase change, the suppression effect of ORW is no evident distinction, the peak power distribution is about 100–400 W, and the probability of 200 W is as high as 0.46. Therefore, a similar result is observed in 9 cm fiber and 20 cm fiber, which verifies the accuracy of the conclusion.
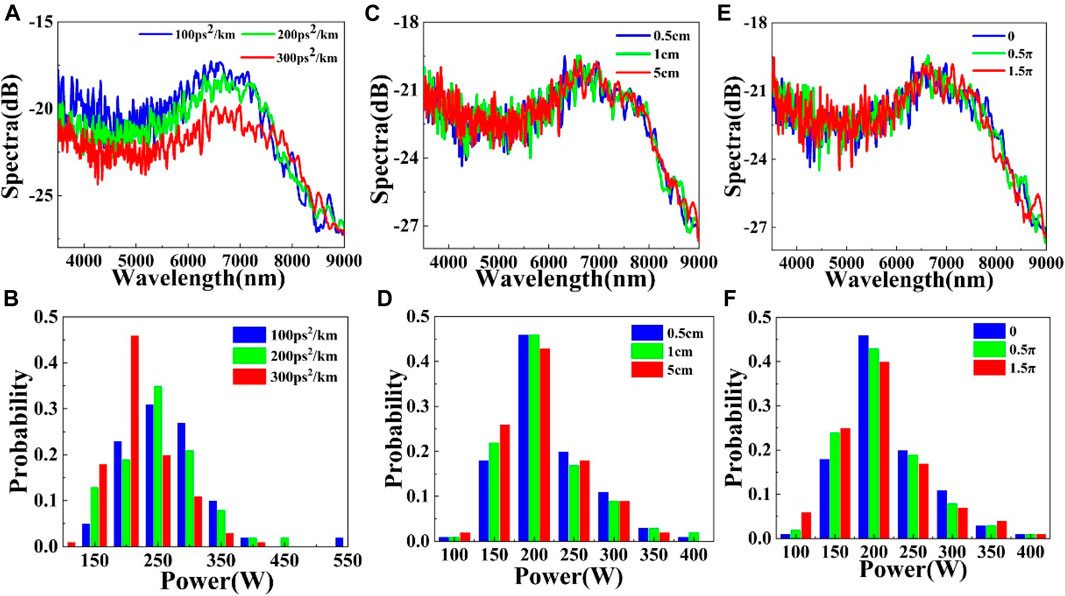
FIGURE 8. (A,C,E) are the average of 100 output spectra, (B,D,F) are the peak power histograms of solitons corresponding to different oscillation amplitudes, periods and initial phases.
In conclusion, the mid-infrared SC and ORW produced by fs pulse pumping chalcogenide fiber are calculated numerically. By comparing 9 cm UF with DOF, the spectral bandwidth of SC is compressed from 5,800 nm to 2,300 nm. The compression of the spectrum by DOF effectively suppresses the generation of ORW and makes the peak power of the output pulse concentrate in a narrow range of 200–600 W. Then, by changing the oscillation amplitude, oscillation period and initial phase of the DOF dispersion, it is found that the variation of the oscillation amplitude of the DOF has a greater influence on the ORW, while the oscillation period and initial phase have no obvious influence on the ORW. The similar conclusion is also obtained in 20 cm DOF. Using the parameters mentions above, it is valid concluded that when the oscillation amplitude is 300 ps2/km, the oscillation period is 0.5 cm and the initial phase is 0, the ORW suppression effect is the best. We believe that this research conclusion will hopefully serve as useful feedback information for control ORW by controlling the characteristics of optical fiber. It will also further ameliorate the performance of SC.
The original contributions presented in the study are included in the article/supplementary material, further inquiries can be directed to the corresponding author.
SL: Conceptualization, Writing—review and editing, Formal analysis, Supervision, Funding acquisition. XH: Methodology, Formal analysis, Writing—original draft. JL: Investigation, Writing—original draft. YF: Writing—review and editing, Formal analysis. YX: Conceptualization, Supervision. ZB: Conceptualization, Supervision.
National Science Foundation of China (61805067, 61975050, 62005076, 61905061); Science and Technology Research Project of Hebei Province Higher Education (BJ2018047); Natural Science Foundation of Hebei Province (F2020202069).
The authors declare that the research was conducted in the absence of any commercial or financial relationships that could be construed as a potential conflict of interest.
All claims expressed in this article are solely those of the authors and do not necessarily represent those of their affiliated organizations, or those of the publisher, the editors and the reviewers. Any product that may be evaluated in this article, or claim that may be made by its manufacturer, is not guaranteed or endorsed by the publisher.
1. Kiwanuka SS, Laurila T, Kaminski CF. Sensitive Method for the Kinetic Measurement of Trace Species in Liquids Using Cavity Enhanced Absorption Spectroscopy with Broad Bandwidth Supercontinuum Radiation. Anal Chem (2010) 82(17):7498–501. doi:10.1021/ac1012255
2. Moon S, Kim DY. Ultra-high-speed Optical Coherence Tomography with a Stretched Pulse Supercontinuum Source. Opt Express (2006) 14(24):11575–84. doi:10.1364/oe.14.011575
3. Tu H, Boppart SA. Coherent Fiber Supercontinuum for Biophotonics. Laser Photon Rev (2013) 7:628–45. doi:10.1002/lpor.201200014
4. He J, Miyazaki J, Wang N, Tsurui H, Kobayashi T. Biological Imaging with Nonlinear Photothermal Microscopy Using a Compact Supercontinuum Fiber Laser Source. Opt Express (2015) 23(8):9762–71. doi:10.1364/oe.23.009762
5. Yang L, Li Y, Zhang B, Wu T, Zhao Y, Hou J. 30-W Supercontinuum Generation Based on ZBLAN Fiber in an All-Fiber Configuration. Photon Res (2019) 7(9):1061. doi:10.1364/prj.7.001061
6. Petersen CR, Moselund PM, Petersen C, Møller U, Bang O. Spectral-temporal Composition Matters when Cascading Supercontinua into the Mid-infrared. Opt Express (2016) 24(2):749–58. doi:10.1364/oe.24.000749
7. Martinez RA, Plant G, Guo K, Janiszewski B, Freeman MJ, Maynard RL, et al. Mid-infrared Supercontinuum Generation from 1.6 to >11 μm Using Concatenated Step-index Fluoride and Chalcogenide Fibers. Opt Lett (2018) 43(6):296–9. doi:10.1364/OL.43.000296
8. Wang X, Zhao Z, Wang X, Jiao K, Xue Z, Tian Y, et al. Mid-infrared Supercontinuum Generation in Low-Loss Single-Mode Te-Rich Chalcogenide Fiber. Opt Mater Express (2019) 9(8):3487. doi:10.1364/ome.9.003487
9. Tao Y, Chen S-P. All-fiber High-Power Linearly Polarized Supercontinuum Generation from Polarization-Maintaining Photonic crystal Fibers. High Pow Laser Sci Eng (2019) 7(2):e28. doi:10.1017/hpl.2019.15
10. Wang F, Zhou X, Zhang X, Yan X, Li S, Suzuki T, et al. Mid-infrared Cascaded Stimulated Raman Scattering and Flat Supercontinuum Generation in an As-S Optical Fiber Pump at 2 Μm. Appl Opt (2021) 60(22):6351–6. doi:10.1364/ao.432394
11. Zhao S, Yang H, Huang Y, Xiao Y. Generation of Tunable Ultra-short Pulse Sequences in a Quasi-Discrete Spectral Supercontinuum by Dark Solitons. Opt Express (2019) 27(16):23539–48. doi:10.1364/oe.27.023539
12. Zhao S, Yang H, Chen N, Zhao C. Controlled Generation of High-Intensity Optical Rogue Waves by Induced Modulation Instability. Sci Rep (2017) 7(1):39926. doi:10.1038/srep39926
13. Solli DR, Ropers C, Koonath P, Jalali B. Optical Rogue Waves. Nature (2007) 450(7172):1054–7. doi:10.1038/nature06402
14. Liu L, Nagasaka K, Suzuki T, Ohishi Y. Mid-infrared Rogue Wave Generation in Chalcogenide Fibers. In: Proceedings of the SPIE; February 2017; San Francisco, California (2017). p. 369–75.
15. Song YF, Wang ZH, Wang C, Panajotov K. Recent Progress on Optical Rogue Waves in Fiber Lasers: Status, Challenges, and Perspectives. Adv Photon (2020) 2(2):1. doi:10.1117/1.ap.2.2.024001
16. Xu J, Wu J, Ye J, Song J, Yao B, Zhang H, et al. Optical Rogue Wave in Random Fiber Laser. Photon Res (2020) 8(1):1. doi:10.1364/prj.8.000001
17. Cheung KKY, Zhang C, Zhou Y, Wong KKY, Tsia KK. Manipulating Supercontinuum Generation by Minute Continuous Wave. Opt Lett (2011) 36(2):160–2. doi:10.1364/ol.36.000160
18. Zhao SL, Yang H, Xiao YZ. Effects of a Seed Pulse on Rogue-Wave Formation for Midinfrared Supercontinuum Generation in Chalcogenide Photonic crystal Fibers. Phys Rev A (2018) 98(4):043817. doi:10.1103/physreva.98.043817
19. Yang Z, Zhong W-P, Belić M, Zhang Y. Controllable Optical Rogue Waves via Nonlinearity Management. Opt Express (2018) 26(6):7587–97. doi:10.1364/oe.26.007587
20. Zhou R, Huang R, Li Q, Fu HY. Raman Soliton at 2 μm in Picosecond Pumped Supercontinuum by a Weak CW Trigger. Opt Express (2019) 27(9):12976–86. doi:10.1364/oe.27.012976
21. Finot C, Feng F, Chembo Y, Wabnitz S. Gain Sideband Splitting in Dispersion Oscillating Fibers. Opt Fiber Tech (2014) 20(5):513–9. doi:10.1016/j.yofte.2014.06.003
22. Franois C, Alexandre K, Matteo C, Gilbert M, Arnaud M. Modulation Instability in Amplitude Modulated Dispersion Oscillating Fibers. Opt Express (2015) 23(4):3869–75. doi:10.1364/OE.23.003869
23. Mussot A, Conforti M, Trillo S, Copie F, Kudlinski A. Modulation Instability in Dispersion Oscillating Fibers. Adv Opt Photon (2018) 10(1):1. doi:10.1364/aop.10.000001
24. Gochelashvili KS, Konyukhov AI, Melnikov LA, Salganskii MY, Sysoliatin AA. Controlled Generation of Optical Rogue Waves in Dispersion Oscillating Fiber. In: Proceedings of the SPIE LASE; February 2016; San Francisco, California (2016). p. 331–7. doi:10.1117/12.2212349
25. Sysoliatin A, Feng F, Chembo YK, Fatome J, Wabnitz S, Finot C. Wavelength Conversion and Temporal Compression of a Pulse Train Using a Dispersion Oscillating Fibre. Electron Lett (2014) 50(10):768–70. doi:10.1049/el.2014.0627
26. Sysoliatin AA, Gochelashvili KS, Konyukhov AI, Melnikov LA, Stasyuk VA. All-optical Fiber Soliton Processing Using Dispersion Oscillating Fiber. Laser Phys Lett (2020) 17(6):065105. doi:10.1088/1612-202x/ab8472
27. He Y, Wang S, Yang A, Zeng X. Dynamics of Optical Rogue Wave Generation in Dispersion Oscillating Fibers. Opt Express (2020) 28(14):19877–86. doi:10.1364/oe.394002
28. Dudley JM, Genty G, Coen S. Supercontinuum Generation in Photonic crystal Fiber. Rev Mod Phys (2006) 78(4):1135–84. doi:10.1103/revmodphys.78.1135
29. Zhao S, Yang H, Zhao C, Xiao Y. Harnessing Rogue Wave for Supercontinuum Generation in Cascaded Photonic crystal Fiber. Opt Express (2017) 25(7):7192. doi:10.1364/oe.25.007192
30. Genty G, Dudley JM, Eggleton BJ. Modulation Control and Spectral Shaping of Optical Fiber Supercontinuum Generation in the Picosecond Regime. Appl Phys B (2009) 94(2):187–94. doi:10.1007/s00340-008-3274-1
31. Conforti M, Trillo S, Kudlinski A, Mussot A. Multiple Qpm Resonant Radiations Induced by Mi in Dispersion Oscillating Fibers. IEEE Photon Technol Lett (2016) 28(7):740–3. doi:10.1109/lpt.2015.2507190
32. Wang XY, Li SG, Liu S, Yin GB, Li JS. Generation of a Mid-infrared Broadband Polarized Supercontinuum in As2Se3 Photonic crystal Fibers. Chin Phys B (2012) 21(5):344–51. doi:10.1088/1674-1056/21/5/054220
34. Ung B, Skorobogatiy M. Chalcogenide Microporous Fibers for Linear and Nonlinear Applications in the Mid-infrared. Opt Express (2010) 18(8):8647–59. doi:10.1364/oe.18.008647
35. Finot C, Wabnitz S. Influence of the Pump Shape on the Modulation Instability Process Induced in a Dispersion-Oscillating Fiber. J Opt Soc Am B (2015) 32(5):892–9.
36. Imahoko T, Takasago K, Sumiyoshi T, Sekita H, Takahashi K, Obara M. Tunable Mid-infrared, High-Energy Femtosecond Laser Source for Glyco-Protein Structure Analysis. Appl Phys B (2007) 87(4):629–34. doi:10.1007/s00340-007-2657-z
37. Anashkina EA, Andrianov AV, Dorofeev VV, Kim AV. Toward a Mid-infrared Femtosecond Laser System with Suspended-Core Tungstate-Tellurite Glass Fibers. Appl Opt (2016) 55(17):4522. doi:10.1364/ao.55.004522
38. Haakestad MW, Fonnum H, Arisholm G, Lippert E, Stenersen K. Mid-infrared Optical Parametric Oscillator Synchronously Pumped by an Erbium-Doped Fiber Laser. Opt Express (2010) 18(24):25379–88. doi:10.1364/oe.18.025379
39. Zeng XL, He Y, Wang SF, Yang A. Optical Rogue Wave Manipulations in Dispersion Oscillating Fibers. Opt Express (2020) 28(14):19877–86. doi:10.1364/OE.394002
40. Li Q, Duan X. Effect of a Weak CW Trigger on Optical Rogue Waves in the Femtosecond Supercontinuum Generation. Opt Express (2015) 23(12):16364–71. doi:10.1364/oe.23.016364
Keywords: optical rogue wave, dispersion oscillating fiber, nonlinear optics, mid-infrared, suppression supercontinuum
Citation: Liu S, Han X, lv J, Feng Y, Xia Y and Bai Z (2021) Suppression of Optical Rogue Waves by Dispersion Oscillating Fiber in the Mid-infrared Supercontinuum. Front. Phys. 9:761513. doi: 10.3389/fphy.2021.761513
Received: 20 August 2021; Accepted: 11 October 2021;
Published: 25 October 2021.
Edited by:
Bao-Sen Shi, University of Science and Technology of China, ChinaCopyright © 2021 Liu, Han, lv, Feng, Xia and Bai. This is an open-access article distributed under the terms of the Creative Commons Attribution License (CC BY). The use, distribution or reproduction in other forums is permitted, provided the original author(s) and the copyright owner(s) are credited and that the original publication in this journal is cited, in accordance with accepted academic practice. No use, distribution or reproduction is permitted which does not comply with these terms.
*Correspondence: Shuo Liu, bGl1c2h1b0BoZWJ1dC5lZHUuY24=
Disclaimer: All claims expressed in this article are solely those of the authors and do not necessarily represent those of their affiliated organizations, or those of the publisher, the editors and the reviewers. Any product that may be evaluated in this article or claim that may be made by its manufacturer is not guaranteed or endorsed by the publisher.
Research integrity at Frontiers

Learn more about the work of our research integrity team to safeguard the quality of each article we publish.