 Eduardo Moreno
 Robert Großmann
 Carsten Beta
 Sergio Alonso
94% of researchers rate our articles as excellent or good
Learn more about the work of our research integrity team to safeguard the quality of each article we publish.
Find out more
ORIGINAL RESEARCH article
Front. Phys., 02 February 2022
Sec. Soft Matter Physics
Volume 9 - 2021 | https://doi.org/10.3389/fphy.2021.750187
This article is part of the Research TopicActive and Intelligent Living Matter: from Fundamentals to ApplicationsView all 7 articles
The coupling of the internal mechanisms of cell polarization to cell shape deformations and subsequent cell crawling poses many interdisciplinary scientific challenges. Several mathematical approaches have been proposed to model the coupling of both processes, where one of the most successful methods relies on a phase field that encodes the morphology of the cell, together with the integration of partial differential equations that account for the polarization mechanism inside the cell domain as defined by the phase field. This approach has been previously employed to model the motion of single cells of the social amoeba Dictyostelium discoideum, a widely used model organism to study actin-driven motility and chemotaxis of eukaryotic cells. Besides single cell motility, Dictyostelium discoideum is also well-known for its collective behavior. Here, we extend the previously introduced model for single cell motility to describe the collective motion of large populations of interacting amoebae by including repulsive interactions between the cells. We performed numerical simulations of this model, first characterizing the motion of single cells in terms of their polarity and velocity vectors. We then systematically studied the collisions between two cells that provided the basic interaction scenarios also observed in larger ensembles of interacting amoebae. Finally, the relevance of the cell density was analyzed, revealing a systematic decrease of the motility with density, associated with the formation of transient cell clusters that emerge in this system even though our model does not include any attractive interactions between cells. This model is a prototypical active matter system for the investigation of the emergent collective dynamics of deformable, self-driven cells with a highly complex, nonlinear coupling of cell shape deformations, self-propulsion and repulsive cell-cell interactions. Understanding these self-organization processes of cells like their autonomous aggregation is of high relevance as collective amoeboid motility is part of wound healing, embryonic morphogenesis or pathological processes like the spreading of metastatic cancer cells.
Collective migration has been extensively studied in a wide range of different systems, such as bird flocks, fish schools, or crowds of pedestrians [1]. However, not only at the level of higher organisms but also at the cellular scale, collective migration is key to many essential biological processes [2]. During wound healing, for example, groups of cells are moving towards the site of injury to remove bacterial infections and to close the tissue [3]. Similarly, in the course of embryonic morphogenesis [4], cells collectively migrate to distinct locations in the embryo to fulfil specific tasks [5, 6]. Collective cell migration is also involved in pathological processes, such as the spreading of metastatic cancer cells [7, 8], where groups of cells migrate through tissue and initiate the formation of tumors.
Many properties of the movement of single adherent cells on flat substrates are well understood. In particular, the dynamics of the actin cortex that relies on the continuous polymerization and depolymerization of actin filaments has been intensely investigated [9]. The actin system is known to drive the formation of lamellipodia and protrusions that push the cell forward [10, 11]. In contrast to the motility of single cells, much less is known about the mechanisms by which groups of cells organize and coordinate their movement. Recent advances in microscopy imaging techniques combined with cell tracking methods permit us to study collective migration patterns of large numbers of cells over extended periods of time with single cell resolution. This provides a better understanding of how groups of cells coordinate their movement and may allow to develop, for example, therapeutic drugs. Note that collective effects in populations of motile cells do not simply arise as a consequence of their free random movement. Instead, when moving in groups, cells may act in a coordinated way, resulting in collective modes of locomotion that clearly differ from the way they move as isolated individuals. Well-known examples arise when cells form a dense monolayer [12] or when groups of cells are governed by a few leader cells [13]. However, as long as they are not too tightly packed, they typically continue moving as individuals and occasionally form clusters that show coordinated patterns and localized bursts of velocities [14].
Together with progress in the experimental studies of collective cell migration, also efforts in physical modeling of this process have increased. Describing the motion of cells in a quantitative manner requires solving equations that incorporate intracellular processes as well as interactions with the environment; for a review of different physical modeling approaches, see Refs. [15–17] and references therein. A simplistic, well-known approach to describe collective motion from a physical point of view is the Vicsek model [18], where active agents are described as point-like, self-propelled particles interacting via heuristic velocity-alignment rules of different symmetry, which effectively mimic the effects of collisions [19, 20]. In order to model cell-cell interactions in a more realistic fashion, however, it is necessary to take the spatial extension of cells and their dynamic shape changes into account, which cannot be achieved by a point particle description. In general, particle shape is known to crucially affect the emergent patterns in ensembles of active particles [21]: whereas self-propelled discs undergo aggregation and motility-induced phase separation, even in the absence of attractive interactions [22, 23], self-propelled rod-shaped particles were shown to display a variety of self-organized, complex patterns of different symmetry such as polar clusters, nematic bands or mesoscale turbulence [20]. The pattern formation in soft deformable self-propelled particles that can adopt different elliptical shapes depending on the strength of self-propulsion is correspondingly complex and rich [24]; in the latter work, however, particle shape was not considered to be dictated by an intracellular biochemical reaction but heuristically introduced via a direct coupling to the strength of self-propulsion. More realistic cell shapes were successfully incorporated using the lattice based Cellular Potts Model [25, 26]. Here, the cell is represented by a group of connected pixels of a given size, where every pixel is regularly updated according to certain probabilistic rules. A major limitation of this method is that the dynamics of pixel updates is artificial and difficult to relate to the real-time dynamics of cell motion. Alternatively, also active network models, such as Vertex [27, 28] and Voronoi models [29, 30], are used to study cell migration, describing tissues as a network of polygonal cells [31]. Here, however, a limitation is that these models take neither internal processes in the cells nor anisotropic active stresses in the tissue into account. We are interested in mathematical models which are able to describe the emergence of collective dynamics together with the intracellular pattern formation responsible for the polarization of single cells. An approach that became increasingly popular in recent years to model cell migration is the phase field method that readily incorporates evolving geometries without the need of explicitly tracking the domain boundaries. In cell motility modeling, the phase field defines the cell shape and position, being one inside and zero outside the cell, and it maintains the correct boundary conditions while the border is moving [32, 33]. The phase field approach has been used to study the persistent [34–36], bipedal [37], and rotary motion [38] in keratocyte-like cells. More recently, it was also employed to model amoeboid movement of cells such as neutrophils [39] and Dictyostelium discoideum [40]. In addition, other features, such as viscoelasticity [41, 42], the effect of intracellular biochemical waves [43], and wave-driven cytofission of cells [44] have been successfully modeled based on the phase field approach. There is also work related to the use of phase fields to model the collective motion of eukaryotic cells: in early studies, shape changes due to interactions [45] and the rearrangement of cells in clusters [46] were considered. Later, monolayers of deformable motile cells where investigated, revealing a melting transition in these systems [47–51]. Also the impact of collisions between deformable cells has been studied within the phase field approach, focusing on the resulting alignment and collective motion of cells [52–54].
In this article, we focus on the collective motion of amoeboid cells, motivated by the relevance of amoeboid motility for immune responses and cancer spreading. Also the social amoeba Dictyostelium discoideum (D. discoideum), a well-established model organism to study amoeboid locomotion, is known for its collective behavior [55]. In the course of its starvation-induced life cycle, D. discoideum cells organize into large multicellular colonies, a process mediated by self-organized waves of chemoattractant that travel across spatially distributed populations of cells to guide their aggregation process [56]. The underlying set of interactions is complex and several models have focused on the mechanisms of periodic chemoattractant signaling and the resulting emergent waves [57, 58]. Here, we will not take the specific aspects of the signaling mechanisms of D. discoideum into account. Instead, we will concentrate on generic aspects of collective motion that may arise from pure mechanical interactions of amoeboid cells. All forms of mutual chemical signaling between the cells are excluded. For our numerical study, we will rely on a mathematical model based on a reaction-diffusion system that is embedded into a phase field, accounting for the intracellular dynamics and driving the evolution of the cell contour. This model has been previously established to reproduce the dynamics of single D. discoideum cells under different conditions [40, 59] and will now be extended to study ensembles of interacting cells. In particular, the ability to describe deformable objects with a phase field representation will be exploited to study the mechanical interaction between these motile, deformable particles that can be seen as a simplistic representation of ensembles of migrating amoeboid cells. First, we will study the interactions between two cells and later increase the density of cells to investigate the dynamics of larger populations.
In summary, we developed a mathematical model that enables us to study the dynamics of deformable, actively moving entities, which can be applied to the interaction among cells in different physiological conditions and, in particular, to the motion of D. discoideum. We have obtained the density dependence of the average velocity and polarity of individual cells forming a swarm and describe the generation of transient clusters. This model is a prototypical active matter system for the investigation of the emergent collective dynamics of self-driven cells with a highly complex, nonlinear coupling of cell shape deformations, self-propulsion and repulsive cell-cell interactions.
The computational model used here is an extended version of a previously introduced phase field model coupled to a stochastic bistable reaction-diffusion process [40, 44]. This model was originally designed to study the migratory behavior of an individual amoeba, such as a D. discoideum cell, and is now extended to include interactions between several cells that are jointly simulated in the same computational domain. The model is composed of a concentration variable c accounting for the biochemical processes occurring in the interior of the cell. The variable c represents a generic activatory signal that can be associated with upstream regulatory components of actin activity, such as activated Ras, PI3K or PIP3. The dynamics of c is coupled to the evolution of the cell shape such that the cell boundary is protruding outward at locations of high values of c. The cell shape is encoded by an auxiliary phase field ϕ which defines the area of the cell and varies from ϕ = 1 inside to ϕ = 0 outside of the cell. In our simulations, each cell (index i) is represented by its own concentration variable ci (x, t) and its own phase field ϕi (x, t). Different cells interact via short-range repulsion that prevents overlap or adhesion. The phase field evolves according to the following equation,
where the first term on the right-hand side corresponds to the surface energy of the cell membrane related with a free energy which incorporates the derivative of a double well potential G(ϕ) = 18 ϕ2 (1—ϕ)2. The surface tension and the width of the cell boundary are parametrized by γ and ϵ, respectively. The second term enforces the cell area to stay close to a typical value A0, and the third term represents the active force that acts on the cell membrane, which is generated by the biochemical field ci. These three terms can be derived from free energy arguments [34]. The fourth term models cell-cell interactions controlled by parameter mrep, thereby preventing cells from overlapping. Here, N corresponds to the total number of cells in the system. The parameters that control the surface tension, the strength of the area conservation constraint and the active force, γ, β and α, respectively, are kept constant in simulations, see Table 1 for parameter values, taken to reproduce the dynamics of vegetative or starving D. discoideum cells [40].
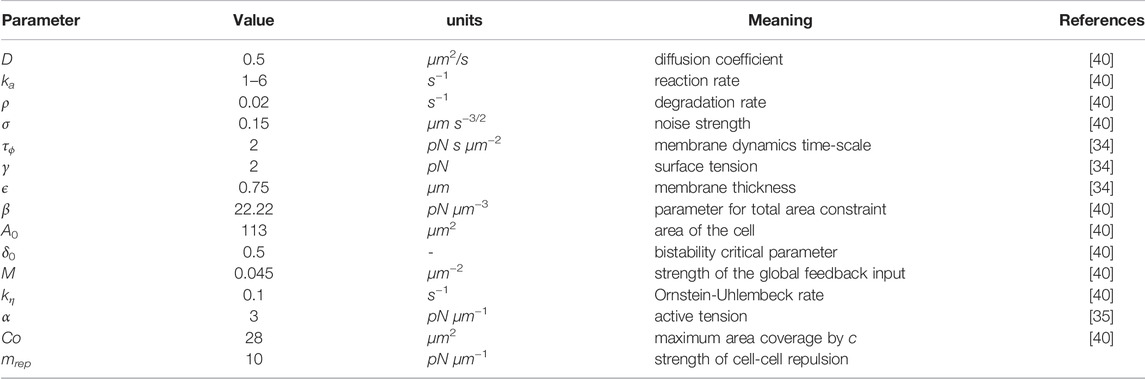
TABLE 1. Parameter values for the numerical model. The parameter mrep, parametrizing the repulsive interactions, is introduced in this work and, therefore, no reference is given.
The dynamics of the biochemical component ci that diffuses and reacts inside the cell follows a noisy, bistable reaction kinetics,
where ka is the reaction rate, ρ the degradation rate, and D the diffusivity of the component ci. The parameter δ controls the evolution of the concentration pattern and introduces a global feedback to maintain a fixed amount of ci inside the cell, thus imposing a mass-conservation condition in the model:
The last term on the right-hand side of Eq. 2 introduces noise, accounting for the stochastic nature of the reaction-diffusion processes occurring within the cell: the stochastic field ξ(x, t) follows an Ornstein-Uhlenbeck dynamics,
where η(x, t) is a Gaussian white noise with zero mean, ⟨η⟩ = 0, and the variance ⟨η(x, t)η(x′, t′)⟩ = 2σ2δ(x − x′)δ(t − t′). The relaxation rate kη along with the reaction rate ka are key parameters in our model that control transitions between different forms of cell motility.
Simulations were performed using finite differences with a spatial and temporal resolution of Δx = 0.15 μm and Δt = 0.002 s, respectively. We used the Euler-Maruyama method for the stochastic integration of the partial differential equations. The total area considered for each cell was kept constant at A0 = 113 μm2 corresponding to a circular cell with radius r = 6 μm. The area covered by the biochemical component ci was maintained at C0 = 28 μm2, corresponding to a quarter of the cell area. The size of the grid and the number of cells were varied to explore different packing fractions ρR = NA0/L2 in the range from 0.24 to 0.78. Initial conditions of the intracellular concentration fields are chosen to produce polarized cells and promote collisions in the case of binary interaction scenarios, and isotropic in the case of multi-particle simulations.
Some characteristic cell morphologies as observed in numerical simulations are displayed in Figure 1. Patches of high concentration of the biochemical component ci that typically result in extensions/protrusions of the cell boundary are shown in green color in the respective images (cf. Figure 1A). Similar to earlier experimental work, where fluorescently marked patches of PI3K were used to quantify the polarization of cells [60], we take advantage of the distribution of the biochemical field ci for that purpose here as follows. We measure the total area of the cell (AT) and obtain the corresponding centroid coordinate (xT, yT), shown as a white cross in Figure 1. We also measure the total area(s) of the patches covered by high values of the field ci (ACi) and obtain the centroid coordinates (
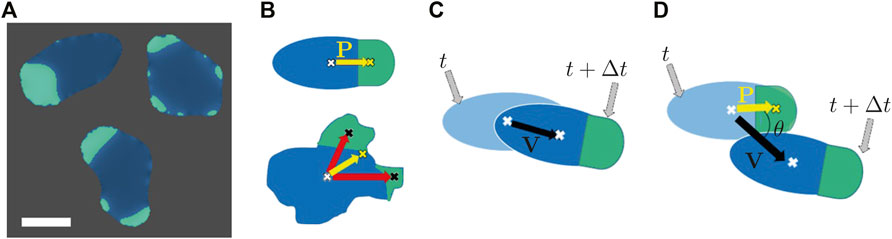
FIGURE 1. (A) Snapshots of the different cell phenotypes as observed in numerical simulations. Green patches indicate the presence of the biochemical component c. Scale bar: 10 μm. (B) Illustration of the calculation of the cell polarity vector P in the presence of one patch (top) or several patches (bottom). In the latter case, we consider the weighted average of the centroids of individual patches. The weights are determined by the respective patch size. (C) Illustration of the spatial displacement of a cell in the time interval from t to t + Δt. (D) Graphical representation of the angle θ between cell polarity P and velocity vector V.
We divide all possible collisions between two cells that we can generate in numerical simulations, into two specific types: frontal and glancing collisions, see Figure 2A. For both types, we observed three main interaction scenarios with different outcomes as illustrated in Figure 2. In the first scenario, which we call alignment, both cells face and migrate into the same direction after the collision. In the second case, the anti-alignment scenario, cells repel each other and move away in opposite directions after the collision. Finally, upon collision, the motion of the two cells may also stall and both cells may remain on the spot, pushing head-on against each other for an extended period of time, before they eventually get released by a random fluctuation. We call this the stuck/push scenario.
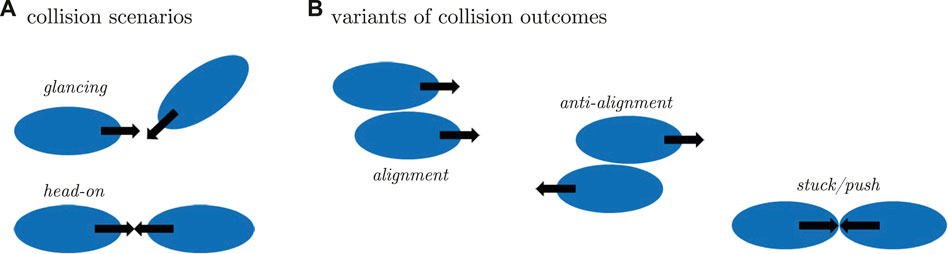
FIGURE 2. (A) Graphical illustration of the different collision scenarios and (B) the respective outcome of the interaction. Initial conditions for binary collision are glancing (top) and head-on collision (bottom). The interaction may result in alignment of cells, anti-alignment of velocities and cell polarities or cells may stuck/push head-on, thereby impeding each others motion.
Cell polarity is a fundamental feature that plays a key role in many cellular functions, such as cell growth, division, and migration. In particular, depending on their degree of polarity, motile cells can display several different motion patterns, such as random, oscillatory or persistent movement. For a motile cell, polarity is typically defined based on the leading and trailing edge (head and tail) of the moving cell. In the model used here, it is the biochemical component ci which triggers the formation of membrane protrusions (pseudopods) at the cell boundary, and is thus responsible for setting the sense of orientation of the moving cell. For this reason, we quantify polarity based on a polarity vector P that measures the asymmetry in the subcellular distribution of the biochemical component ci, see Section 2.4 for details. To what extent the displacement of the cell is governed by the direction of the polarity vector is the subject of study of this section.
A wide range of cell motion patterns was studied in numerical simulations of our model previously [40]. It was shown that the transition from random to persistent motion is controlled by the model parameter ka, see Eq. 2. Small values of ka give rise to an erratic trajectory that is caused by the random appearance of protrusions all around the cell. On the other hand, large values of ka produce a more persistent trajectory due to the accumulation of protrusions in one region of the membrane that sets the overall direction of motion. Those scenarios were associated with the vegetative and the starvation-developed states of D. discoideum cells [40], respectively.
Here, we studied cell migration patterns for different values of the parameter ka, focusing on the dynamics of the displacement and polarity vectors to quantitatively analyze the role of cell polarization for the different modes of locomotion (see Figure 3). For every row in Figure 3, the panel in the first column shows a snapshot of a simulated cell with a superposition of the polarization vector P (in black) and the cell propagation vector V (in red). The second column presents the cell trajectories in space. Here, a pronounced change from random to persistent motion can be seen from top to bottom with growing ka, in line with our earlier results [40]. Thus, cells perform larger explorations in space as they become more persistent for high values of the parameter ka. In the third column, the correlation of the normalized magnitude of the vectors P and V is displayed, revealing a high degree of correlation for large values of ka, whereas correlations are low for small ka. In the fourth column, circular histograms of the angle θ between the vectors P and V are displayed. For small values of ka both vectors are typically misaligned, while alignment is observed for high values of ka. The corresponding probability distribution exhibits a peak around zero that becomes increasingly pronounced for growing values of ka. These results show that the vectors P and V are more likely to align for growing values of ka, resulting in an increased probability for values of θ close to zero.
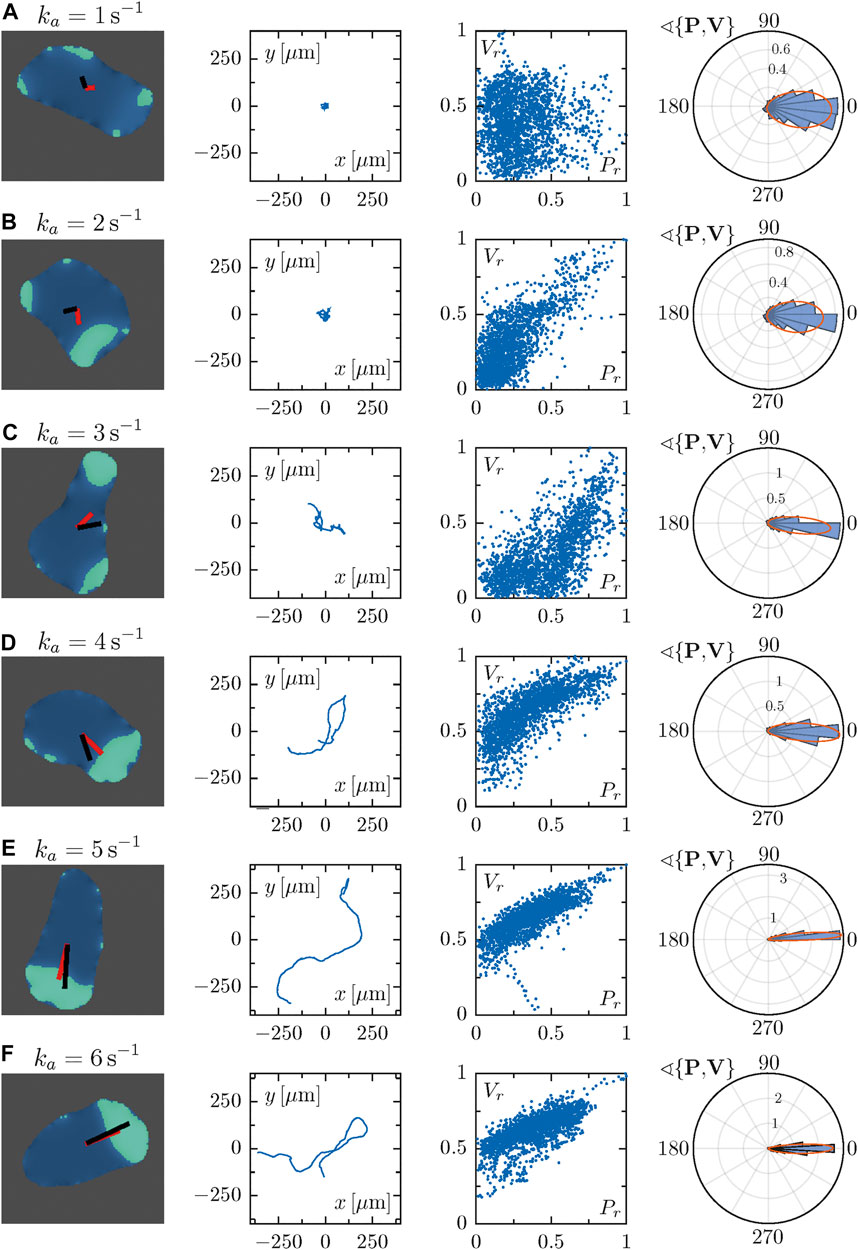
FIGURE 3. Each row corresponds to a particular single cell phenotype for increasing values of the parameter ka. In the first column, snapshots along with the polarization and velocity vectors P and V are depicted in black and red, respectively. The corresponding trajectory is shown in the second panels. Third panels represent the correlation of the magnitudes of vectors P and V, which were normalized with respect to the maximal value observed during a simulation. The fourth column panels represent circular histograms for the angle between the vectors P and V. Parameter values: (A) ka = 1 s−1, (B) ka = 2 s−1, (C) ka = 3 s−1, (D) ka = 4 s−1, (E) ka = 5 s−1, (F) ka = 6 s−1.
In short, the dynamics of the cell propagation vector V, the polarization vector P and the angle θ between them reflects the more persistent and less random motion of cells as the parameter value of ka increases. To summarize the dependencies on the parameter ka, we show the mean of the absolute values of the vectors P and V as well as the angle θ between them as a function of ka in Figure 4. With increasing parameter ka, larger mean values of the polarization vector P are observed in Figure 4A. This is associated with increasing mean values of the velocity of polarized cells, see the magnitudes of the vector V in Figure 4B. Figure 4C finally shows that not only the absolute values of P and V increase, but also their alignment is more pronounced with increasing ka, so that the mean angle θ decreases. For a better comparison, box plots of the angle θ are presented in Figure 4D. In summary, persistent motion (high values of ka) is characterized by larger magnitudes of the vectors P and V and by smaller angles θ between them, i.e. by increased alignment of the polarity and the displacement directions. On the other hand, random motion (small values of ka) results from smaller magnitudes of P and V and larger angles θ, indicating the absence of alignment due to the irregular distribution of patches of ci that trigger random protrusion all around the cell boundary.
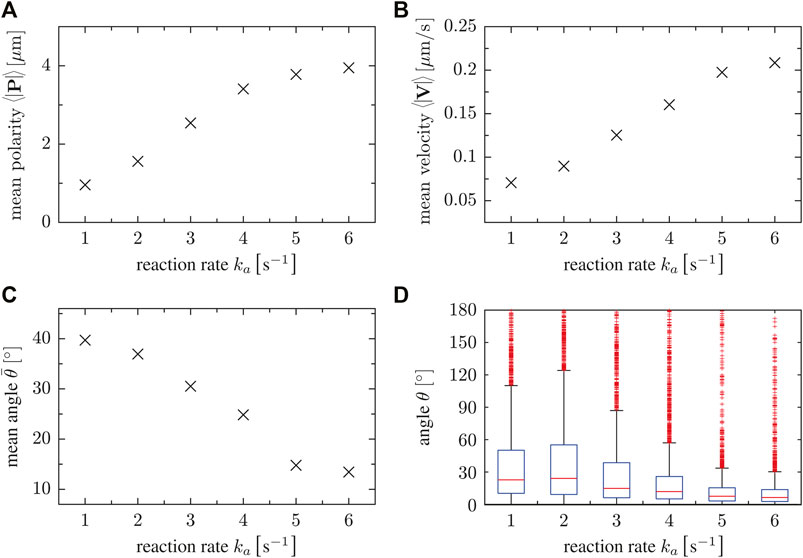
FIGURE 4. (A) Magnitude of mean polarity 〈|P|〉, (B) mean velocity 〈|V|〉 and (C) the mean angle for different values of the reaction rate parameter ka. Accordingly, this parameter controls the polarity of single cells. (D) Box plots of the angle θ as a function of the reaction rate parameter ka. For high ka, velocity and cell polarity tend to be aligned.
Before we address the dynamics of multiple interacting cells, we first focused on the interactions between two cells. As detailed in Section 2.1, we extended the phase field description of a single amoeboid cell by including a repulsive force between them; any kind of adhesive force is neglected. For the following simulations, we have chosen the model parameters in the regime of persistent motion, in particular, the reaction rate was set to ka = 5s−1. We modeled a pair of cells close to each other on a square grid for a period of 90 s with the purpose of making them interact and analyzing the collision dynamics between them. From our simulations, we could distinguish three types of collision scenarios that we termed alignment, anti-alignment and stuck/push, illustrated in Figure 2 (see also Section 2.5). In Figure 5, we display representative series of snapshots for each of the three scenarios observed in simulations of glancing collisions (Figures 5A–C) as well as for head-on collisions (Figures 5D–F). We found that the avoidance between cells (anti-alignment) was the most frequently observed case in our simulations, see Figures 5B,E. The second most frequent scenario was the alignment of cells, as can be seen in Figures 5A,D. Finally, the stuck/push scenario was only rarely observed, see Figures 5C,F. The two cells, which get stuck upon collision, push against each other for an extended period of time, before the shape of one of them is strongly distorted, as a consequence of which the heads-on pushing configuration is destabilized and they continue moving in different directions. However, as we will show in the next sections, this case will be more frequently observed when the density of cells is increased.

FIGURE 5. Sequence of snapshots of a binary interaction of cells, representing (A) alignment (Movie SM1), (B) anti-alignment (Movie SM2) and (C) stuck/push (Movie SM3) scenarios for a glancing collision. Panels (D–F) show the alignment (Movie SM4), anti-alignment (Movie SM5) and stuck/push (Movie SM6) scenarios, respectively, corresponding to head-on collision. Scale bar: 10 μm.
We furthermore analyzed the collision-induced dynamics of the cells in more detail in Figure 6, following the same order as in Figure 5. In the first column, we display snapshots of the two interacting cells for every studied case, including the polarity vector P and velocity vector V for each cell. In the second column, representations of the cell trajectories are shown, revealing clear differences between the different collision scenarios. In the alignment case (A and D), for example, trajectories tend to be parallel, while a crossing of tracks is seen for the anti-alignment scenario (B and E). Only small displacements are obtained in the stuck/push case (C and F) as cells impede each others motion upon head-on collision. The third column displays again the correlation of the normalized magnitudes of the vectors P and V. The fourth column shows the distributions of the angle θ between the polarity and velocity vectors P and V for the two interacting cells—wider distributions for the angle are seen in the stuck/push scenario.
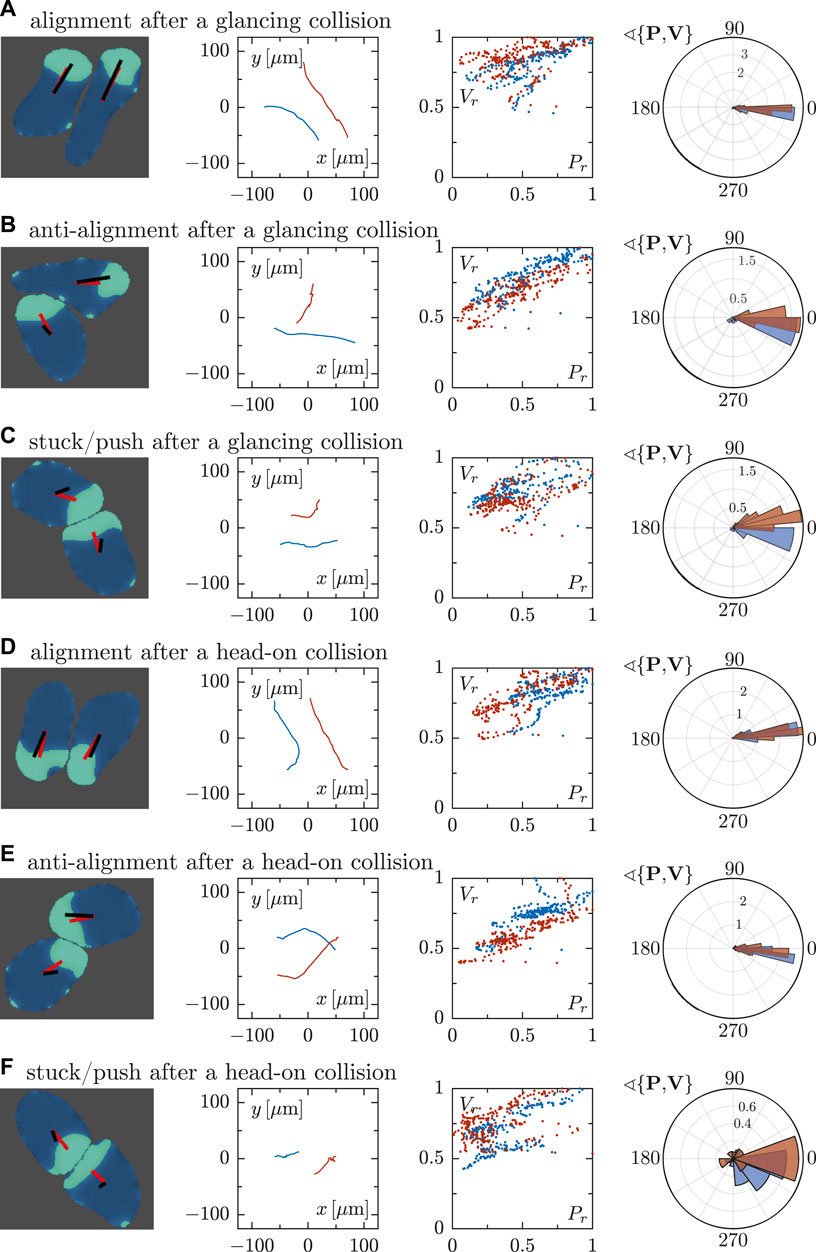
FIGURE 6. Quantitative analysis of binary cell interactions in terms of the cell polarity and velocity vectors for different interaction scenarios, cf. Figure 5. For every row (A–F), the first column panels show the snapshots of cells where a representation of the vectors P and V is included. The second column shows the corresponding trajectories. Analogously to Figure 3, the third column represents the correlation of the rescaled magnitudes of vectors P and V of the two interacting cells. The panels in the fourth column show circular histograms of the angle θ enclosed by cell polarity P and velocity V. The collision scenarios in (A–C) correspond to glancing collisions, resulting in (A) alignment, (B) anti-alignment and (C) stuck/push configurations. In contrast, panels (D–F) correspond to head-on collisions, likewise resulting in (D) alignment, (E) anti-alignment and (F) stuck/push configurations.
For all the cases, the magnitude of both vectors tend to correlate, regardless of the orientation of the cells. This behavior is more clearly observed in the alignment and anti-alignment cases, while in the stuck/push case this tendency is weaker. As mentioned before, these distributions are wider for the stuck/push case, indicating stronger fluctuations and less correlations in the orientations of the polarity and velocity vectors P and V. The results discussed above are summarized by box plots of the angle θ between P and V for the different scenarios shown in Figure 7. The alignment and anti-alignment scenarios generate only small differences in the orientations of the vectors P and V during the interactions and, therefore, P and V are typically aligned. In contrast, larger deviations of the relative orientation of the vectors and, consequently, larger values of θ occur in the stuck/push scenario, indicating that vectors P and V are not aligned.
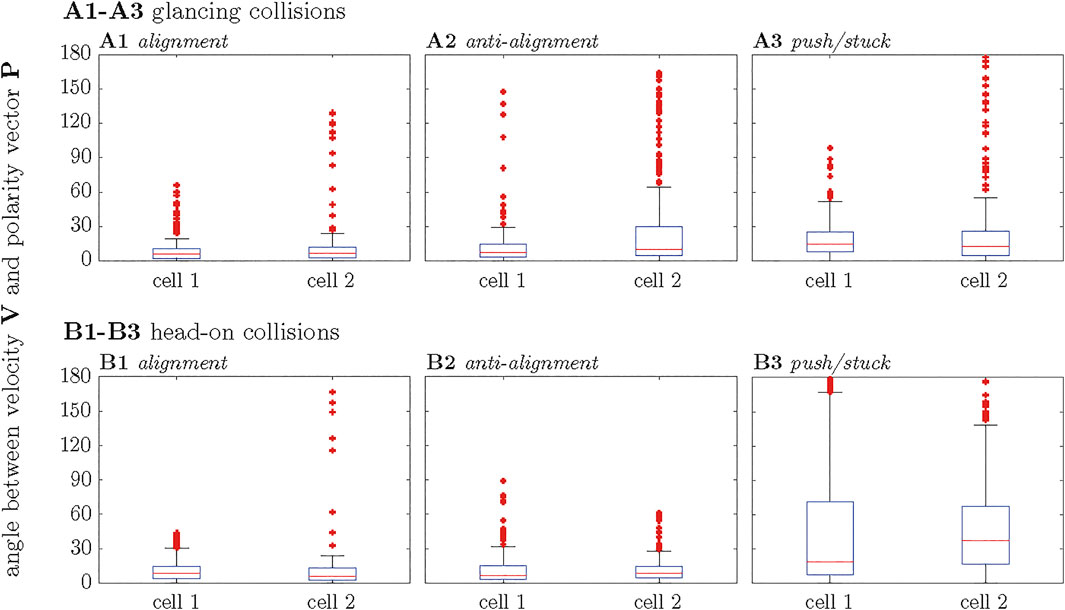
FIGURE 7. Boxplot representations of the measured angles θ during the interaction of two cells. The panels correspond to alignment, anti-alignment and stuck/push cases for the glancing collisions (A1–A3) and heads-on collisions (B1–B3), respectively.
We have furthermore used the cross correlation as a tool to show if a relationship between velocity and polarization vectors among the cells can be observed in order to clarify the results described above. However, the cross-correlation of the vectors P1 and P2, where the index indicates the different cells, has not revealed any conclusive information because of the different time scales of the repolarization, and the cross-correlation of vectors V1 and V2 only shows significant differences for the stuck/push conditions. The differences of collision types are most evident from the Supplementary Movies SM1–SM6 of the head-on and glancing binary collisions.
We now move to larger numbers of interacting cells. From the various cell-cell interactions within the ensemble of cells, we were able to identify the previously observed three collision scenarios: alignment, anti-alignment and stuck/push, see Supplementary Figure S1.
We varied the system size L, keeping the number of cells N = 25 fixed, to assess the density dependence of motility characteristics, the relevance of collision scenarios and the resulting collective pattern formation. The packing fraction ρR = NA0/L2, i.e. the relative fraction of surface area covered by cells also referred to confluency, is a central control parameter which determines the density of cells in the simulation box. At high cell densities, jamming is expected to be more relevant as the probability of cell-cell collisions increases. To study these effects, we simulated five different domain sizes; Figure 8 shows exemplarily the gradual transition from a dilute (Figure 8A and Supplementary Movie SM7) to a dense system (Figure 8E and Supplementary Movie SM8).
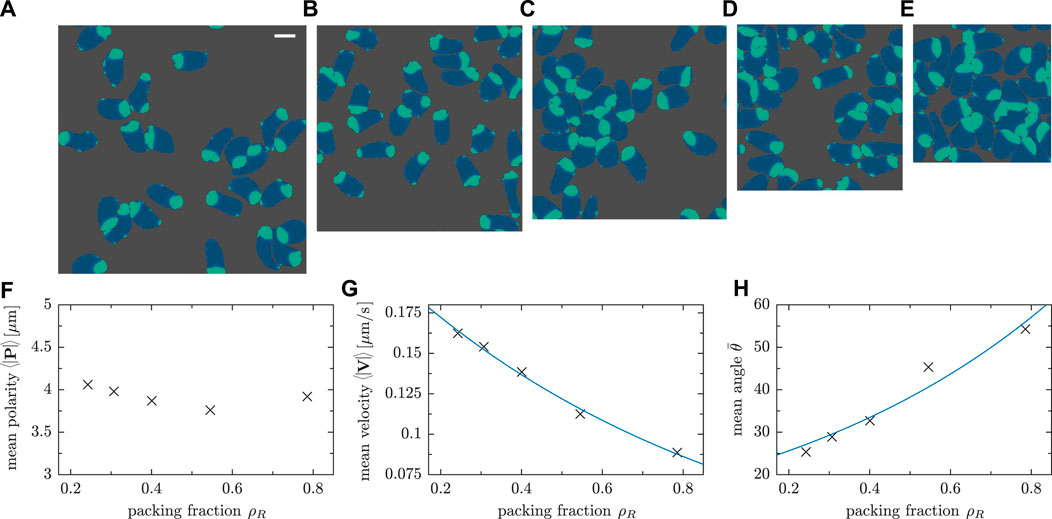
FIGURE 8. Snapshots of simulations with constant cell number N = 25 and varying system size with a difference in side length of L = 12 μm between consecutive panels. The side length L of the simulation box and the packing fraction ρR = NA0/L2 are: (A) L = 108 μm and ρR = 0.24 (Movie SM7); (B) L = 96 μm and ρR = 0.30; (C) L = 84 μm and ρR = 0.40; (D) L = 72 μm and ρR = 0.54; (E) L = 60 μm and ρR = 0.78 (Movie SM8). (F) Mean polarity, (G) mean speed and (H) mean angle between velocity and polarity for different packing fractions ρR. The number of cells was fixed (N = 25 cells), while the system size was varied. The fits in panels (G) and (H) provide a guide to the eye.
In high density scenarios, stuck/push interactions are more commonly observed as cells trying to follow their own trajectory collide with others, thereby competing for free space. This behavior is expected due to the higher packing fraction ρR. For the chosen model parameters, cells tend to remain fairly polarized—the mean magnitude of the polarity vector does only weakly depend on ρR (cf. Figure 8F). The mean velocity, however, decreases significantly as the cell density is increased (see Figure 8G) due to the lack of free space in a dense system. As a result of frequent cell-cell collisions, the angle between polarity and displacement vectors increases on average as a function of the packing fraction ρR as shown in Figure 8H. This is in line with our previous observation that velocity V and cell polarity vector P tend to be misaligned as a result of stuck/push interactions (see Figure 6F and the corresponding discussion in Section 3.2). As cells remain polarized—most of the biochemical component ci is concentrated in one certain part of cells—but collisions change their velocities, the vectors P and V cease to be aligned and the angle between them, thus, increases.
The numerical results suggest that stuck/push collision scenarios are more relevant at higher cell densities. As cells impede each others motion as a result of stalling, these collisions may lead to the formation of clusters composed of immobile cells. This mechanism is reminiscent of the explanation of motility-induced phase separation (MIPS) as observed in self-propelled discs [23] that show phase separation at high density because particles hamper each others motion upon head-on collision. We want to highlight, however, that the clustering dynamics observed in deformable cells is different from classical MIPS: as cells are deformable, the local stress acting on one cell is anisotropic. This effect is even more pronounced as clusters grow in size and, consequently, the local pressure increases. As a result, clusters frequently break apart, thereby giving rise to a complex and dynamic clustering dynamics. To quantify clustering, we measured the cluster size distribution numerically (Figure 9). We consider two cells to belong to the same cluster if the distance between them is smaller than 12 μm which corresponds roughly to twice the average radius of a cell (in the absence of interactions). At low densities, a few collisions lead to the transient formation of small groups of cells. Group sizes range from a few cells to more than half of the total number of cells in the system (Figure 9A). In contrast, larger groups are more frequently formed in dense systems (Figures 9B–D). Accordingly, the cluster size distribution broadens as the packing fraction is increased and adopts even a bimodal shape in the high density limit (Figure 9E). A direct comparison of the transition from a unimodal to a bimodal shape can be seen in Figure 9F, where panels corresponding to the lowest and highest packing fraction are shown together for a better visualization. This structural change of the cluster size distribution eventually allows to define a critical packing fraction above which clustering sets in, similar to the clustering transition observed in ensembles of self-propelled rods [20, 61].
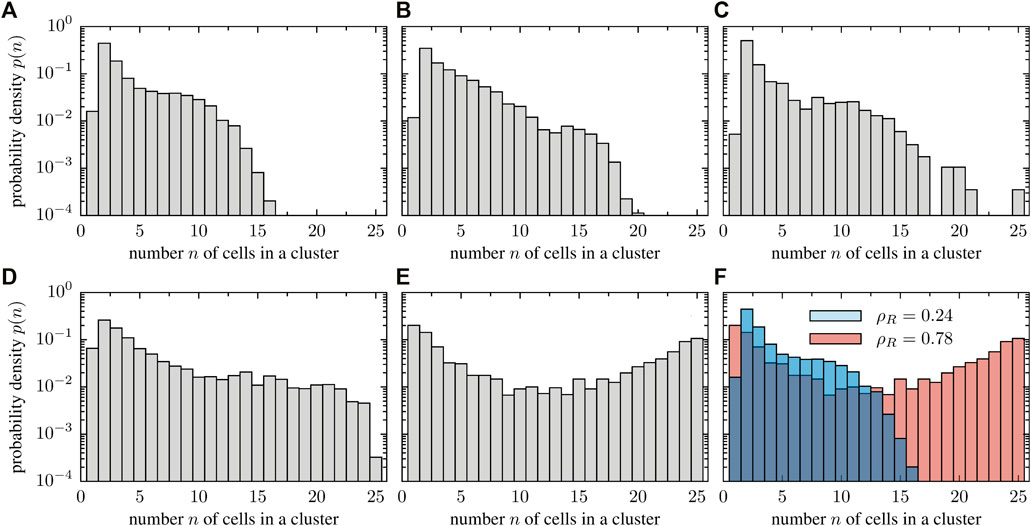
FIGURE 9. Histograms of the observed cluster sizes for various particle densities. The cell number was kept constant (N = 25 cells) and the system size was varied. The packing fractions values of the different panels are (A) ρR = 0.24, (B) ρR = 0.30, (C) ρR = 0.40, (D) ρR = 0.54 and (E) ρR = 0.78. For increasing packing fraction, the cluster size distribution changes from a unimodal to a bimodal structure, signaling a clustering transition. This transition is highlighted in the last panel (F), where the cluster size distribution for low and high packing fraction is overlayed to simplify the comparison.
We furthermore quantify the random transport of cells within an ensemble by the mean square displacement
to the numerically obtained curves. The diffusion coefficient decreases as the packing fraction is increased (cf. Figure 10C). Moreover, the fits show that the crossover timescale τ decreases as the density of particle increases, due to a reduction of the mean-free path and a higher collision frequency at high packing fraction.
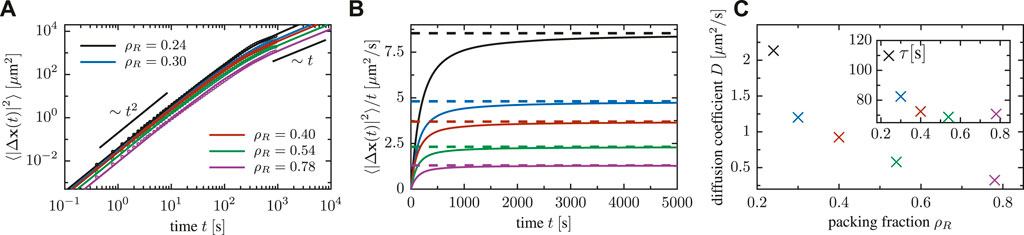
FIGURE 10. (A) Mean square displacement of cells for a system of N = 25 cells in a box of various side length (implying various packing fractions). (B) Mean square displacement of particles, divided by time, for a system of N = 25 cells in a box of various side length. (C) Dependence of the effective diffusion coefficient on the packing fraction, extracted via fitting Fürth’s formula to the mean square displacement; the inset shows the decrease of the crossover timescale τ as a function of the density Eq. 5.
We double-checked that equivalent results are obtained when the packing fraction is increased by changing the particle number in a system of fixed size of L = 108 μm (data not shown) instead of fixing the particle number and decreasing the side length of the simulation box as discussed above (Figures 8–10).
We conclude the results section by assessing the relevance of the finite system size in numerical simulations. We performed a finite-size scaling analysis, varying the number of cells and system size such that the density or, equivalently, the packing fraction is kept constant. Five representative snapshots of the simulated systems are shown in Figures 11A–E, where the number of cells is 25, 36, 49, 64 and 81, respectively, and the system size was adjusted from L = 60 μm to L = 108 μm accordingly. As shown in Figures 11F,G, the measured value of the mean polarity and velocity does not reveal a significant system size dependence. Furthermore, the angle θ between the vectors P and V in all cases does not change on average as the number of cells is varied (cf. Figure 11H).
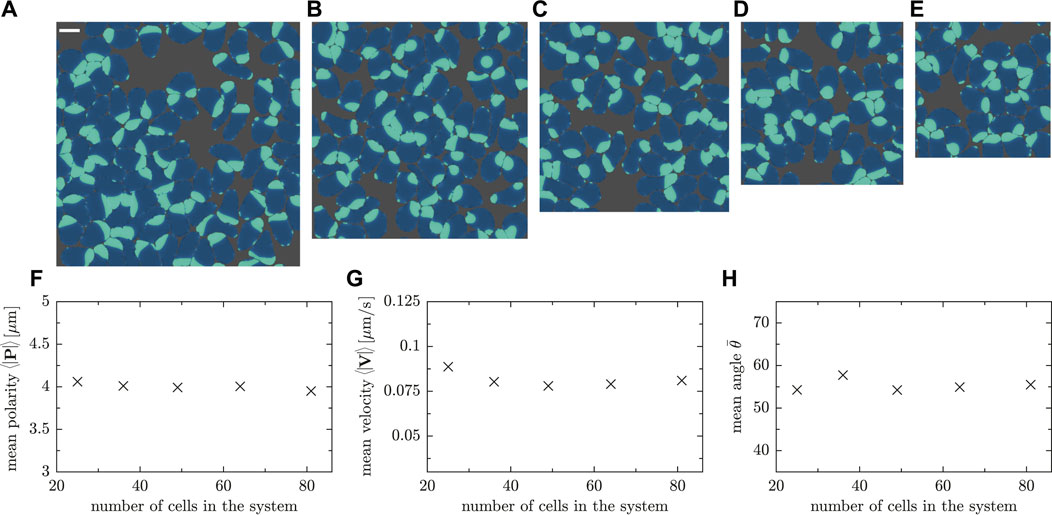
FIGURE 11. Snapshots of simulations with the same packing fraction ρR = 0.78. The number of cells and the side length are (A) 81 cells and L = 108μm, (B) 64 cells and L = 96 μm (Movie SM9), (C) 49 cells and L = 84 μm (Movie SM10), (D) 36 cells and L = 72μm, (E) 25 cells and L = 60 μm. (F) Mean polarity, G mean velocity and (H) mean angle between velocity and polarity vector for a fixed packing fraction but various cell numbers in the system.
The tendency of cells to align or impede each others motion upon collision in stuck/push configurations implies a tendency towards cluster formation in the system (see Supplementary Movies SM9, SM10 for simulations with 64 and 49 cells, respectively). As the system size increases, larger clusters of cells tend to form as shown in Figure 11. We quantitatively investigated the clustering dynamics by measuring the cluster size distribution in the stationary state; a comparison of all the studied cases is displayed in Figure 12. In contrast to the numerical experiment discussed in Section 3.3, where the density was increased, the shape of the cluster size distribution is now qualitatively independent of the system size as the cell number and system size is increased simultaneously such that the packing fraction ρR remains constant. The cluster size distribution turns out to be bimodal for the considered packing fraction (Figures 12A–E). Figure 12F shows the probability of the rescaled cluster size for the system with the highest (N = 81) and smallest number of cells (N = 25). Note, however that the results display large fluctuations and conclusions have to be drawn with caution.
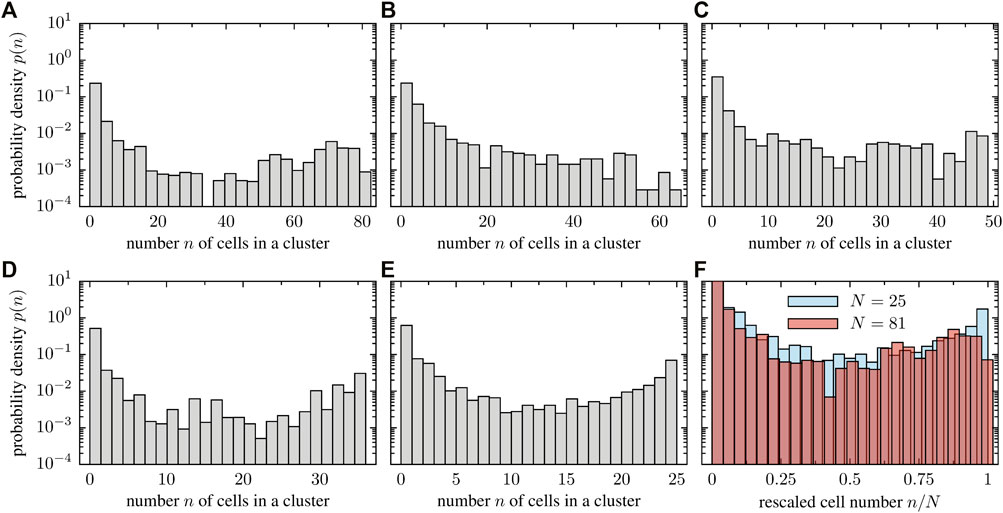
FIGURE 12. Cluster size distribution for a fixed packing fraction but various system sizes: (A) 81 cells and L = 108μm, (B) 64 cells and L = 96μm, (C) 49 cells and L = 84μm, (D) 36 cells and L = 72μm, (E) 25 cells and L = 60 μm. In panel (F), we overlay the probability distribution of the rescaled cluster size n/N for the smallest and largest particle number, indicating that the structure of the cluster size distribution is system size independent.
We have employed a generic mathematical model to describe the collective pattern formation of soft, deformable, self-driven cells. The model couples the intracellular biochemistry, responsible for cell polarization, the formation of membrane protrusions and, thus, for active motion, with a phase field which accounts for the current position and shape of the cell membrane. Each cell is described by an individual phase field. We include a repulsive interaction between cells into a previously established phase field model for individual cells [40] in order to prevent them from overlapping. This framework enables us to address the complex interplay of dynamic particle shape, nonlinear repulsive interactions, self-propelled motion and the emergence of collective patterns in the context of active matter.
Individual D. discoideum cells may aggregate following chemotactic signals to form a multicellular structure [62]. At large spatial scales, the chemotactic concentration and the density of cells can be modelled using reaction-diffusion equations [63]. In addition, there are several attempts to model the life cycle of D. discoideum from single cell shape changes and chemotaxis to collective behavior [64, 65].
Our modeling framework constitutes an active matter system composed of individual propellers, which are simple models of deformable cell like amoeba, e.g. D. discoideum cells. Whereas the role of particle shape [20, 21, 61] and the symmetries of interactions [18, 66] have extensively been debated for active matter systems, the relevance of the deformability of particles has seldomly been addressed [24, 53]. Oftentimes, active particles are considered as point-like objects or active spins [67], in the spirit of the seminal Vicsek model [18, 66], or as rigid objects such as active microswimmers [68], self-propelled discs [22] or rods [20]. The advantage of these approaches is their low computational cost, allowing to simulate several thousands of particles simultaneously. The computational cost associated with the incorporation of the deformability of particles, however, precludes the modeling of large amounts of individuals. We have arrived at around 100 cells in our simulations and, therefore, we are still far away from the limit considered in more theoretical studies. However, we made a first step towards connecting the dynamics at different scales, namely the intracellular pattern formation—responsible for the polarization of cells—and the collective dynamics of several individuals.
As observed in the simulations, cell deformation is an important aspect included in this work. It permits to recreate scenarios closer to reality, for example in the study of motility in reduced spaces such as narrow vessels in the process of cancer metastasis [69, 70]. This deformation is driven by the accumulation of a biochemical component inside the cell and by the interactions among the different cells present in the system. This characteristic is also observed when nonequilibrium stresses are built up during cluster formation and cells begin to deform. This is quite different from rigid spheres, where other mechanisms influence the motion.
The numerical simulations presented in this work reveal rich collective pattern formation phenomena. For rigid active particles, the symmetry of individuals determines the symmetry of the interaction potential and, thereby, constrain the symmetries of emergent patterns: self-propelled discs may undergo dynamic clustering or motility-induced phase separation [22, 71]; in the classical Vicsek model with polar alignment interaction, polarly ordered structures are observed at the macroscale [18, 66]; elliptical self-propelled rods, in contrast, may form polar or nematic patterns, which may even dynamically coexist, depending on the strength of self-propulsion [21, 72]. Collective dynamics of cells is strongly determined by the interactions among them. While we consider here only repulsion, there are other phenomena involved in cell-to-cell communication [73] and, in particular, in cell to cell contact-inhibition [74]. Such interactions can be easily included in our model. There are already some attempts to include deformation in collective cell dynamics. A protrusion region has been added to rigid spheres to simulate the deformation of the cells [45] and some phase field models have been already implemented to describe oscillations in epithelial cells [48]. Deformable cells, however, do not fall in any of these categories as the particle shape and, thus, the symmetry of the interactions, is a dynamic feature which is determined by intracellular biochemical processes as well as the complex, nonlinear interactions with other cells due to collisions that, in turn, induce additional cell shape changes. Accordingly, we found different interaction scenarios that may lead to alignment, anti-alignment and stuck/push configurations, whose relevance depends on the relative position and orientation of two cells before the collision event, the stiffness of particles as well as the global cell density.
The modeling framework decouples the actual displacement of a cell in space from the intracellular polarization dynamics. Therefore, we could establish cell polarity P and velocity V based on the biochemical concentration patches and spatial displacements, respectively, enabling us to quantify the intricate, nonlinear coupling of cell polarization and motion. We first analyzed it at the single-cell level for different parameters sets which could, for example, represent vegetative or starvation conditions of D. discoideum cells. Furthermore, we established how cell polarity and velocity vectors—as well as the angle between them—behave in ensembles of interacting cells and studied their density and system size dependence. For the considered model parameters, cell polarization depends only weakly on cell density, whereas the velocity of cells strongly decreases as the packing fraction is increased.
Our modeling framework allows to tune parameters such that the cell polarity is rather stable. The stability of the polarity axis, due to the intracellular pattern formation mechanisms described here, represents an effective memory on the polarity axis [75]. This memory precludes the formation of pseudopods at the side and at the rear of the cell [76] when cells follow a gradient of chemoattractant [77]. In this case, the polarity axis can be determined by the external gradient or by fitting an ellipsoid to the cell.
In single cell systems, velocity and polarity of cells are directly correlated. During persistent motion, most of the biochemical component inside the cell is accumulated behind the leading edge of the cell membrane; cell polarity and velocity vectors are aligned to a high degree, i.e. the angle between them is small. A random reorientation takes places if various patches of the biochemical concentration exist inside the cell, thereby inducing a misalignment of cell polarity and velocity vector.
In ensembles of interacting cells, a nontrivial coupling of cell polarization and velocity emerges dynamically due to cell-cell collisions. Even if parameters are tuned such that cells remain highly polarized (starvation conditions of D. discoideum), there is a density dependent contribution to the interaction between cell polarization and velocity. In particular, jamming of particles misaligns polarity P and velocity V; in the high density regime, stuck/push collisions during which cells stall each others motion are most prominent. Consequently, we observe transient clustering—clusters dynamically build-up and break apart. The stability of clusters is crucially determined by the deformability of cells: as cells are soft, the local anisotropic stress acting on one cell inside a cluster yields cell-shape changes which may eventually destabilize the entire cluster. At low packing fractions, in contrast, cells can move freely and persistently, reflected by the tendency of cell polarization and velocity to align.
Several model parameters were fixed within this study. There is potentially a plethora of modes of motility to be explored by changing the level of noise intensity, for example. Moreover, the modeling framework can be extended in many nontrivial ways in the future, e.g., including confinement, attractive interactions or collision-induced inhibition [45, 53, 54]. Specific modifications will enable to bring the modeling closer to a particular application, such as the study of collective cell motility in wound repair, immune response and tissue morphogenesis [78, 79].
In summary, we have developed a generic modeling framework to computationally simulate the dynamics of active matter systems which are composed of deformable particles, such as amoeboid cells. This method bridges the gap between the intracellular biochemical kinetics, in turn controlling the membrane activity of cells, the resulting locomotion of amoeboid cells and their emergent collective dynamics. Understanding self-organization processes of cells is of high relevance, for example for the aggregation processes of D. discoideum, but also for collective cell dynamics during immune responses and cancer spreading.
The raw data supporting the conclusions of this article will be made available by the authors, without undue reservation.
EM performed the numerical simulations; EM, RG, CB, and SA contributed to the design and implementation of the research, to the analysis of the results and to the writing of the manuscript.
SA and EM thank grant PGC2018-095456-B-I00 funded by MCIN/AEI/10.13039/501100011033 and by “ERDF A way of making Europe”, by the European Union. EM also acknowledges financial support from CONACYT. CB and RG acknowledge financial support by the Deutsche Forschungsgemeinschaft (DFG)—Project-ID 318763901—SFB1294, project B02.
The authors declare that the research was conducted in the absence of any commercial or financial relationships that could be construed as a potential conflict of interest.
All claims expressed in this article are solely those of the authors and do not necessarily represent those of their affiliated organizations, or those of the publisher, the editors, and the reviewers. Any product that may be evaluated in this article, or claim that may be made by its manufacturer, is not guaranteed or endorsed by the publisher.
SA and EM thank grant PGC2018-095456-B-I00 funded by MCIN/AEI/10.13039/501100011033 and by “ERDF A way of making Europe”, by the “European Union”.
The Supplementary Material for this article can be found online at: https://www.frontiersin.org/articles/10.3389/fphy.2021.750187/full#supplementary-material
1. Vicsek T, Zafeiris A. Collective Motion. Phys Rep (2012) 517:71–140. doi:10.1016/j.physrep.2012.03.004
2. Friedl P, Gilmour D. Collective Cell Migration in Morphogenesis, Regeneration and Cancer. Nat Rev Mol Cel Biol (2009) 10:445–57. doi:10.1038/nrm2720
3. Poujade M, Grasland-Mongrain E, Hertzog A, Jouanneau J, Chavrier P, Ladoux B, et al. Collective Migration of an Epithelial Monolayer in Response to a Model Wound. Proc Natl Acad Sci (2007) 104:15988–93. doi:10.1073/pnas.0705062104
4. Heisenberg C-P, Bellaïche Y. Forces in Tissue Morphogenesis and Patterning. Cell (2013) 153:948–62. doi:10.1016/j.cell.2013.05.008
5. Dormann D, Weijer CJ. Chemotactic Cell Movement during Development. Curr Opin Genet Dev (2003) 13:358–64. doi:10.1016/s0959-437x(03)00087-x
6. Montell DJ. Border-cell Migration: the Race Is on. Nat Rev Mol Cel Biol (2003) 4:13–24. doi:10.1038/nrm1006
7. Cheung KJ, Ewald AJ. A Collective Route to Metastasis: Seeding by Tumor Cell Clusters. Science (2016) 352:167–9. doi:10.1126/science.aaf6546
8. Friedl P, Locker J, Sahai E, Segall JE. Classifying Collective Cancer Cell Invasion. Nat Cel Biol (2012) 14:777–83. doi:10.1038/ncb2548
9. Blanchoin L, Boujemaa-Paterski R, Sykes C, Plastino J. Actin Dynamics, Architecture, and Mechanics in Cell Motility. Physiol Rev (2014) 94:235–63. doi:10.1152/physrev.00018.2013
10. Mitchison TJ, Cramer LP. Actin-based Cell Motility and Cell Locomotion. Cell (1996) 84:371–9. doi:10.1016/s0092-8674(00)81281-7
11. Alberts B, Johnson A, Lewis J, Morgan D, Raff M, Roberts K, et al. Molecular Biology of the Cell. W. W. Norton & Company (2015).
12. Farhadifar R, Röper J-C, Aigouy B, Eaton S, Jülicher F. The Influence of Cell Mechanics, Cell-Cell Interactions, and Proliferation on Epithelial Packing. Curr Biol (2007) 17:2095–104. doi:10.1016/j.cub.2007.11.049
13. Kabla AJ. Collective Cell Migration: Leadership, Invasion and Segregation. J R Soc Interf (2012) 9:3268–78. doi:10.1098/rsif.2012.0448
14. Petitjean L, Reffay M, Grasland-Mongrain E, Poujade M, Ladoux B, Buguin A, et al. Velocity fields in a Collectively Migrating Epithelium. Biophysical J (2010) 98:1790–800. doi:10.1016/j.bpj.2010.01.030
16. Alert R, Trepat X. Physical Models of Collective Cell Migration. Annu Rev Condens Matter Phys (2020) 11:77–101. doi:10.1146/annurev-conmatphys-031218-013516
17. Camley BA, Rappel W-J. Physical Models of Collective Cell Motility: from Cell to Tissue. J Phys D: Appl Phys (2017) 50:113002. doi:10.1088/1361-6463/aa56fe
18. Vicsek T, Czirók A, Ben-Jacob E, Cohen I, Shochet O. Novel Type of Phase Transition in a System of Self-Driven Particles. Phys Rev Lett (1995) 75:1226–9. doi:10.1103/physrevlett.75.1226
19. Grégoire G, Chaté H. Onset of Collective and Cohesive Motion. Phys Rev Lett (2004) 92:025702. doi:10.1103/PhysRevLett.92.025702
20. Bär M, Großmann R, Heidenreich S, Peruani F. Self-propelled Rods: Insights and Perspectives for Active Matter. Annu Rev Condens Matter Phys (2020) 11:441–66. doi:10.1146/annurev-conmatphys-031119-050611
21. Großmann R, Aranson IS, Peruani F. A Particle-Field Approach Bridges Phase Separation and Collective Motion in Active Matter. Nat Commun (2020) 11:5365. doi:10.1038/s41467-020-18978-5
22. Buttinoni I, Bialké J, Kümmel F, Löwen H, Bechinger C, Speck T. Dynamical Clustering and Phase Separation in Suspensions of Self-Propelled Colloidal Particles. Phys Rev Lett (2013) 110:238301. doi:10.1103/physrevlett.110.238301
23. Cates ME, Tailleur J. Motility-induced Phase Separation. Annu Rev Condens Matter Phys (2015) 6:219–44. doi:10.1146/annurev-conmatphys-031214-014710
24. Menzel AM, Ohta T. Soft Deformable Self-Propelled Particles. Epl (2012) 99:58001. doi:10.1209/0295-5075/99/58001
25. Glazier JA, Graner F. Simulation of the Differential Adhesion Driven Rearrangement of Biological Cells. Phys Rev E (1993) 47:2128–54. doi:10.1103/physreve.47.2128
26. Graner F, Glazier JA. Simulation of Biological Cell Sorting Using a Two-Dimensional Extended Potts Model. Phys Rev Lett (1992) 69:2013–6. doi:10.1103/physrevlett.69.2013
27. Nagai T, Honda H. A Dynamic Cell Model for the Formation of Epithelial Tissues. Philosophical Mag B (2001) 81:699–719. doi:10.1080/13642810108205772
28. Staple DB, Farhadifar R, Röper J-C, Aigouy B, Eaton S, Jülicher F. Mechanics and Remodelling of Cell Packings in Epithelia. Eur Phys J E (2010) 33:117–27. doi:10.1140/epje/i2010-10677-0
29. Li B, Sun SX. Coherent Motions in Confluent Cell Monolayer Sheets. Biophysical J (2014) 107:1532–41. doi:10.1016/j.bpj.2014.08.006
30. Bi D, Yang X, Marchetti MC, Manning ML. Motility-driven Glass and Jamming Transitions in Biological Tissues. Phys Rev X (2016) 6:021011. doi:10.1103/PhysRevX.6.021011
31. Alt S, Ganguly P, Salbreux G. Vertex Models: from Cell Mechanics to Tissue Morphogenesis. Phil Trans R Soc B (2017) 372:20150520. doi:10.1098/rstb.2015.0520
32. Kockelkoren J, Levine H, Rappel WJ. Computational Approach for Modeling Intra- and Extracellular Dynamics. Phys Rev E (2003) 68:037702. doi:10.1103/PhysRevE.68.037702
33. Camley BA, Zhao Y, Li B, Levine H, Rappel W-J. Periodic Migration in a Physical Model of Cells on Micropatterns. Phys Rev Lett (2013) 111:158102. doi:10.1103/physrevlett.111.158102
34. Shao D, Rappel W-J, Levine H. Computational Model for Cell Morphodynamics. Phys Rev Lett (2010) 105:108104. doi:10.1103/physrevlett.105.108104
35. Ziebert F, Swaminathan S, Aranson IS. Model for Self-Polarization and Motility of Keratocyte Fragments. J R Soc Interf (2012) 9:1084–92. doi:10.1098/rsif.2011.0433
36. Shao D, Levine H, Rappel W-J. Coupling Actin Flow, Adhesion, and Morphology in a Computational Cell Motility Model. Proc Natl Acad Sci (2012) 109:6851–6. doi:10.1073/pnas.1203252109
37. Löber J, Ziebert F, Aranson IS. Modeling Crawling Cell Movement on Soft Engineered Substrates. Soft Matter (2014) 10:1365–73. doi:10.1039/c3sm51597d
38. Camley BA, Zhao Y, Li B, Levine H, Rappel WJ. Crawling and Turning in a Minimal Reaction-Diffusion Cell Motility Model: Coupling Cell Shape and Biochemistry. Phys Rev E (2017) 95:012401. doi:10.1103/PhysRevE.95.012401
39. Najem S, Grant M. Phase-field Approach to Chemotactic Driving of Neutrophil Morphodynamics. Phys Rev E (2013) 88:034702. doi:10.1103/PhysRevE.88.034702
40. Alonso S, Stange M, Beta C. Modeling Random Crawling, Membrane Deformation and Intracellular Polarity of Motile Amoeboid Cells. PLoS ONE (2018) 13:e0201977. doi:10.1371/journal.pone.0201977
41. Moure A, Gomez H. Computational Model for Amoeboid Motion: Coupling Membrane and Cytosol Dynamics. Phys Rev E (2016) 94:042423. doi:10.1103/PhysRevE.94.042423
42. Moure A, Gomez H. Three-dimensional Simulation of Obstacle-Mediated Chemotaxis. Biomech Model Mechanobiol (2018) 17:1243–68. doi:10.1007/s10237-018-1023-x
43. Taniguchi D, Ishihara S, Oonuki T, Honda-Kitahara M, Kaneko K, Sawai S. Phase Geometries of Two-Dimensional Excitable Waves Govern Self-Organized Morphodynamics of Amoeboid Cells. Proc Natl Acad Sci (2013) 110:5016–21. doi:10.1073/pnas.1218025110
44. Flemming S, Font F, Alonso S, Beta C. How Cortical Waves Drive Fission of Motile Cells. Proc Natl Acad Sci USA (2020) 117:6330–8. doi:10.1073/pnas.1912428117
45. Coburn L, Cerone L, Torney C, Couzin ID, Neufeld Z. Tactile Interactions lead to Coherent Motion and Enhanced Chemotaxis of Migrating Cells. Phys Biol (2013) 10:046002. doi:10.1088/1478-3975/10/4/046002
46. Nonomura M. Study on Multicellular Systems Using a Phase Field Model. PLoS ONE (2012) 7:e33501. doi:10.1371/journal.pone.0033501
47. Palmieri B, Bresler Y, Wirtz D, Grant M. Multiple Scale Model for Cell Migration in Monolayers: Elastic Mismatch between Cells Enhances Motility. Sci Rep (2015) 5:11745. doi:10.1038/srep11745
48. Peyret G, Mueller R, d’Alessandro J, Begnaud S, Marcq P, Mège R-M, et al. Sustained Oscillations of Epithelial Cell Sheets. Biophysical J (2019) 117:464–78. doi:10.1016/j.bpj.2019.06.013
49. Mueller R, Yeomans JM, Doostmohammadi A. Emergence of Active Nematic Behavior in Monolayers of Isotropic Cells. Phys Rev Lett (2019) 122:048004. doi:10.1103/PhysRevLett.122.048004
50. Zhang G, Mueller R, Doostmohammadi A, Yeomans JM. Active Inter-cellular Forces in Collective Cell Motility. J R Soc Interf (2020) 17:20200312. doi:10.1098/rsif.2020.0312
51. Loewe B, Chiang M, Marenduzzo D, Marchetti MC. Solid-liquid Transition of Deformable and Overlapping Active Particles. Phys Rev Lett (2020) 125:038003. doi:10.1103/PhysRevLett.125.038003
52. Camley BA, Zhang Y, Zhao Y, Li B, Ben-Jacob E, Levine H, et al. Polarity Mechanisms Such as Contact Inhibition of Locomotion Regulate Persistent Rotational Motion of Mammalian Cells on Micropatterns. Proc Natl Acad Sci (2014) 111:14770–5. doi:10.1073/pnas.1414498111
53. Löber J, Ziebert F, Aranson IS. Collisions of Deformable Cells lead to Collective Migration. Sci Rep (2015) 5:9172. doi:10.1038/srep09172
54. Kulawiak DA, Camley BA, Rappel W-J. Modeling Contact Inhibition of Locomotion of Colliding Cells Migrating on Micropatterned Substrates. Plos Comput Biol (2016) 12:e1005239. doi:10.1371/journal.pcbi.1005239
55. Gregor T, Fujimoto K, Masaki N, Sawai S. The Onset of Collective Behavior in Social Amoebae. Science (2010) 328:1021–5. doi:10.1126/science.1183415
56. Siegert F, Weijer C. Digital Image Processing of Optical Density Wave Propagation in Dictyostelium discoideum and Analysis of the Effects of Caffeine and Ammonia. J Cel Sci (1989) 93:325–35. doi:10.1242/jcs.93.2.325
57. Grace M, Hütt M-T. Regulation of Spatiotemporal Patterns by Biological Variability: General Principles and Applications to Dictyostelium discoideum. Plos Comput Biol (2015) 11:e1004367. doi:10.1371/journal.pcbi.1004367
58. Vidal-Henriquez E, Gholami A. Spontaneous center Formation in Dictyostelium discoideum. Sci Rep (2019) 9:3935. doi:10.1038/s41598-019-40373-4
59. Moreno E, Flemming S, Font F, Holschneider M, Beta C, Alonso S. Modeling Cell Crawling Strategies with a Bistable Model: from Amoeboid to Fan-Shaped Cell Motion. Physica D: Nonlinear Phenomena (2020) 412:132591. doi:10.1016/j.physd.2020.132591
60. Park J, Holmes WR, Lee SH, Kim H-N, Kim D-H, Kwak MK, et al. Mechanochemical Feedback Underlies Coexistence of Qualitatively Distinct Cell Polarity Patterns within Diverse Cell Populations. Proc Natl Acad Sci USA (2017) 114:E5750–E5759. doi:10.1073/pnas.1700054114
61. Peruani F, Deutsch A, Bär M. Nonequilibrium Clustering of Self-Propelled Rods. Phys Rev E (2006) 74:030904. doi:10.1103/PhysRevE.74.030904
63. Vasiev BN, Hogeweg P, Panfilov AV. Simulation ofDictyostelium DiscoideumAggregation via Reaction-Diffusion Model. Phys Rev Lett (1994) 73:3173–6. doi:10.1103/physrevlett.73.3173
64. De Palo G, Yi D, Endres RG. A Critical-like Collective State Leads to Long-Range Cell Communication in Dictyostelium discoideum Aggregation. Plos Biol (2017) 15:e1002602. doi:10.1371/journal.pbio.1002602
65. Palsson E, Othmer HG. A Model for Individual and Collective Cell Movement in Dictyosteliumdiscoideum. Proc Natl Acad Sci (2000) 97:10448–53. doi:10.1073/pnas.97.19.10448
66. Chaté H. Dry Aligning Dilute Active Matter. Annu Rev Condens Matter Phys (2020) 11:189–212. doi:10.1146/annurev-conmatphys-031119-050752
67. Romanczuk P, Bär M, Ebeling W, Lindner B, Schimansky-Geier L. Active Brownian Particles. Eur Phys J Spec Top (2012) 202:1–162. doi:10.1140/epjst/e2012-01529-y
68. Elgeti J, Winkler RG, Gompper G. Physics of Microswimmers-Single Particle Motion and Collective Behavior: a Review. Rep Prog Phys (2015) 78:056601. doi:10.1088/0034-4885/78/5/056601
69. Keshavarz Motamed P, Maftoon N. A Systematic Approach for Developing Mechanistic Models for Realistic Simulation of Cancer Cell Motion and Deformation. Sci Rep (2021) 11:21545–18. doi:10.1038/s41598-021-00905-3
70. Nagel O, Guven C, Theves M, Driscoll M, Losert W, Beta C. Geometry-Driven Polarity in Motile Amoeboid Cells. PLoS ONE (2014) 9:e113382. doi:10.1371/journal.pone.0113382
71. Theurkauff I, Cottin-Bizonne C, Palacci J, Ybert C, Bocquet L. Dynamic Clustering in Active Colloidal Suspensions with Chemical Signaling. Phys Rev Lett (2012) 108:268303. doi:10.1103/physrevlett.108.268303
72. Huber L, Suzuki R, Krüger T, Frey E, Bausch AR. Emergence of Coexisting Ordered States in Active Matter Systems. Science (2018) 361:255–8. doi:10.1126/science.aao5434
73. Rappel W-J. Cell-cell Communication during Collective Migration. Proc Natl Acad Sci USA (2016) 113:1471–3. doi:10.1073/pnas.1524893113
74. Zimmermann J, Camley BA, Rappel W-J, Levine H. Contact Inhibition of Locomotion Determines Cell-Cell and Cell-Substrate Forces in Tissues. Proc Natl Acad Sci USA (2016) 113:2660–5. doi:10.1073/pnas.1522330113
75. van Haastert PJM. Short- and Long-Term Memory of Moving Amoeboid Cells. PLoS ONE (2021) 16:e0246345. doi:10.1371/journal.pone.0246345
76. Bosgraaf L, Van Haastert PJM. The Ordered Extension of Pseudopodia by Amoeboid Cells in the Absence of External Cues. PLoS ONE (2009) 4:e5253. doi:10.1371/journal.pone.0005253
77. Andrew N, Insall RH. Chemotaxis in Shallow Gradients Is Mediated Independently of PtdIns 3-kinase by Biased Choices between Random Protrusions. Nat Cel Biol (2007) 9:193–200. doi:10.1038/ncb1536
78. Deforet M, Hakim V, Yevick HG, Duclos G, Silberzan P. Emergence of Collective Modes and Tri-dimensional Structures from Epithelial Confinement. Nat Commun (2014) 5:3747. doi:10.1038/ncomms4747
Keywords: cell motility, cell polarity, reaction-diffusion models, cell-cell interactions, phase field model, collective motion, active matter
Citation: Moreno E, Großmann R, Beta C and Alonso S (2022) From Single to Collective Motion of Social Amoebae: A Computational Study of Interacting Cells. Front. Phys. 9:750187. doi: 10.3389/fphy.2021.750187
Received: 30 July 2021; Accepted: 31 December 2021;
Published: 02 February 2022.
Edited by:
Marco G. Mazza, Loughborough University, United KingdomReviewed by:
Fabian Jan Schwarzendahl, Heinrich Heine University of Düsseldorf, GermanyCopyright © 2022 Moreno, Großmann, Beta and Alonso. This is an open-access article distributed under the terms of the Creative Commons Attribution License (CC BY). The use, distribution or reproduction in other forums is permitted, provided the original author(s) and the copyright owner(s) are credited and that the original publication in this journal is cited, in accordance with accepted academic practice. No use, distribution or reproduction is permitted which does not comply with these terms.
*Correspondence: Sergio Alonso, cy5hbG9uc29AdXBjLmVkdQ==
Disclaimer: All claims expressed in this article are solely those of the authors and do not necessarily represent those of their affiliated organizations, or those of the publisher, the editors and the reviewers. Any product that may be evaluated in this article or claim that may be made by its manufacturer is not guaranteed or endorsed by the publisher.
Research integrity at Frontiers
Learn more about the work of our research integrity team to safeguard the quality of each article we publish.