 Zhiqiang Qu1
 Yujie Zhang
- 1School of Law, Central University of Finance and Economics, Beijing, China
- 2School of Finance, Shanxi University of Finance and Economics, Taiyuan, China
- 3School of Public Administration and Policy, Renmin University of China, Beijing, China
Joint punishment for dishonesty is an important means of administrative regulation. This research analyzed the dynamic characteristics of time series data from the Baidu search index using the keywords “joint punishment for dishonesty” based on a visibility graph network. Applying a visibility graph algorithm, time series data from the Baidu Index was transformed into complex networks, with parameters calculated to analyze the topological structure. Results showed differences in the use of joint punishment for dishonesty in certain provinces by calculating the parameters of the time series network from January 1, 2020 to May 27, 2021; it was also shown that most of the networks were scale-free. Finally, the results of K-means clustering showed that the 31 provinces (excluding Hong Kong, Macao and Taiwan) can be divided into four types. Meanwhile, by analyzing the national Baidu Index data from 2020 to May 2021, the period of the time series data and the influence range of the central node were found.
Introduction
Credit tools play a key role in the context of big data as a means of government regulation and must follow the principle of the rule of law. Since the 18th CPC National Congress, central government has put forward a series of new requirements for the construction of social credit, which have resulted in a new emphasis on the social credit system. In 2014, the State Council issued the “Planning Outline for the Construction of a Social Credit System (2014–2020)”1, which proposed to build a credit reference system covering all the population by 2020. In the same year, the State Council’s “Government Work Report”2 set out a clear intention “to establish a blacklist system for enterprises that violate the principle of market competition and infringe on the rights and interests of consumers, so as to make it difficult for those who break faith.” In 2017, Shanghai took the lead in issuing social credit regulations, which established the social credit management system in the form of local laws and legislation. However, credit regulation is based on credit evaluation. Credit is not a legal concept in the strictest sense but is a product of China’s social construction process. In recent years, the joint punishment mechanism based on the social credit system has become common, although the concept of credit is not clear, which results in the generalization of punishment for dishonesty. The newly revised “Civil Servant Law” stipulates that those “listed as the Joint Disciplinary object of dishonesty according to law” shall not be employed as civil servants. Although the joint disciplinary mechanisms of credit have a profound impact on the rights of citizens in practice, the meaning of this revision is not clear.
This paper uses the Baidu Index as the research object with the keyword “joint punishment for dishonesty.” Current research exists on ways of monitoring using the browser search index, for example, on the detection and prediction of diseases [1–7]. As the largest search engine in China, Baidu has more than 80 per cent of the market share3. At present, there are many applications of Baidu index analysis in China, such as forecasting the number of tourists4 [8, 9] and stock market prices [10–12], and of more recent significance, estimating the prevalence of influenza and other diseases [13, 14], predicting the incidence of Hand, Foot and Mouth Disease (HFMD) in real time [15–17], and monitoring the AIDS epidemic [18].
Related literature maps the time series analysis of complex networks [19–21]. For example, a specific period is extracted from a non-cyclical time series to use as a node. For a pair of nodes, the shortest one moves along the other, and the strongest correlation is the coupling strength between the two nodes. If the coupling strength is greater than the threshold, the two nodes are connected [22–24]. There are several variations of this method. For example, all possible segments with a specified length can simply be seen as nodes [25–29] and then each node linked to its nearest neighbor of the same length [30]. The network graph generated is embedded in the two-dimensional space in the pane filter, and the correlation is strong and the relationship maintained as much as possible [31]. One exciting task is to deconstruct the initial sequence into components through multi-resolution analysis to use as nodes [32]. In addition, scholars explored non-liner and uncertain complex valued networks [33, 34]. In the empirical study, scholars have also tried to analyze United States regional power market, search index and stock price by visualization graph method for time series data [35–37].
In recent years, punishment for dishonesty has increased along with more social awareness about dishonesty. Therefore, the study of the fluctuation characteristics and influence mechanisms of the Baidu Index using the keywords “joint punishment for dishonesty” can assist state organs to formulate more effective measures and policies, to improve people’s awareness of the regulations and their rights, and to build a society ruled by law.
The System Concept of Joint Disciplinary Measures for Dishonesty
Social credit is understood as a tool to protect market economy transactions in a form of market credit. Since 2011, social credit and social credit tools have gradually become important innovative means of social governance and have been incorporated into the government legislative plan, which is an important measure of the system’s socialist core values.
The System Concept of Joint Disciplinary Measures for Dishonesty from a Functional Perspective
To a certain extent, China’s urbanization can be seen as the process of transformation from acquaintance society to stranger society. Credit in acquaintance society is based on personality, and in particular, on moral constraints. In stranger society, the information asymmetry between the two sides of the social market transaction requires a third-party credit guarantee, which is the same for third-party institutions, e.g., certification and accreditation. From a national governance perspective, China first proposed social credit to protect economic transactions, focusing on financial credit. Therefore, a social credit tool results in the spontaneous formation of a social market economy from the outset, which ensures fairness and symmetry of market transaction information. Currently, credit is a governance tool, focusing on the security of economic transactions, market expansion, transaction costs and other information.
With the rapid development of the economy and the transformation of society, credit as a governance tool is not limited to ensuring secure economic transactions; it has been extended to the social public domain, becoming a valuable tool for social governance. For example, in the State Council’s “Planning Outline for the Construction of a Social Credit System (2014–2020)”5, it is clearly stated that this system is an important part of both the socialist market economic system and social governance system. The credit tool is a means of social management.
Joint Disciplinary Measures for Dishonesty as a Means of Government Regulation
Regulation refers to the restriction of the activities of individuals and economic subjects in a specific society according to certain rules. As a means of government regulation, a credit tool is also important for improving market failure and enhancing social governance. In terms of the system setting, disciplinary measures for dishonesty are an important way to improve the socialist market economy, solve market failure and ease the information asymmetry between the transaction subjects. According to the subject classification, regulation can be divided into public and private. In the current joint punishment of dishonesty, such as Ant’s credit system and that of other private organizations, credit is not included in the joint punishment system. Therefore, the joint disciplinary measures for dishonesty can be understood generally to be a regulatory tool for the collection, evaluation, classification, sharing and making public information about the credit of citizens, legal professionals or other organizations in the course of their duties.
Using the normative and working documents produced by the central administrative departments and local governments, joint disciplinary measures for dishonesty can be divided into the following types: 1) cancelling an individual’s qualification, which has an impact similar to “market prohibition”; 2) reducing “entry” opportunities and thereby reducing access to these opportunities; 3) greater supervision of the subject to “increase the frequency of inspection” and “strengthen on-site verification”; 4) publishing a “blacklist” in relation to dishonesty, thereby impacting on reputation. These four types are characterized by administrative, punitive punishment. According to guidance6 issued by the State Council in 2016 on establishing and improving the joint incentive and punishment system for promise keeping and building social integrity, the specific joint punishment for breaking a promise generally includes four elements: administrative constraints and punishment, market constraints and punishment, industrial constraints and punishment, and social constraints and punishment. Typical administrative restrictions and punishments include “market and industry prohibition measures for enterprises with serious dishonesty and their legal representatives, main responsible persons and registered practitioners who are directly responsible for dishonesty.” Market constraints and disciplinary measures include “restricting exit and purchase of real estate, flying, taking high-grade trains and seats, traveling and vacationing, staying in star rated hotels and other high consumption behaviors.” Industry regulation and punishment include “supporting industry associations and chambers of commerce to implement disciplinary measures such as warning, criticism in the industry, public condemnation, rejection, and persuasion against dishonest members according to industry standards, industry rules, and trade agreements, depending on the seriousness of the case.” Social constraints and punishment include “encouraging fair, independent and conditional social institutions to carry out big data public opinion monitoring of dishonesty and preparing and publishing regional and industrial credit analysis reports.” Therefore, it is not difficult to see that joint disciplinary measures for dishonesty have the same characteristics as administrative punishment. In this case, social credit legislation is needed. The fundamental feature of China is that the people are the leaders of the country, and legislation is based on their concerns. Therefore, people’s interest in social credit is an important way of promoting social credit legislation.
Methodology and Materials
Complex Networks
Many complex systems in nature can be described as networks. A typical network is composed of many nodes and the edges between them, with the nodes used to represent different individuals, and the edges representing the relationship between these. A complex network can be abstracted as a graph
Structural Characteristics of Complex Networks
The three robust measures of network topology are average path length, clustering coefficient and degree distribution.
Average Path Length
Average path length
This shows that the average path length depends on the system size but does not change drastically with it.
Clustering Coefficient
In a network, the clustering coefficient of nodes is the proportion of the number of edges between all nodes adjacent to the node, to the maximum possible number of edges between these adjacent nodes. If node
The clustering coefficient of the whole network refers to the mean value of the clustering coefficient of all nodes in the network, which reflects the local characteristics of the network, i.e., the probability that two adjacent nodes to the same node are still adjacent. The clustering coefficient
Degree Distribution
The degree
Degree distribution
Visibility Graph Algorithm for Time Series Data
This research applied a visibility graph algorithm proposed by Lacasa to construct the network. The time series data from the Baidu search index of 31 provinces, autonomous regions and cities in China (excluding Hong Kong, Macao and Taiwan) with the keywords “joint punishment for dishonesty” is transformed into complex networks.
Figure 1 presents the principle of the visibility graph algorithm for time series data, with the time series data transferred to a bar chart. The column shows the data at each time point. If the tops of two columns are visible (i.e., they can directly connect) to each other, the two points are connected. Based on the above theory, time series data can be transferred to a complex network.
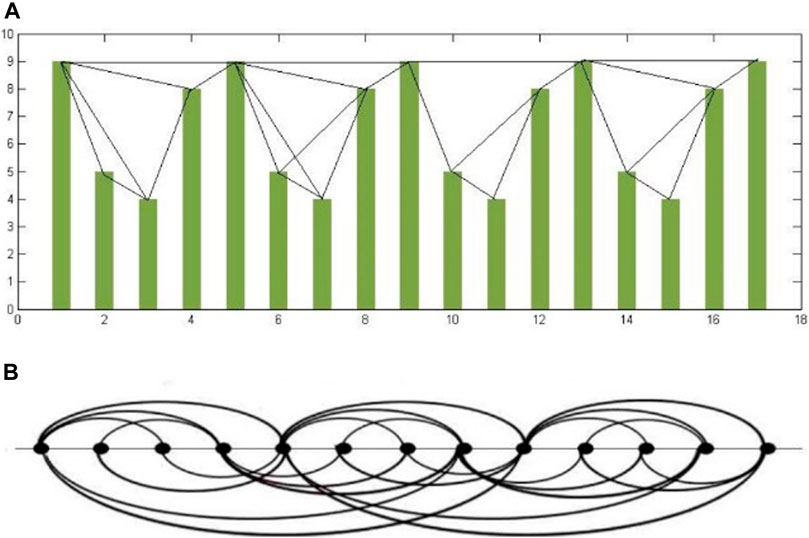
FIGURE 1. Visibility graph algorithm.
First, the time nodes
Second, the adjacency matrix is constructed according to the time series nodes and edges.
Finally, the network graph is created.
K-Means Clustering
The k-means clustering algorithm is an iterative clustering algorithm and is the most used based on Euclidean distance. It assumes that the shorter the distance between the two targets, the greater the similarity. The steps are as follows.
First, the data are divided into k groups, then “K” samples are randomly selected as the initial clustering center.
Second, for each sample
Third, for each category
This process will continue to cycle until the following conditions are satisfied: 1) no (or minimum) objects are reassigned to different clusters; 2) no (or minimum) clustering centers change again, and the sum of squared errors is locally minimum.
Data and Materials
This paper uses data generated by the Baidu Index, which is one of the main statistical data analysis platforms in the era of big data and, as such, is an important basis for analysis and decision-making. The so-called search index is based on the volume of searches generated by Baidu users, using keywords as statistical index parameters. Through a series of scientific calculations, the weighted sum of a keyword is calculated. The general public’s concern about dishonesty can also demonstrate their concern to build a credit society. As internet searching is an important source of information for the public, the level of the Baidu Index reflects the level of public awareness about the construction of a credit society.
Results
This paper uses the Baidu search index from the 31 provinces from January 1, 2020, to May 27, 2021, and the keywords “joint punishment for dishonesty”. The parameters of the original data are shown in Table 1.
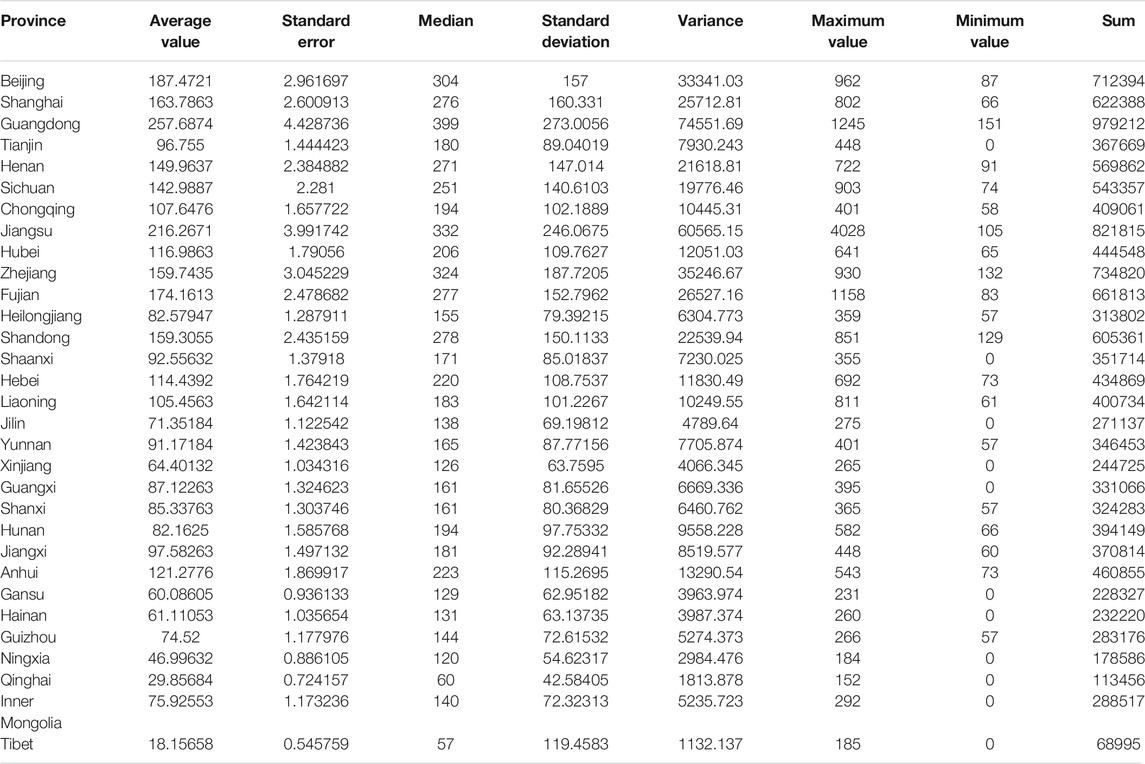
TABLE 1. Original data from the Baidu search index in various provinces and cities.
An examination of the original data clearly shows that the average value, standard error, median, minimum value and sum of the economically developed areas, such as Guangdong and Jiangsu, are larger, and the average value, standard error, median, minimum value and sum of the economically backward areas, such as Qinghai and Tibet, are lower. The maximum, variance and standard deviation are also large in Guangdong and Jiangsu, while other areas are low, for example, Guangdong standard deviation reaches 273.0056 and Qinghai standard deviation is only 42.58405.
Discussion
Construction of a Visibility Map Network in China
By constructing the Baidu search index network of the 31 provinces, the visibility network diagram was produced. See Figure 2 for the schematic diagram.
FIGURE 2. Visibility network parameters.
The parameters are shown in Table 2. The higher the average clustering coefficient and the greater number of edges, the closer the relationship between time nodes. The larger the average path length and degree, the less close is the relationship between time and search behavior.
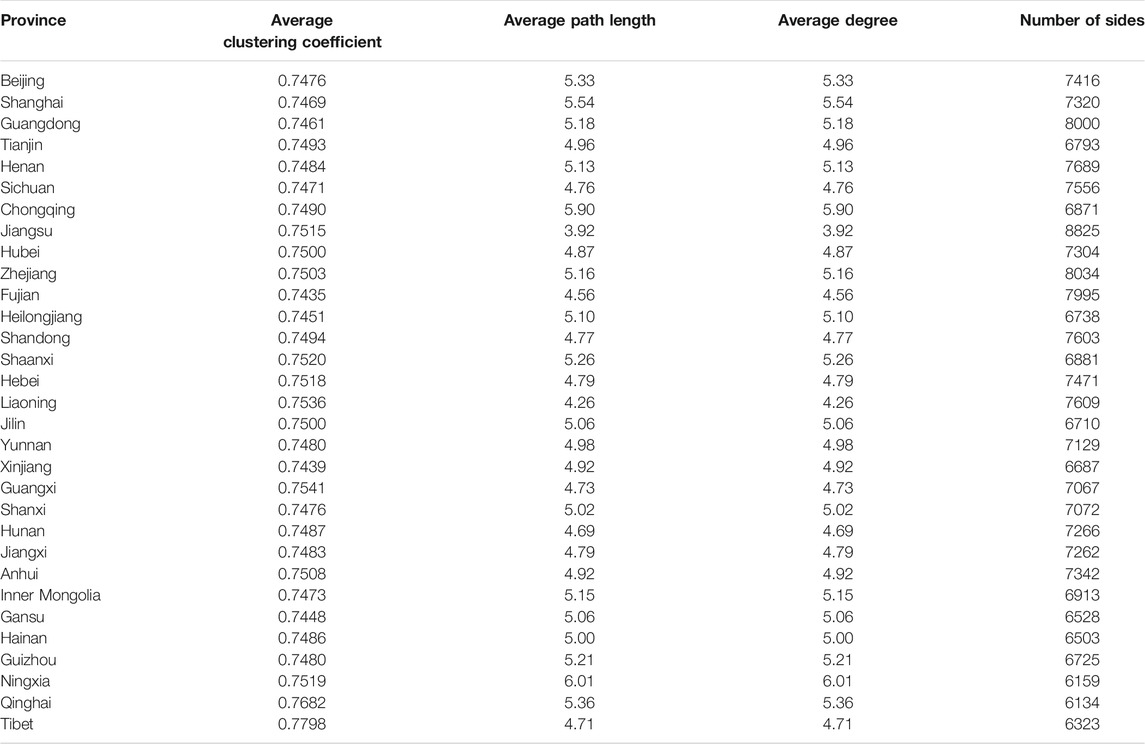
TABLE 2. Visibility network parameters.
The data shows a positive correlation between the daily search volume of each province; therefore, an analysis of past data can provide a predictive function of future search volume.
Network Degree Distribution
Figure 3 represents the power-law distribution of the complex network in Beijing, showing that the visibility graph network is scale-free. There are more time nodes with fewer edges, and the proportion of nodes with larger degree values is smaller. As the degree increases, the number of nodes decreases.
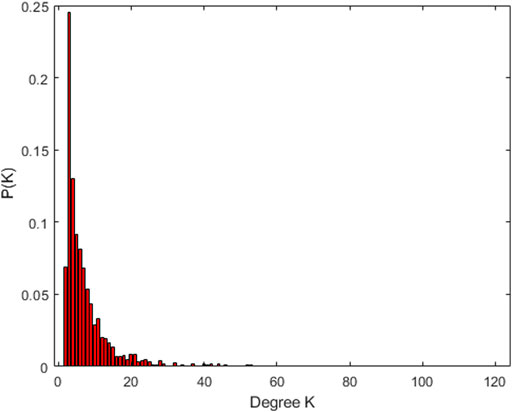
FIGURE 3. Power distribution of visibility network in Beijing.
The degree distribution shows that the Baidu comprehensive search index in Beijing is a fractal time series with long-term correlation. The original time series are in different time ranges, however, due to long-term correlation, any future changes to the Baidu search index in Beijing may result in similar time ranges to previous ones. See the Supplementary Appendix for the visibility network distribution map of other provinces and cities.
K-Means Clustering
The k-means clustering method is used to cluster the data from the 31 provinces, autonomous regions and cities. Using the elbow method, it is found that the slope increases significantly in four places (as shown in Figure 4). The schematic diagram of clustering results is shown in Figure 5. The provinces, autonomous regions and cities under each category display similar attention to the joint punishment of dishonesty from January 1, 2020, to May 27, 2021.
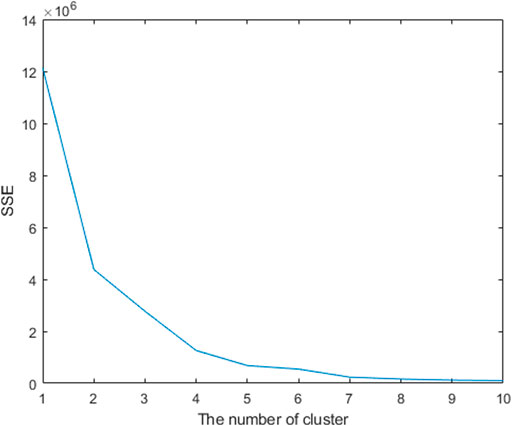
FIGURE 4. Elbow method result for k-means.
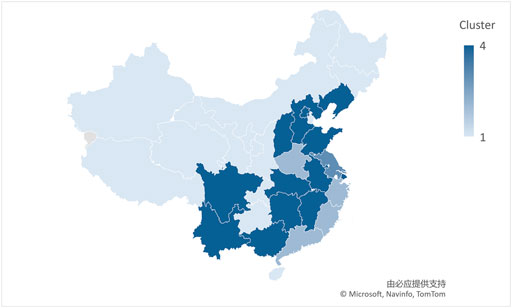
FIGURE 5. K-means clustering result by K = 4.
Figure 5 shows that the 31 provinces and cities are divided into four categories: Xinjiang, Tibet, Gansu, Qinghai, Hainan, Ningxia, Guizhou, Heilongjiang and Jilin are combined into the first group; Guangdong, Fujian, Zhejiang, Sichuan, Liaoning, Hebei, Henan and Shandong are the second group; and Jiangsu Province is the third group. Inner Mongolia, Shanxi, Shaanxi, Hunan, Hubei, Anhui, Jiangxi, Guangxi, Yunnan, Chongqing, Beijing and Shanghai make up the fourth group.
The Baidu search index, which is a combination of dishonesty and punishment, reflects changes in attention at the province and city levels on social credit. The first group of networks has a larger diameter, smaller edges, and lower average degree and clustering coefficient reflecting a weak association between nodes, relatively backward economic and social credit degree, and the underdevelopment of social credit legislation. The second group is in the mid-range in terms of diameter, edge, average, cluster coefficient and density, and there is a relationship between nodes; this reflects that in 2021, there is a high level of concern about joint punishment for dishonesty. In some places, relevant local regulations and administrative normative documents have been issued, which standardize the punishments for dishonesty, however, the standard density is not as good as that of the third group. For the fourth group of provinces and cities, the network edge, average degree, clustering coefficient and density are relatively high, indicating that the relationship between nodes is close. In 2021, there was great concern about joint punishment for dishonesty in such places, shown by the amount of normative documentation and research published. For example, Hunan first established the credit risk management college to study and analyze the credit risk.
Conclusion
Legislation should reflect the concerns of the people. Therefore, by analyzing the focus on “joint punishment for dishonesty”, this paper provides evidence-based, theoretical support for the further promotion of social credit legislation and the construction of a credit society. Based on the Baidu search index of 31 provinces, this paper transforms the original time series into a visibility graph network, studying its dynamic characteristics to offer a new perspective from which to analyze the time series of “joint punishment for dishonesty”. Results show that there are differences in the degree of concern in China’s provinces, autonomous regions and municipalities on this issue. Cluster analysis allows the similarity of each province to be clearly seen. At the same time, through the division of time series, the visibility graph algorithm is used to analyze and predict the people’s legislative demands.
This paper innovatively introduces visibility graph method to advance research in social credit legislation. Limited to the data, only the social attention of joint punishment for dishonesty is analyzed. Next, we will further mine the credit data, using HVD (horizontal visibility graph) and other complex network methods, combining the time data of credit legislation, to explore the relationship and mechanisms between credit attention and credit legislation.
Data Availability Statement
The datasets presented in this article are not readily available because they are charged by Baidu Index database (https://index.baidu.com/v2/index.html#/). Requests to access the dataset should only be downloaded with Baidu's consent and restrictions.
Author Contributions
QZ: Visualization, Software, Computation, Drawing and Writing ZY: Conceptualization, Investigation, Visualization, Software LF: Methodology, Validation, Writing-Reviewing and Editing.
Conflict of Interest
The authors declare that the research was conducted in the absence of any commercial or financial relationships that could be construed as a potential conflict of interest.
Publisher’s Note
All claims expressed in this article are solely those of the authors and do not necessarily represent those of their affiliated organizations, or those of the publisher, the editors and the reviewers. Any product that may be evaluated in this article, or claim that may be made by its manufacturer, is not guaranteed or endorsed by the publisher.
Supplementary Material
The Supplementary Material for this article can be found online at: https://www.frontiersin.org/articles/10.3389/fphy.2021.746660/full#supplementary-material
Footnotes
1http://www.gov.cn/xinwen/2014-06/27/content_2708964.htm
2http://www.gov.cn/guowuyuan/2014-03/14/content_2638989.htm
3http://www.cnnic.net.cn/hlwfzyj/hlwxzbg/ssbg/201401/P020140127366465515288.pdf
4https://www.chinainternetwatch.com/17415/search-engine-2012-2018e/
5http://www.gov.cn/xinwen/2014-06/27/content_2708964.htm
6http://www.gov.cn/zhengce/content/2016-06/12/content_5081222.htm
References
1. Kandula S, Shaman J. Reappraising the utility of Google flu trends. Plos Comput Biol (2019) 15(8):e1007258. doi:10.1371/journal.pcbi.1007258
2. Aguilera AM, Fortuna F, Escabias M, Di Battista T. Assessing Social Interest in Burnout Using Google Trends Data. Soc Indic Res (2021) 156(2):587–99. doi:10.1007/s11205-019-02250-5
3. Polgreen PM, Chen Y, Pennock DM, Nelson FD, Weinstein RA. Using internet searches for influenza surveillance. Clin Infect Dis (2008) 47:1443–8. doi:10.1086/593098
4. Kang M, Zhong H, He J, Rutherford S, Yang F. Using Google trends for influenza surveillance in South China. PloS one (2013) 8(1):e55205. doi:10.1371/journal.pone.0055205
5. Dugas AF, Jalalpour M, Gel Y, Levin S, Torcaso F, Igusa T, et al. Influenza forecasting with Google flu trends. PloS one (2013) 8(2):e56176. doi:10.1371/journal.pone.0056176
6. Thompson LH, Malik MT, Gumel A, Strome T, Mahmud SM. Emergency department and 'Google flu trends' data as syndromic surveillance indicators for seasonal influenza. Epidemiol Infect (2014) 142:2397–405. doi:10.1017/S0950268813003464
7. Chan EH, Sahai V, Conrad C, Brownstein JS. Using web search query data to monitor dengue epidemics: a new model for neglected tropical disease surveillance. Plos Negl Trop Dis (2011) 5(5):e1206. doi:10.1371/journal.pntd.0001206
8. Huang X, Zhang L, Ding Y. The Baidu Index: Uses in predicting tourism flows -A case study of the Forbidden City. Tourism Manag (2017) 58:301–6. doi:10.1016/j.tourman.2016.03.015
9. Yang X, Pan B, Evans JA, Lv B. Forecasting Chinese tourist volume with search engine data. Tourism Manag (2015) 46:386–97. doi:10.1016/j.tourman.2014.07.019
10. Sun S, Wei Y, Tsui K-L, Wang S. Forecasting tourist arrivals with machine learning and internet search index. Tourism Manag (2019) 70:1–10. doi:10.1016/j.tourman.2018.07.010
11. Zhao R. Inferring private information from online news and searches: Correlation and prediction in Chinese stock market. Physica A: Stat Mech its Appl (2019) 528:121450. doi:10.1016/j.physa.2019.121450
12. Yuan Z, Wenbin B. The impact of investors' attention on stock returns - Study based on Baidu Index [Conference presentation]. In: International Conference on Service Systems & Service Management,. New Jersey: IEEE (2014).
13. Dong J, Dai W, Liu Y, Yu L, Wang J. Forecasting Chinese Stock Market Prices using Baidu Search Index with a Learning-Based Data Collection Method. Int J Info Tech Dec Mak (2019) 18:1605–29. doi:10.1142/S0219622019500287
14. Yuan Q, Nsoesie EO, Lv B, Peng G, Chunara R, Brownstein JS. Monitoring influenza epidemics in China with search query from Baidu. PloS one (2013) 8:e64323. doi:10.1371/journal.pone.0064323
15. Su K, Xu L, Li G, Ruan X, Li X, Deng P, et al. Forecasting influenza activity using self-adaptive AI model and multi-source data in Chongqing, China. Ebiomedicine (2019) 47:284–92. doi:10.1016/j.ebiom.2019.08.024
16. Zhao Y, Xu Q, Chen Y, Tsui KL. Using Baidu index to nowcast hand-foot-mouth disease in China: a meta learning approach. BMC Infect Dis (2018) 18:398. doi:10.1186/s12879-018-3285-4
17. Chen S, Liu X, Wu Y, Xu G, Zhang X, Mei S, et al. The application of meteorological data and search index data in improving the prediction of HFMD: A study of two cities in Guangdong Province, China. Sci Total Environ (2019) 652:1013–21. doi:10.1016/j.scitotenv.2018.10.304
18. Li K, Liu M, Feng Y, Ning C, Ou W, Sun J, et al. Using Baidu Search Engine to Monitor AIDS Epidemics Inform for Targeted intervention of HIV/AIDS in China. Sci Rep (2019) 9(1):320. doi:10.1038/s41598-018-35685-w
19. Gao Z-K, Small M, Kurths J. Complex network analysis of time series. Europhys Lett (2006) 116(5):50001.
20. Zhao L-L, Tang Z, Wang J-Y, Wang J-B, Yang H-J. Time series analysis based upon complex network. J Univ Shanghai Sci Technol (2011) 33(1):47–52. (in Chinese).
21. Zou Y, Donner RV, Marwan N, Donges JF, Kurths J. Complex network approaches to nonlinear time series analysis. Phys Rep (2019) 787:1–97. doi:10.1016/j.physrep.2018.10.005
22. Zhang J, Small M. Complex Network from Pseudoperiodic Time Series: Topology versus Dynamics. Phys Rev Lett (2006) 96(23):238701. doi:10.1103/PhysRevLett.96.238701
23. Zhang J, Luo X, Nakamura T, Sun J, Small M. Detecting temporal and spatial correlations in pseudoperiodic time series. Phys Rev E (2007) 75(1):016218. doi:10.1103/PhysRevE.75.016218
24. Zhang J, Sun J, Luo X, Zhang K, Nakamura T, Small M. Characterizing pseudoperiodic time series through the complex network approach. Physica D: Nonlinear Phenomena (2008) 237(22):2856–65. doi:10.1016/j.physd.2008.05.008
25. Yang Y, Yang H. Complex network-based time series analysis. Physica A: Stat Mech its Appl (2008) 387(5):1381–6. doi:10.1016/j.physa.2007.10.055
26. Gao Z, Jin N. Flow-pattern identification and nonlinear dynamics of gas-liquid two-phase flow in complex networks. Phys Rev E (2009) 79:066303. doi:10.1103/PhysRevE.79.066303
27. Marwan N, Donges JF, Zou Y, Donner RV, Kurths J. Complex network approach for recurrence analysis of time series. Phys Lett A (2009) 373:4246–54. doi:10.1016/j.physleta.2009.09.042
28. Donner RV, Zou Y, Donges JF, Marwan N, Kurths J. Recurrence networks-a novel paradigm for nonlinear time series analysis. New J Phys (2010) 12(3):033025. doi:10.1088/1367-2630/12/3/033025
29. Wang J, Yang H. Complex network-based analysis of air temperature data in China. Mod Phys Lett B (2009) 23(14):1781–9. doi:10.1142/S0217984909019946
30. Pham TD. From fuzzy recurrence plots to scalable recurrence networks of time series. Epl (2017) 118(2):20003. doi:10.1209/0295-5075/118/20003
31. Xu X, Zhang J, Small M. Superfamily phenomena and motifs of networks induced from time series. Proc Natl Acad Sci (2008) 105(50):19601–5. –05. doi:10.1073/pnas.0806082105
32. Tumminello M, Aste T, Di Matteo T, Mantegna RN. A tool for filtering information in complex systems. Proc Natl Acad Sci (2005) 102(30):10421–6. doi:10.1073/pnas.0500298102
33. Yuan M, Wang W, Wang Z, Luo X, Kurths J. Exponential Synchronization of Delayed Memristor-Based Uncertain Complex-Valued Neural Networks for Image Protection. IEEE Trans Neural Netw Learn Syst (2021) 32(1):151–65. doi:10.1109/tnnls.2020.2977614
34. Gao Z-K, Li S, Dang W-D, Yang Y-X, Do Y, Grebogi C. Wavelet multiresolution complex network for analyzing multivariate nonlinear time series. Int J Bifurcation Chaos (2017) 27(08):1750123. doi:10.1142/S0218127417501231
35. HuXia JC, Xia C, Li H, Zhu P, Xiong W. Properties and structural analyses of USA's regional electricity market: A visibility graph network approach. Appl Math Comput (2020) 385(2020):125434. doi:10.1016/j.amc.2020.125434
36. Zhang Y-J, Meng K, Gao T, Song Y-Q, Hu J, Ti E-P. Analysis of attention on venture capital: A method of complex network on time series. Int J Mod Phys B (2020) 34:2050273. doi:10.1142/S0217979220502732
Keywords: joint punishment for dishonesty, visibility network, Baidu index, social credit system, time series network analysis
Citation: Qu ZQ, Zhang YJ and Li F (2021) Analyzing Levels of Concern About Joint Punishment for Dishonesty Using the Visibility Graph Network. Front. Phys. 9:746660. doi: 10.3389/fphy.2021.746660
Received: 24 July 2021; Accepted: 13 September 2021;
Published: 04 October 2021.
Edited by:
Peican Zhu, Northwestern Polytechnical University, ChinaReviewed by:
Manman Yuan, University of Science and Technology Beijing, ChinaXiaopeng Li, Tianjin University of Technology, China
Copyright © 2021 Qu, Zhang and Li. This is an open-access article distributed under the terms of the Creative Commons Attribution License (CC BY). The use, distribution or reproduction in other forums is permitted, provided the original author(s) and the copyright owner(s) are credited and that the original publication in this journal is cited, in accordance with accepted academic practice. No use, distribution or reproduction is permitted which does not comply with these terms.
*Correspondence: Yujie Zhang, emhhbmd5amF5ZUAxNjMuY29t